

Perinatal Health Outcomes Across Rural and Nonrural Counties Within a Single Health System Catchment
- PMID: 37096122
- PMCID: PMC10122232
- DOI: 10.1089/whr.2022.0061
Perinatal Health Outcomes Across Rural and Nonrural Counties Within a Single Health System Catchment
Abstract
Background: Perinatal health outcomes are influenced by a variety of socioeconomic, behavioral, and economic factors that reduce access to health services. Despite these observations, rural communities continue to face barriers, including a lack of resources and the fragmentation of health services.
Objective: To evaluate patterns in health outcomes, health behaviors, socioeconomic vulnerability, and sociodemographic characteristics across rural and nonrural counties within a single health system catchment area.
Methods: Socioeconomic vulnerability metrics, health care access as determined by licensed provider metrics, and behavioral data were obtained from FlHealthCHARTS.gov and the County Health Rankings. County-level birth and health data were obtained from the Florida Department of Health. The University of Florida Health Perinatal Catchment Area (UFHPCA) was defined as all Florida counties where ≥5% of all infants were delivered at Shands Hospital between June 2011 and April 2017.
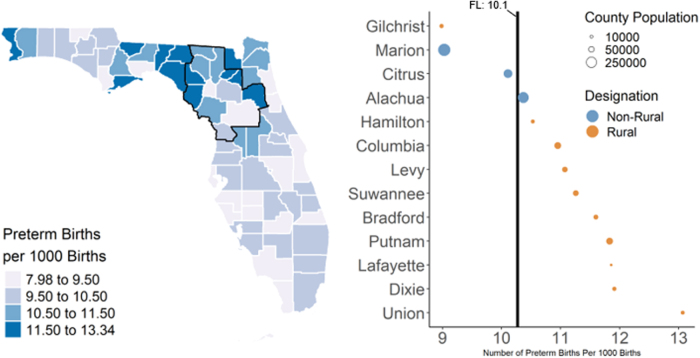
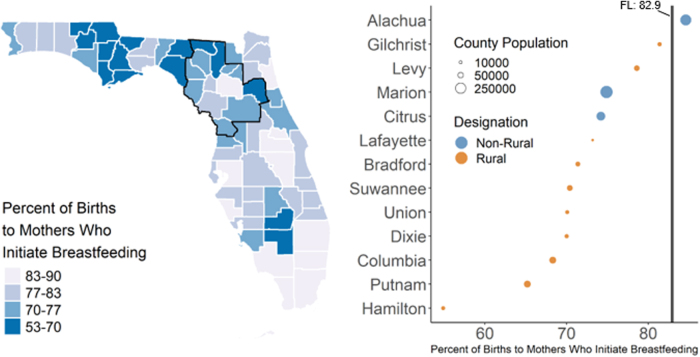
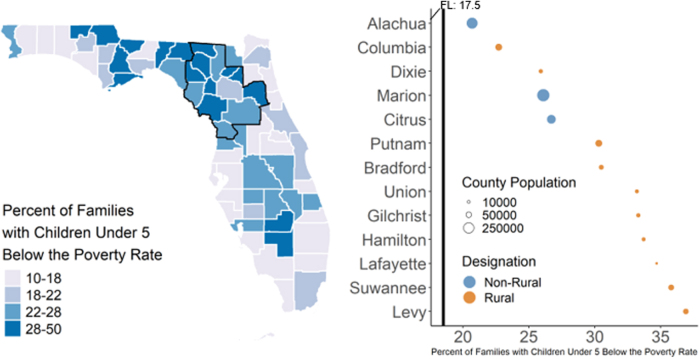
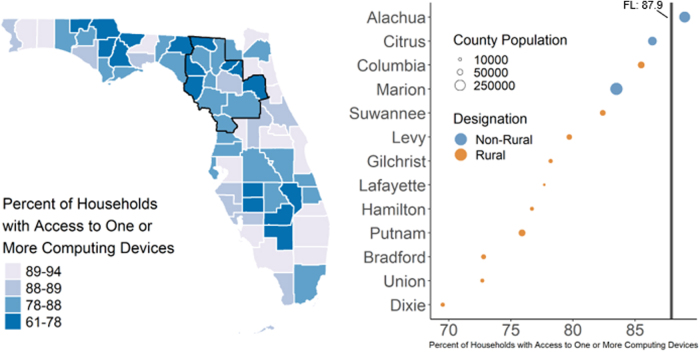
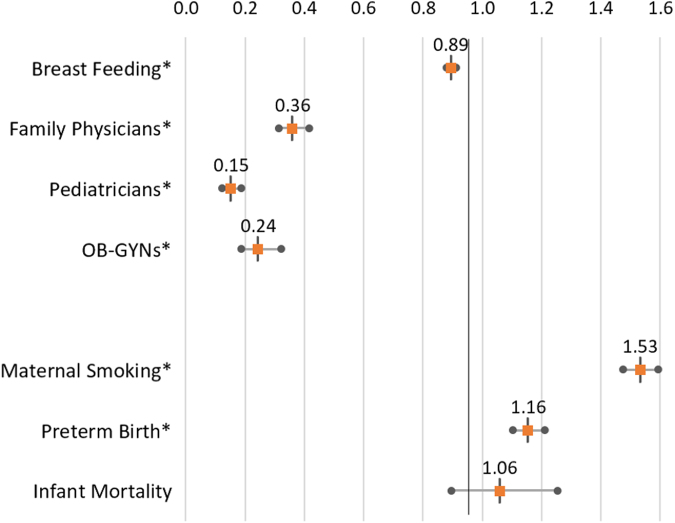
Results: The UFHPCA included 3 nonrural and 10 rural counties that represented more than 64,000 deliveries. Nearly 1 in 3 infants resided in a rural county, and 7 out of 13 counties did not have a licensed obstetrician gynecologist. Maternal smoking rates (range 6.8%-24.8%) were above the statewide rate (6.2%). Except for Alachua County, breastfeeding initiation rates (range 54.9%-81.4%) and access to household computing devices (range 72.8%-86.4%) were below the statewide rate (82.9% and 87.9%, respectively). Finally, we found that childhood poverty rates (range 16.3%-36.9%) were above the statewide rate (18.5%). Furthermore, risk ratios suggested negative health outcomes for residents of counties within the UFHPCA for each measure, except for infant mortality and maternal deaths, which lacked sample sizes to adequately test.
Conclusions: The health burden of the UFHPCA is characterized by rural counties with increased maternal death, neonatal death, and preterm birth, as well as adverse health behaviors that included increased smoking during pregnancy and lower levels of breastfeeding relative to nonrural counties. Understanding perinatal health outcomes across a single health system has potential to not only estimate community needs but also facilitate planning of health care initiatives and interventions in rural and low-resource communities.
Keywords: County Health Rankings; FLHealthCHARTS.gov; breastfeeding; catchment area; electronic health records; maternal smoking; north central Florida.
© Dominick J. Lemas et al., 2022; Published by Mary Ann Liebert, Inc.
Conflict of interest statement
No competing financial interests exist.
Figures

Similar articles
-
Differences in Perinatal Outcomes among Rural Women by County Composition.Am J Perinatol. 2024 May;41(S 01):e249-e258. doi: 10.1055/a-1878-0204. Epub 2022 Jun 16. Am J Perinatol. 2024. PMID: 35709731
-
Comparison of US County-Level Public Health Performance Rankings With County Cluster and National Rankings: Assessment Based on Prevalence Rates of Smoking and Obesity and Motor Vehicle Crash Death Rates.JAMA Netw Open. 2019 Jan 4;2(1):e186816. doi: 10.1001/jamanetworkopen.2018.6816. JAMA Netw Open. 2019. PMID: 30646196 Free PMC article.
-
Evaluating the Prevalence of Maternal Health Indicators on Infant Mortality Rates in Florida.Cureus. 2024 Jun 30;16(6):e63539. doi: 10.7759/cureus.63539. eCollection 2024 Jun. Cureus. 2024. PMID: 39086786 Free PMC article.
-
Reduction of maternal and perinatal mortality in rural and peri-urban settings: what works?Eur J Obstet Gynecol Reprod Biol. 1996 Oct;69(1):47-53. doi: 10.1016/0301-2115(95)02535-9. Eur J Obstet Gynecol Reprod Biol. 1996. PMID: 8909956 Review.
-
Care prior to and during subsequent pregnancies following stillbirth for improving outcomes.Cochrane Database Syst Rev. 2018 Dec 17;12(12):CD012203. doi: 10.1002/14651858.CD012203.pub2. Cochrane Database Syst Rev. 2018. PMID: 30556599 Free PMC article.
Cited by
-
Fetal outcomes and associated factors of antepartum hemorrhage in Ethiopia: A systematic review and meta-analysis.PLoS One. 2025 Mar 4;20(3):e0319512. doi: 10.1371/journal.pone.0319512. eCollection 2025. PLoS One. 2025. PMID: 40036274 Free PMC article.
-
Social and geographical disparities in adverse birth outcomes in Alaska: a retrospective cohort study.BMJ Public Health. 2025 Feb 12;3(1):e001457. doi: 10.1136/bmjph-2024-001457. eCollection 2025. BMJ Public Health. 2025. PMID: 40017923 Free PMC article.
-
Contemporary mortality of neonatal germinal matrix hemorrhage and incidence of hydrocephalus requiring cerebrospinal fluid diversion in a substantially rural patient population.Childs Nerv Syst. 2024 Dec 2;41(1):25. doi: 10.1007/s00381-024-06695-z. Childs Nerv Syst. 2024. PMID: 39621129
-
Tobacco retailer density and its association with birth outcomes in the USA: 2000-2016.Tob Control. 2024 Aug 21:tc-2024-058779. doi: 10.1136/tc-2024-058779. Online ahead of print. Tob Control. 2024. PMID: 39168593
-
Exploration of the Intersection between Infant Feeding and Postpartum Contraception in Western North Carolina: Perspectives of Postpartum Individuals and Providers.South Med J. 2025 Mar;118(3):189-195. doi: 10.14423/SMJ.0000000000001798. South Med J. 2025. PMID: 40031770 Free PMC article.
References
-
- International Comparison | 2019 Annual Report. America's Health Rankings. Available from: https://www.americashealthrankings.org/learn/reports/2019-annual-report/... [Last accessed: August 19, 2021].
-
- Racial/Ethnic Disparities in Pregnancy-Related Deaths—United States, 2007–2016 | MMWR. Available from: https://www.cdc.gov/mmwr/volumes/68/wr/mm6835a3.htm [Last accessed: August 19, 2021]. - PubMed
-
- World Health Organization. Trends in Maternal Mortality 2000 to 2017: Estimates by WHO, UNICEF, UNFPA, World Bank Group and the United Nations Population Division. World Health Organization; 2019. Available from: https://apps.who.int/iris/handle/10665/327595 [Last accessed: August 23, 2021].
Grants and funding
LinkOut - more resources
Full Text Sources
Miscellaneous