. 2023 Mar 21:32:189-202.
doi: 10.1016/j.omtn.2023.03.007. eCollection 2023 Jun 13.

Identification of shared characteristics in tumor-infiltrating T cells across 15 cancers

Affiliations

Identification of shared characteristics in tumor-infiltrating T cells across 15 cancers

Xiyun Jin et al. Mol Ther Nucleic Acids. .

Abstract

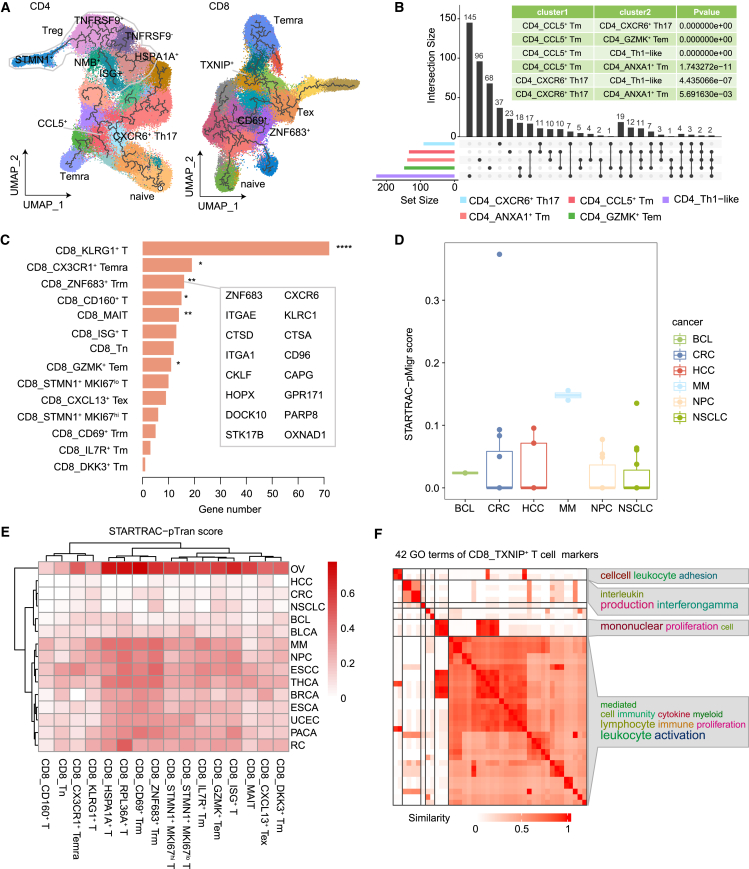
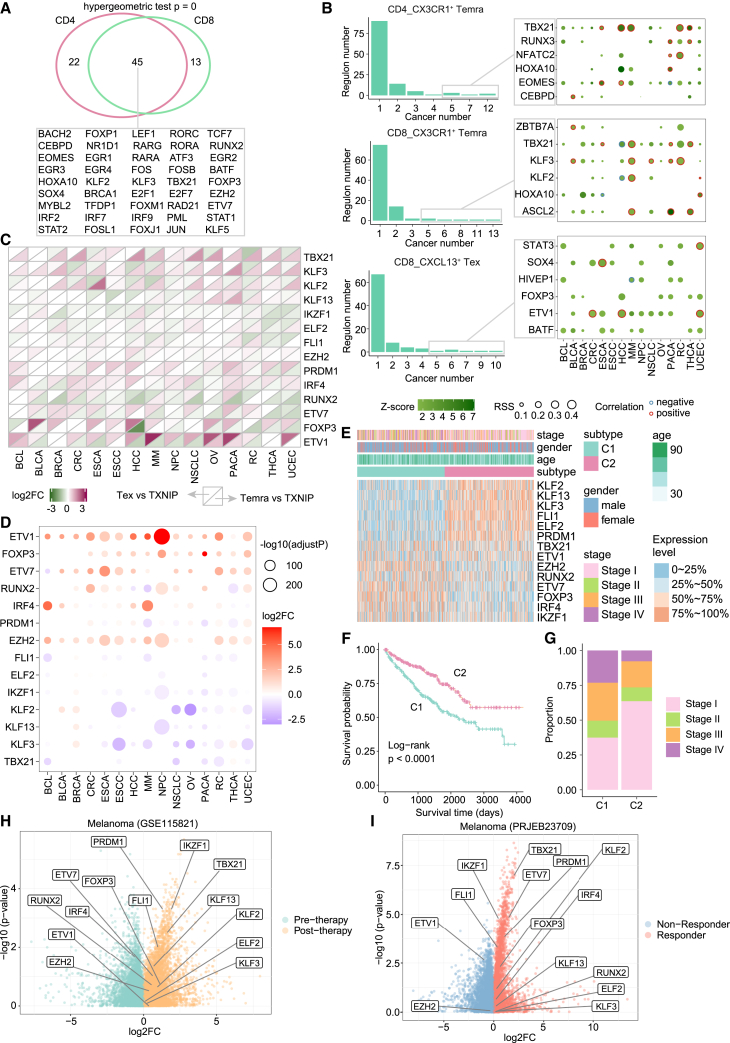
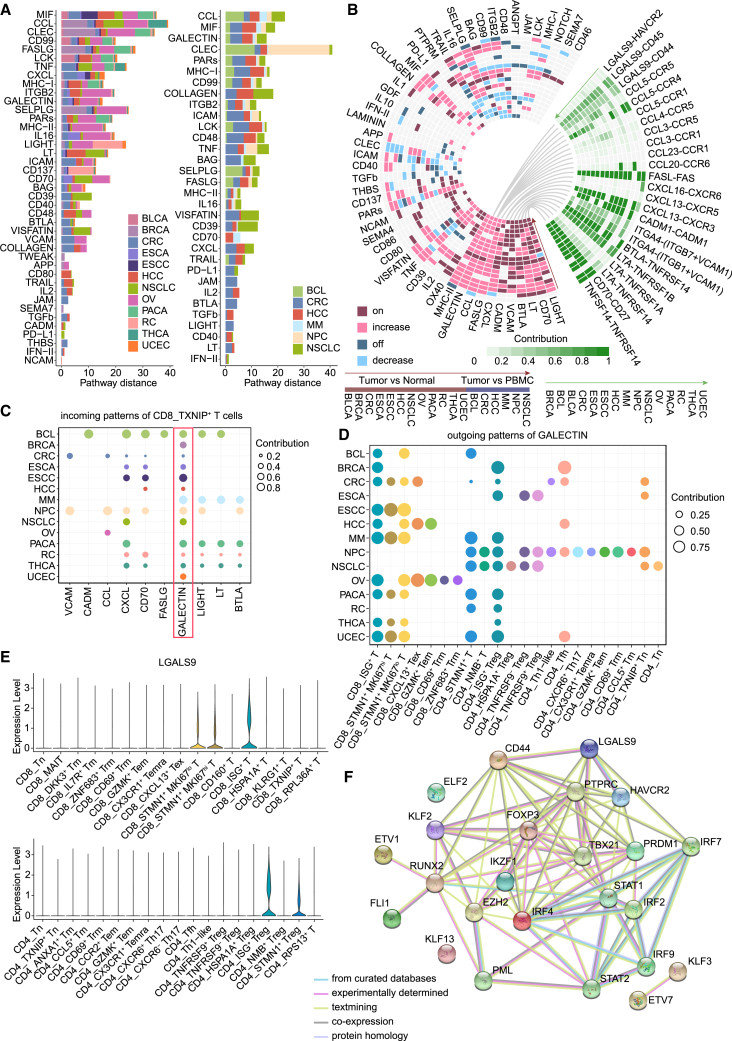
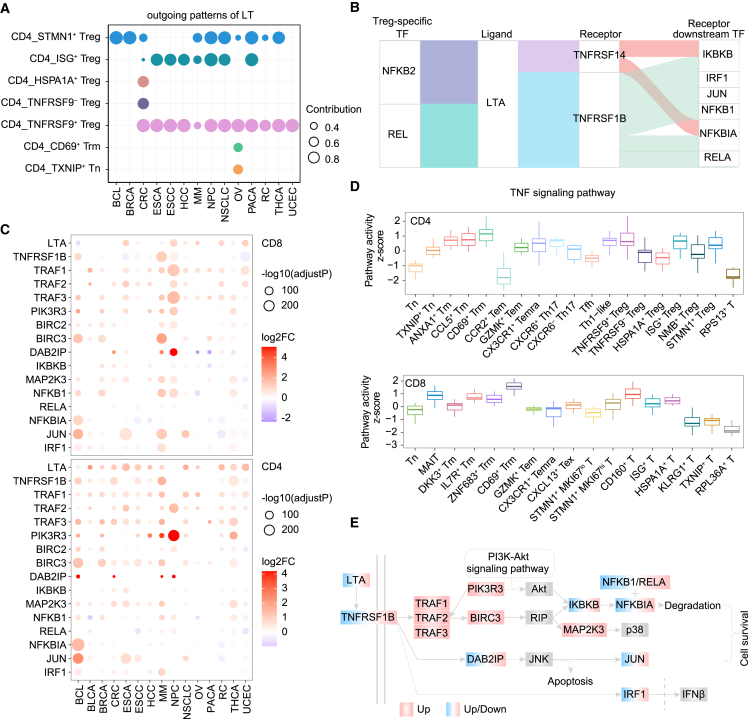
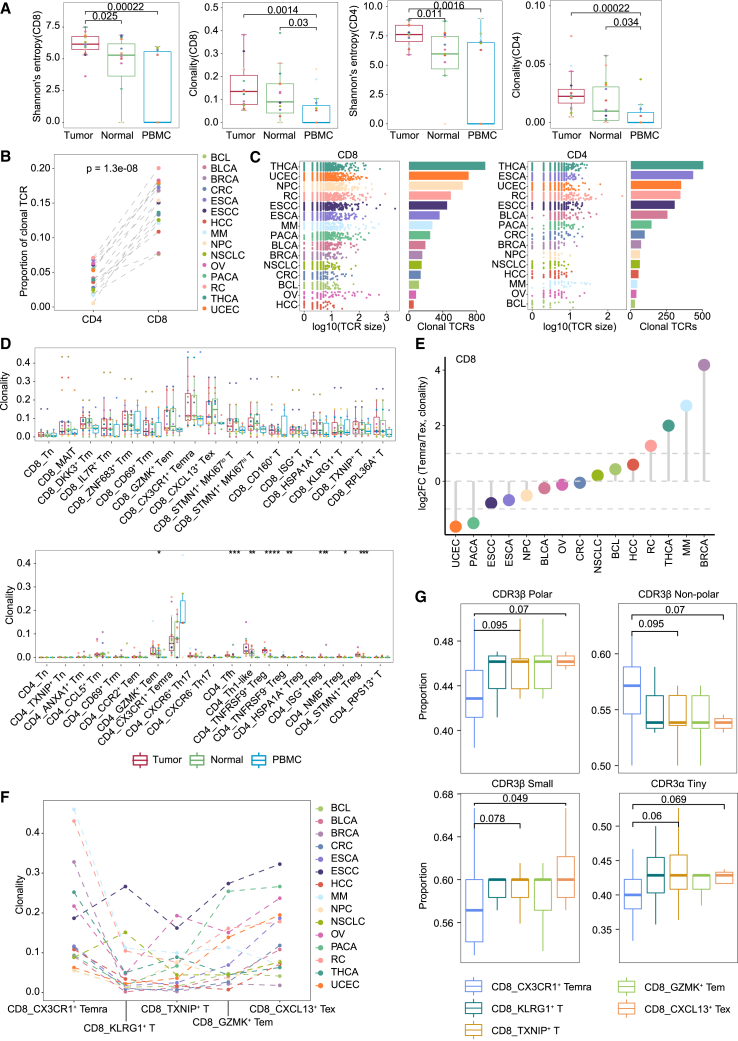
Tumor-infiltrating T cells are essential players in tumor immunotherapy. Great progress has been achieved in the investigation of T cell heterogeneity. However, little is well known about the shared characteristics of tumor-infiltrating T cells across cancers. In this study, we conduct a pan-cancer analysis of 349,799 T cells across 15 cancers. The results show that the same T cell types had similar expression patterns regulated by specific transcription factor (TF) regulons across cancers. Multiple T cell type transition paths were consistent in cancers. We found that TF regulons associated with CD8+ T cells transitioned to terminally differentiated effector memory (Temra) or exhausted (Tex) states were associated with patient clinical classification. We also observed universal activated cell-cell interaction pathways of tumor-infiltrating T cells in all cancers, some of which specifically mediated crosstalk in certain cell types. Moreover, consistent characteristics of TCRs in the aspect of variable and joining region genes were found across cancers. Overall, our study reveals common features of tumor-infiltrating T cells in different cancers and suggests future avenues for rational, targeted immunotherapies.

Keywords: MT: Bioinformatics; T cell receptor; TF regulon; cell-cell communication; pan-cancer; single-cell sequencing; state transition; tumor-infiltrating T cells.


Conflict of interest statement

The authors declare no competing interests.

Figures

None
Graphical abstract
Figure 1
Figure 1
T cell clusters across cancers (A) The data overview of 15 cancers. (B) UMAP visualization of CD8+ and CD4+ T cell clusters. (C) The R(O/E) values of each cluster in tumor, normal, and PBMCs. The chi-square test was used to calculate the R(O/E) value. R(O/E) > 1 (above the dashed line) indicates enrichment. (D) Cell cycle score of T cell clusters.
Figure 2
Figure 2
CD8_TXNIP+ T cells migrated from PBMCs to tumor tissue and developed into Temra or Tex cells (A) UMAP showing the development trajectories of T cell clusters in all cancers inferred by Monocle3. (B) The overlapped marker genes of CD4_CXCR6+ Th17, CD4_CCL5+ Tm, CD4_Th1-like, CD4_ANXA1+ Tm, and CD4_GZMK+ Tem. Significance p value was calculated by hypergeometric test. (C) Shared marker genes between CD8_TXNIP+ T cells and other T cells. Significance was calculated by hypergeometric test. ∗p < 0.05, ∗∗p < 0.01, ∗∗∗∗p < 0.0001. (D) Migration potentials from PBMCs to tumor of CD8_TXNIP+ T cells quantified by STARTRAC-pMigr. (E) Developmental transition of CD8_TXNIP+ T cells with other T cells quantified by STARTRAC-pTran. (F) The similarity of GO terms enriched by CD8_TXNIP+ T cell marker genes and annotated with word clouds.
Figure 3
Figure 3
Shared state-transition TF regulons across cancers (A) Venn diagrams showing the overlap cluster-specific regulons of CD4 and CD8. (B) The statistics of cluster-specific regulons (left) and the cluster-specific regulons in at least five cancers (right). The colors around the dot represent the relationship between RSS and TCR clonality. (C) The differential regulons between CD8_TXNIP+ T, CD8_CX3CR1+ Temra, and CD8_CXCL13+ Tex. (D) Differential expression of regulons (C) in tumor compared with normal or PBMCs. (E) The expression level of regulons (C) in KIRC subtypes. (F) The Kaplan-Meier plot of KIRC patient-based classifications generated from consensus clustering. The survival difference among groups was calculated by log rank test. (G) Pathologic stage distribution of KIRC patients in each subtype. (H) The volcano plot of differentially expressed genes between pre-therapy and post-therapy patients in melanoma (GSE115821). Differential expression analysis was performed using wilcox.test. (I) The volcano plot of differentially expressed genes between responder and non-responder patients in melanoma (PRJEB23709). Differential expression analysis was performed using wilcox.test.
Figure 4
Figure 4
Universal activated T cell interaction pathways in 15 cancers (A) The Euclidean distances of overlapping signaling pathways between different tissues in the shared two-dimensional manifold. Tumor vs. normal (left), tumor vs. PBMCs (right). (B) Circos plot of signaling pathways that significantly differ in overall information flow between different tissues (left) and the relative contribution of ligand-receptor (right). (C) The incoming signaling patterns of CD8_TXNIP+ T cells in all cancers. (D) The outgoing signaling patterns of the GALECTIN pathway. (E) The expression of LGALS9 in each T cell cluster. (F) PPI network of ligand and receptor in the GALECTIN pathway; TFs in ISG+ T cells and differential regulons between CD8_TXNIP+ T, CD8_Temra, and CD8_Tex.
Figure 5
Figure 5
Tregs activated the TNF pathway in other cells through the LT pathway (A) The outgoing signaling patterns of the LT pathway. (B) The Sankey plot of ligand-receptor in the LT pathway and TFs upstream of the ligand and downstream of the receptor. (C) Differentially expressed TNF signaling pathway-related genes in tumor compared with normal or PBMCs. (D) The TNF signaling pathway activity in each CD4 (top) and CD8 (bottom) clusters. (E) Schematic illustration of the LTA-TNFRSF1B interaction activating the TNF signaling pathway. The gene expression changes are consistent with (C).
Figure 6
Figure 6
The consistent features of V and J segments and CDR3s across cancers (A) The TCR diversity and clonality of CD4+ and CD8+ T cells. The significant p values were calculated by Wilcoxon rank-sum test. (B) Comparison of clonal TCRs between CD4+ and CD8+ T cells. The significant p values were calculated by Wilcoxon rank-sum test. (C) The statistics of clonal TCRs in CD8+ T cells and CD4+ T cells. (D) The TCR clonality of each cluster in tumor, normal, and PBMCs. The significant p values were calculated by Wilcoxon rank-sum test. ∗p < 0.05, ∗∗p < 0.01, ∗∗∗p < 0.001,∗∗∗∗p < 0.0001. (E) The fold change of clonality between CD8_CX3CR1+ Temra and CD8_CXCL13+ Tex in each cancer. (F) The line plot represents the trend of TCR clonality between T cell clusters on CD8_TXNIP+ T cell development trajectories. (G) The proportion of amino acid types in CDR3s between T cell clusters on CD8_TXNIP+ T cell development trajectories. The significant p values were calculated by Wilcoxon rank-sum test.

References

    1. Hinshaw D.C., Shevde L.A. The tumor microenvironment innately modulates cancer progression. Cancer Res. 2019;79:4557–4566. - PMC - PubMed
    1. Lin B., Du L., Li H., Zhu X., Cui L., Li X. Tumor-infiltrating lymphocytes: warriors fight against tumors powerfully. Biomedicine & pharmacotherapy = Biomedecine & pharmacotherapie. 2020;132 - PubMed
    1. Thommen D.S., Schumacher T.N. Cell dysfunction in cancer. Cancer Cell. 2018;33:547–562. - PMC - PubMed
    1. Ren X., Zhang L., Zhang Y., Li Z., Siemers N., Zhang Z. Insights gained from single-cell analysis of immune cells in the tumor microenvironment. Annu. Rev. Immunol. 2021;39:583–609. - PubMed
    1. Azizi E., Carr A.J., Plitas G., Cornish A.E., Konopacki C., Prabhakaran S., Nainys J., Wu K., Kiseliovas V., Setty M., et al. Single-cell map of diverse immune phenotypes in the breast tumor microenvironment. Cell. 2018;174:1293–1308.e36. - PMC - PubMed