

New estimates of the storage permanence and ocean co-benefits of enhanced rock weathering
- PMID: 37096198
- PMCID: PMC10122414
- DOI: 10.1093/pnasnexus/pgad059
New estimates of the storage permanence and ocean co-benefits of enhanced rock weathering
Abstract
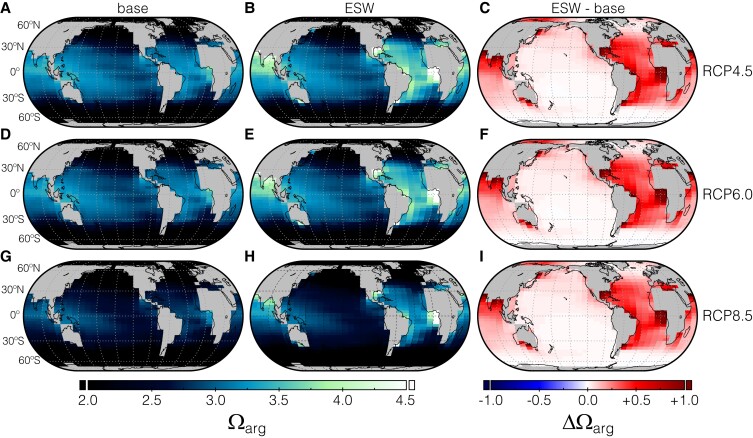
Avoiding many of the most severe consequences of anthropogenic climate change in the coming century will very likely require the development of "negative emissions technologies"-practices that lead to net carbon dioxide removal (CDR) from Earth's atmosphere. However, feedbacks within the carbon cycle place intrinsic limits on the long-term impact of CDR on atmospheric CO2 that are likely to vary across CDR technologies in ways that are poorly constrained. Here, we use an ensemble of Earth system models to provide new insights into the efficiency of CDR through enhanced rock weathering (ERW) by explicitly quantifying long-term storage of carbon in the ocean during ERW relative to an equivalent modulated emissions scenario. We find that although the backflux of CO2 to the atmosphere in the face of CDR is in all cases significant and time-varying, even for direct removal and underground storage, the leakage of initially captured carbon associated with ERW is well below that currently assumed. In addition, net alkalinity addition to the surface ocean from ERW leads to significant increases in seawater carbonate mineral saturation state relative to an equivalent emissions trajectory, a co-benefit for calcifying marine organisms. These results suggest that potential carbon leakage from the oceans during ERW is a small component of the overall ERW life cycle and that it can be rigorously quantified and incorporated into technoeconomic assessments of ERW at scale.
Keywords: carbon cycle; climate change; negative emissions technology.
© The Author(s) 2023. Published by Oxford University Press on behalf of National Academy of Sciences.
Figures


References
-
- Rogelj J, et al. . 2018. Scenarios toward limiting global mean temperature increase below 1.5 °C. Nat Climate Change. 8:325–332.
-
- IPCC . 2018. Masson-Delmonte V, et al. editors. Global warming of 1.5 °C. An IPCC special report on the impacts of global warming of 1.5 °C above pre-industrial levels and related global greenhouse gas emission pathways, in the context of strengthening the global response to the threat of climate change, sustainable development, and efforts to eradicate poverty.
-
- National Academies of Sciences, Engineering and Medicine . 2019. Negative emissions technologies and reliable sequestration: a research agenda. Washington (DC): National Academies of Sciences, Engineering and Medicine.
-
- T. o. S. V. C. Markets . 2021. TSVCM final report. p. 148.
-
- Cox E, Edwards NR. 2019. Beyond carbon pricing: policy levers for negative emissions technologies. Climate Policy. 19:1144–1156.
LinkOut - more resources
Full Text Sources
