

Simultaneous Widefield Voltage and Dye-Free Optical Mapping Quantifies Electromechanical Waves in Human Induced Pluripotent Stem Cell-Derived Cardiomyocytes
- PMID: 37096210
- PMCID: PMC10119986
- DOI: 10.1021/acsphotonics.2c01644
Simultaneous Widefield Voltage and Dye-Free Optical Mapping Quantifies Electromechanical Waves in Human Induced Pluripotent Stem Cell-Derived Cardiomyocytes
Abstract
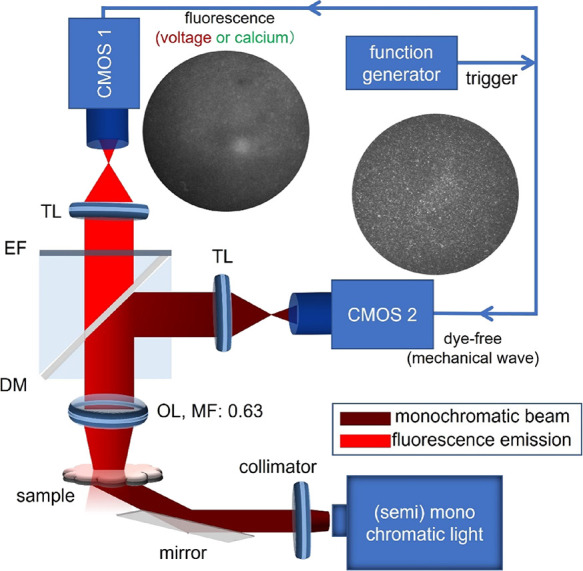
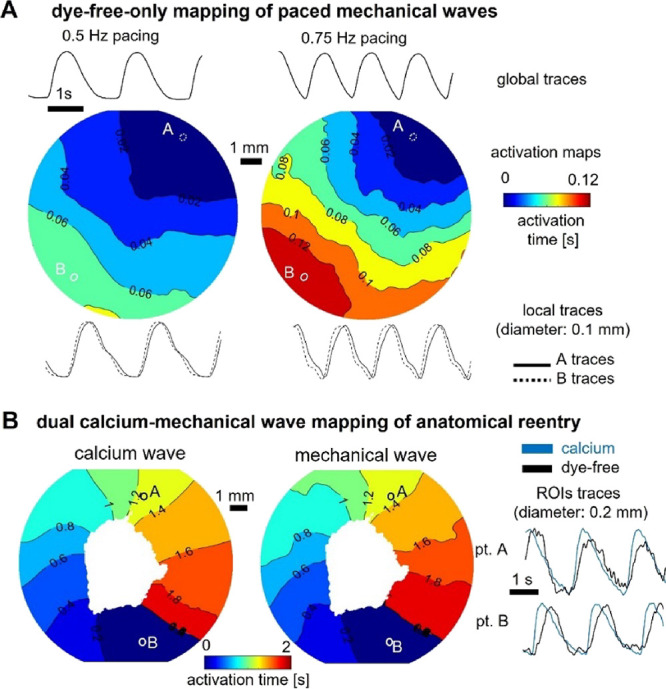
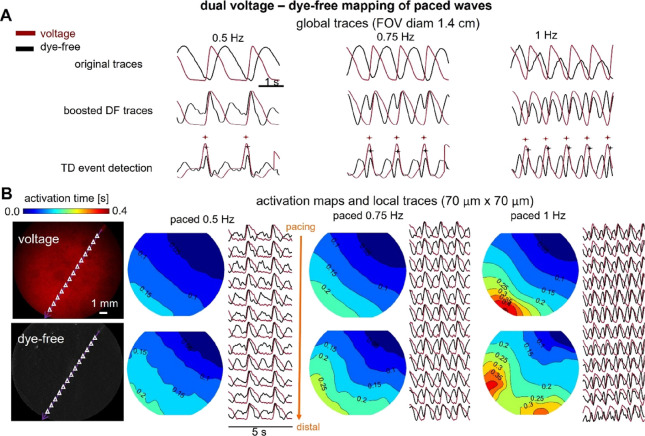
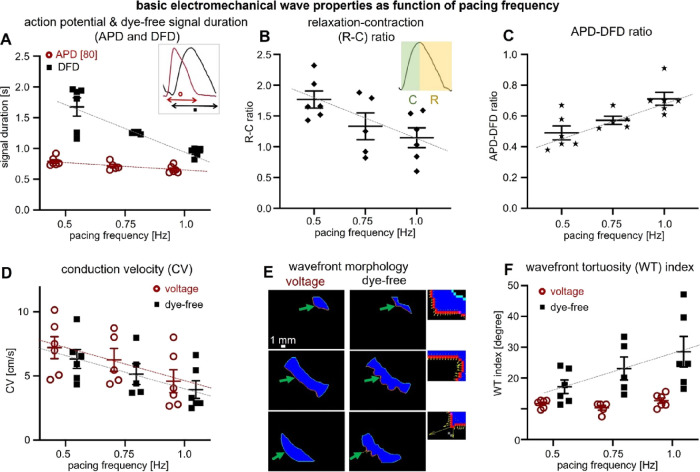
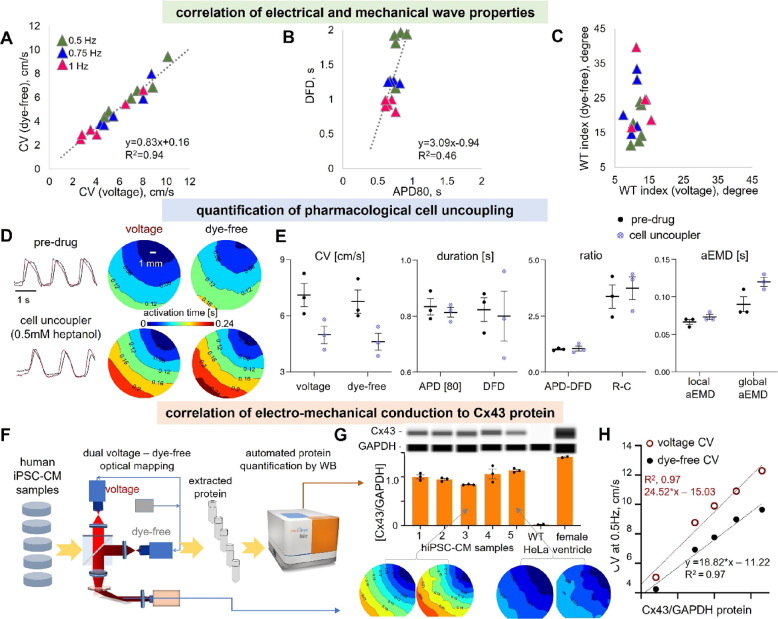
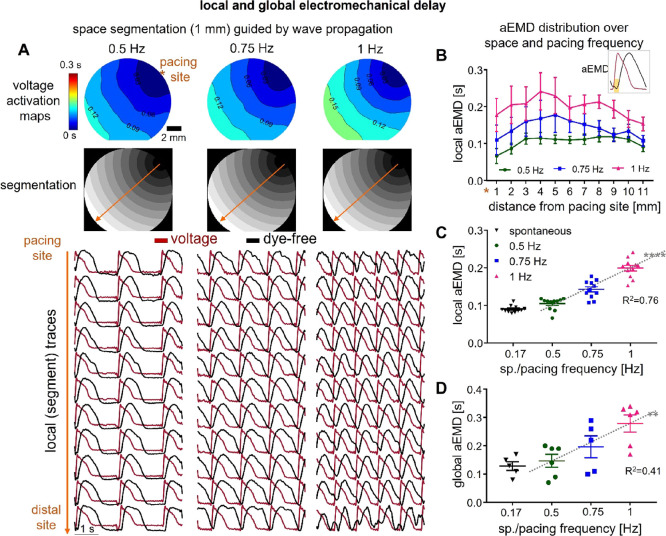
Coupled electromechanical waves define a heart's function in health and diseases. Optical mapping of electrical waves using fluorescent labels offers mechanistic insights into cardiac conduction abnormalities. Dye-free/label-free mapping of mechanical waves presents an attractive non-invasive alternative. In this study, we developed a simultaneous widefield voltage and interferometric dye-free optical imaging methodology that was used as follows: (1) to validate dye-free optical mapping for quantification of cardiac wave properties in human iPSC-cardiomyocytes (CMs); (2) to demonstrate low-cost optical mapping of electromechanical waves in hiPSC-CMs using recent near-infrared (NIR) voltage sensors and orders of magnitude cheaper miniature industrial CMOS cameras; (3) to uncover previously underexplored frequency- and space-varying parameters of cardiac electromechanical waves in hiPSC-CMs. We find similarity in the frequency-dependent responses of electrical (NIR fluorescence-imaged) and mechanical (dye-free-imaged) waves, with the latter being more sensitive to faster rates and showing steeper restitution and earlier appearance of wavefront tortuosity. During regular pacing, the dye-free-imaged conduction velocity and electrical wave velocity are correlated; both modalities are sensitive to pharmacological uncoupling and dependent on gap-junctional protein (connexins) determinants of wave propagation. We uncover the strong frequency dependence of the electromechanical delay (EMD) locally and globally in hiPSC-CMs on a rigid substrate. The presented framework and results offer new means to track the functional responses of hiPSC-CMs inexpensively and non-invasively for counteracting heart disease and aiding cardiotoxicity testing and drug development.
© 2023 The Authors. Published by American Chemical Society.
Conflict of interest statement
The authors declare no competing financial interest.
Figures
Similar articles
-
Portable low-cost macroscopic mapping system for all-optical cardiac electrophysiology.J Biomed Opt. 2023 Jan;28(1):016001. doi: 10.1117/1.JBO.28.1.016001. Epub 2023 Jan 10. J Biomed Opt. 2023. PMID: 36636698 Free PMC article.
-
Speckle-Tracking Strain Analysis for Mapping Spatiotemporal Contractility of Induced Pluripotent Stem Cell (iPSC)-Derived Cardiomyocytes.Curr Protoc. 2023 Sep;3(9):e889. doi: 10.1002/cpz1.889. Curr Protoc. 2023. PMID: 37747346
-
Determining properties of human-induced pluripotent stem cell-derived cardiomyocytes using spatially resolved electromechanical metrics.J Physiol. 2025 Feb 17. doi: 10.1113/JP287275. Online ahead of print. J Physiol. 2025. PMID: 39960634
-
Optical Mapping of Cardiomyocytes in Monolayer Derived from Induced Pluripotent Stem Cells.Cells. 2023 Aug 29;12(17):2168. doi: 10.3390/cells12172168. Cells. 2023. PMID: 37681899 Free PMC article. Review.
-
Calcium and voltage mapping in hiPSC-CM monolayers.Cell Calcium. 2016 Mar;59(2-3):84-90. doi: 10.1016/j.ceca.2016.02.004. Epub 2016 Feb 20. Cell Calcium. 2016. PMID: 26922095 Review.
Cited by
-
High-throughput optical sensing of peri-cellular oxygen in cardiac cells: system characterization, calibration, and testing.Front Bioeng Biotechnol. 2023 Jun 16;11:1214493. doi: 10.3389/fbioe.2023.1214493. eCollection 2023. Front Bioeng Biotechnol. 2023. PMID: 37397961 Free PMC article.
-
OptoDyCE-plate as an affordable high throughput imager for all optical cardiac electrophysiology.J Mol Cell Cardiol Plus. 2023 Dec;6:100054. doi: 10.1016/j.jmccpl.2023.100054. Epub 2023 Nov 9. J Mol Cell Cardiol Plus. 2023. PMID: 38130942 Free PMC article.
-
Control of cardiac waves in human iPSC-CM syncytia by a Halbach array and magnetic nanoparticles.Biophys J. 2025 Apr 15;124(8):1273-1284. doi: 10.1016/j.bpj.2025.03.006. Epub 2025 Mar 12. Biophys J. 2025. PMID: 40077966 Free PMC article.
-
Native mechano-regulative matrix properties stabilize alternans dynamics and reduce spiral wave stabilization in cardiac tissue.Front Netw Physiol. 2024 Sep 24;4:1443156. doi: 10.3389/fnetp.2024.1443156. eCollection 2024. Front Netw Physiol. 2024. PMID: 39381499 Free PMC article.
-
OptoDyCE-plate as an affordable high throughput imager for all optical cardiac electrophysiology.bioRxiv [Preprint]. 2023 Aug 31:2023.08.29.555447. doi: 10.1101/2023.08.29.555447. bioRxiv. 2023. Update in: J Mol Cell Cardiol Plus. 2023 Dec;6:100054. doi: 10.1016/j.jmccpl.2023.100054. PMID: 37693544 Free PMC article. Updated. Preprint.
References
-
- Aistrup G. L.; Kelly J. E.; Kapur S.; Kowalczyk M.; Sysman-Wolpin I.; Kadish A. H.; Wasserstrom J. A. Pacing-induced heterogeneities in intracellular Ca2+ signaling, cardiac alternans, and ventricular arrhythmias in intact rat heart. Circ. Res. 2006, 99, e65–e73. 10.1161/01.RES.0000244087.36230.bf. - DOI - PubMed
-
- Pfeiffer-Kaushik E. R.; Smith G. L.; Cai B.; Dempsey G. T.; Hortigon-Vinagre M. P.; Zamora V.; Feng S.; Ingermanson R.; Zhu R.; Hariharan V.; Nguyen C.; Pierson J.; Gintant G. A.; Tung L. Electrophysiological characterization of drug response in hSC-derived cardiomyocytes using voltage-sensitive optical platforms. J. Pharmacol. Toxicol. Methods 2019, 99, 10661210.1016/j.vascn.2019.106612. - DOI - PubMed
-
- Nitsan I.; Drori S.; Lewis Y. E.; Cohen S.; Tzlil S. Mechanical communication in cardiac cell synchronized beating. Nat. Phys. 2016, 12, 472–477. 10.1038/nphys3619. - DOI
Grants and funding
LinkOut - more resources
Full Text Sources
Miscellaneous