. 2023;43(4):143-156.
doi: 10.1080/10985549.2023.2196204. Epub 2023 Apr 25.

DNA Damage-Induced, S-Phase Specific Phosphorylation of Orc6 is Critical for the Maintenance of Genome Stability

Affiliations

DNA Damage-Induced, S-Phase Specific Phosphorylation of Orc6 is Critical for the Maintenance of Genome Stability

Yo-Chuen Lin et al. Mol Cell Biol. 2023.

Abstract

The smallest subunit of the human Origin Recognition Complex, hOrc6, is required for DNA replication progression and plays an important role in mismatch repair (MMR) during S-phase. However, the molecular details of how hOrc6 regulates DNA replication and DNA damage response remain to be elucidated. Orc6 levels are elevated upon specific types of genotoxic stress, and it is phosphorylated at Thr229, predominantly during S-phase, in response to oxidative stress. Many repair pathways, including MMR, mediate oxidative DNA damage repair. Defects in MMR are linked to Lynch syndrome, predisposing patients to many cancers, including colorectal cancer. Orc6 levels are known to be elevated in colorectal cancers. Interestingly, tumor cells show reduced hOrc6-Thr229 phosphorylation compared to adjacent normal mucosa. Further, elevated expression of wild-type and the phospho-dead forms of Orc6 results in increased tumorigenicity, implying that in the absence of this "checkpoint" signal, cells proliferate unabated. Based on these results, we propose that DNA-damage-induced hOrc6-pThr229 phosphorylation during S-phase facilitates ATR signaling in the S-phase, halts fork progression, and enables assembly of repair factors to mediate efficient repair to prevent tumorigenesis. Our study provides novel insights into how hOrc6 regulates genome stability.

Keywords: DNA damage; Orc6; phosphorylation; replication.


Figures

FIG 1
FIG 1
Orc6 is phosphorylated at threonine 229 (T229) upon oxidative damage during S-phase. (A) Phos-tag gel analysis of Orc6 phosphorylation. U2OS cells were transfected with Flag-Orc6-WT, T195A, T229A or M2 (both T195 and T229 were mutated to Ala) and treated with okadaic acid (OA) to induce accumulation of phosphorylation. Asterisk (*) indicates Orc6 phosphorylated on both T195 and T229; *1 indicates T229 phosphorylation. *2 indicates T195 phosphorylation. CIP, calf intestinal phosphatase. (B) Western blot for testing Orc6 T229 phosphorylation upon different genotoxic drug treatments. Arrowhead indicates nonspecific bands. (C) Western blot for testing Orc6 T229 phosphorylation upon different doses of gamma irradiation. (D) Western blot showing Orc6 T229 phosphorylation pattern during cell cycle. (E) Phos-tag gel analysis to determine the dose-dependent effects of T229 phosphorylation upon H2O2 treatment. U2OS cells were transfected with Flag-Orc6-WT and treated with different concentration of H2O2 (0.25, 0.5, 1, 2, 5 mM). NC: negative control. (F) Western blot for endogenous Orc6 T229 phosphorylation. (G) Western blot of T229 phosphorylation regulation after removal of 5 mM H2O2. Cells were collected at indicated time point after release from 20 min H2O2 treatment. NC: negative control.
FIG 2
FIG 2
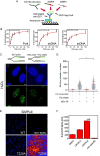
Orc6-pT229 binds to the replication fork. (A) Schematic illustration of SiMPull to test Orc6’s DNA binding ability to different DNA substrates. (B) Binding curves showing Orc6 binding affinity to different DNA substrates. (C) Representative images of SIRF assay. Schematic of the experiment is provided. Scale bar, 5 μm. (D) Quantification of PLA foci number. EdU-positive and negative cells were processed and plotted separately. The quantification is based on two biological repeats of SIRF. Mean ± SD. *P < 0.05, ****P < 0.0001 by Mann–Whitney U test. (E and F) SiMPull for investigating the effect of Orc6 T229 phosphorylation to its DNA fork structure binding ability. Representative images of different mutants of purified GST-Flag-Orc6 (E) and quantified results (F). Mean ± SD.
FIG 3
FIG 3
Impact of Orc6-pT229 on ORC binding, cell cycle progression and replication fork dynamics. (A) Immunoprecipitation of different mutants of Flag-Orc6 from U2OS cells. Samples were analyzed by Western blotting. (B) Cell cycle profile of U2OS cells (column 1) and Orc6-KO cells (columns 2–5) in cells expressing wild-type (column 3), phospho-dead (Orc6-T229A; column 4) or phospho-mimetic (Orc6-T229E; column 5) versions of Orc6. These cells were either untreated (NT), H2O2 treated or released from H2O2 treatment. (C) DNA fiber assay to monitor replication fork progression in cells expressing wild-type, phospho-dead or phospho-mimetic mutants of Orc6. Left: representative images. Schematic figure represents the CldU (green) and IdU (red) incorporation duration. Arrow indicates direction of replication. Scale bar, 5 μm. Right: quantification of IdU track length (μm) in unidirectional replication forks. Mean ± SD. In each sample n = 99–188 fibers were quantified. Numbers below represent mean values. *P < 0.05, **P < 0.01, ****P < 0.0001 by unpaired two-tailed Student’s t test, and ns: nonsignificant.
FIG 4
FIG 4
Orc6 phosphorylation at T229 upon oxidative damage is ATR-dependent. (A) ATR activation analyzed by Western blot of various U2OS cell lines (U2OS WT, HA-Orc6-WT, HA-Orc6-T229A, HA-Orc6-T229E) depleted of endogenous Orc6. Arrowhead indicates HA-Orc6. Asterisk (*) indicates hyperphosphorylated RPA32. Relative levels of hyperphosphorylated RPA32 (data normalized to the control si- 1; Orc6 si in U2OS WT- 0.17, in HA-Orc6 WT- 0.40, in HA-Orc6-T229A- 0.19, in HA-Orc6-T229E-0.51) and pChk1-S345 (data normalized to the control si- 1; Orc6 si in U2OS WT- 0.58, in HA-Orc6 WT- 1.03, in HA-Orc6-T229A- 0.63, in HA-Orc6-T229E- 0.79) in Orc6-si cells were quantified by ImageJ. (B) Western blot analysis of Orc6 phosphorylation at T229 upon ATR depletion.
FIG 5
FIG 5
The significance of Orc6 in tumorigenesis. (A) Mutations, amplifications, and deletion of ORC6L in different tumors (cBioPortal). (B) Expression analysis of ORC6L across TCGA tumors (http://ualcan.path.uab.edu/). (C) Survival analysis in patients with higher ORC6 expression levels (http://ualcan.path.uab.edu).
FIG 6
FIG 6
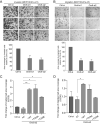
The role of Orc6-pT229 in tumorigenesis. (A) Matrigel invasion assay of Orc6-depleted M4 cells. (B) Transwell migration assay of Orc6-depleted M4 cells. (C and D) Invasion (C) and migration (D) assays of Orc6-depleted U2OS cells, in which endogenous Orc6 was substituted by HA-Orc6-WT/T229A/T229E. Quantification is based on area coverage by migrated or invaded cells stained by crystal violet. Mean ± SEM. n = 2 replicates. *P < 0.05, **P < 0.01 by unpaired two-tailed Student’s t test. Unlisted p-values: (C) P = 0.3590 between Ctrl-si and Orc6-si2-NT; (D) P = 0.6746 between Ctrl-si and Orc6-si2-NT, P = 0.1592 between Orc6-si2-NT and Orc6-si2 + T229A, P = 0.5835 between Orc6-si2-NT and Orc6-si2 + T229E.
FIG 7
FIG 7
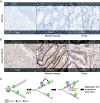
Localization of phosphorylated-Orc6 in cancer cells (A) Immunohistochemistry staining with Orc antibody. Tumor regions have more positively stained epithelial cells (a) slide with both tumor and normal mucosa (b) tumor region (c) normal mucosa). (B) Immunohistochemistry staining with Orc6-pT229 in colon carcinoma. Both tumor and normal regions have a similar number of positively stained cells, but cells in normal epithelium have more intense staining. (a) Low magnification view of tissue (b) high magnification view of normal mucosa (c) low magnification view of tissue (d) high magnification view of neoplastic glands in colon carcinoma. (C) Schematic model of the role of phospho-Orc6 at the fork during DNA damage.

References

    1. Bell SP, Dutta A.. DNA replication in eukaryotic cells. Annu Rev Biochem. 2002;71:333–374. - PubMed
    1. Bell SP, Stillman B.. ATP-dependent recognition of eukaryotic origins of DNA replication by a multiprotein complex. Nature. 1992;357:128–134. - PubMed
    1. Bleichert F, Balasov M, Chesnokov I, Nogales E, Botchan MR, Berger JM.. A Meier-Gorlin syndrome mutation in a conserved C-terminal helix of Orc6 impedes origin recognition complex formation. Elife. 2013;2:e00882. - PMC - PubMed
    1. Li N, Lam WH, Zhai Y, Cheng J, Cheng E, Zhao Y, Gao N, Tye BK.. Structure of the origin recognition complex bound to DNA replication origin. Nature. 2018;559:217–222. doi:10.1038/s41586-018-0293-x. - DOI - PubMed
    1. Miller TCR, Locke J, Greiwe JF, Diffley JFX, Costa A.. Mechanism of head-to-head MCM double-hexamer formation revealed by cryo-EM. Nature. 2019;575:704–710. doi:10.1038/s41586-019-1768-0. - DOI - PMC - PubMed

Publication types

Substances

LinkOut - more resources