

Phenotype Risk Score but Not Genetic Risk Score Aids in Identifying Individuals With Systemic Lupus Erythematosus in the Electronic Health Record
- PMID: 37096581
- PMCID: PMC10501317
- DOI: 10.1002/art.42544
Phenotype Risk Score but Not Genetic Risk Score Aids in Identifying Individuals With Systemic Lupus Erythematosus in the Electronic Health Record
Abstract
Objective: Systemic lupus erythematosus (SLE) poses diagnostic challenges. We undertook this study to evaluate the utility of a phenotype risk score (PheRS) and a genetic risk score (GRS) to identify SLE individuals in a real-world setting.
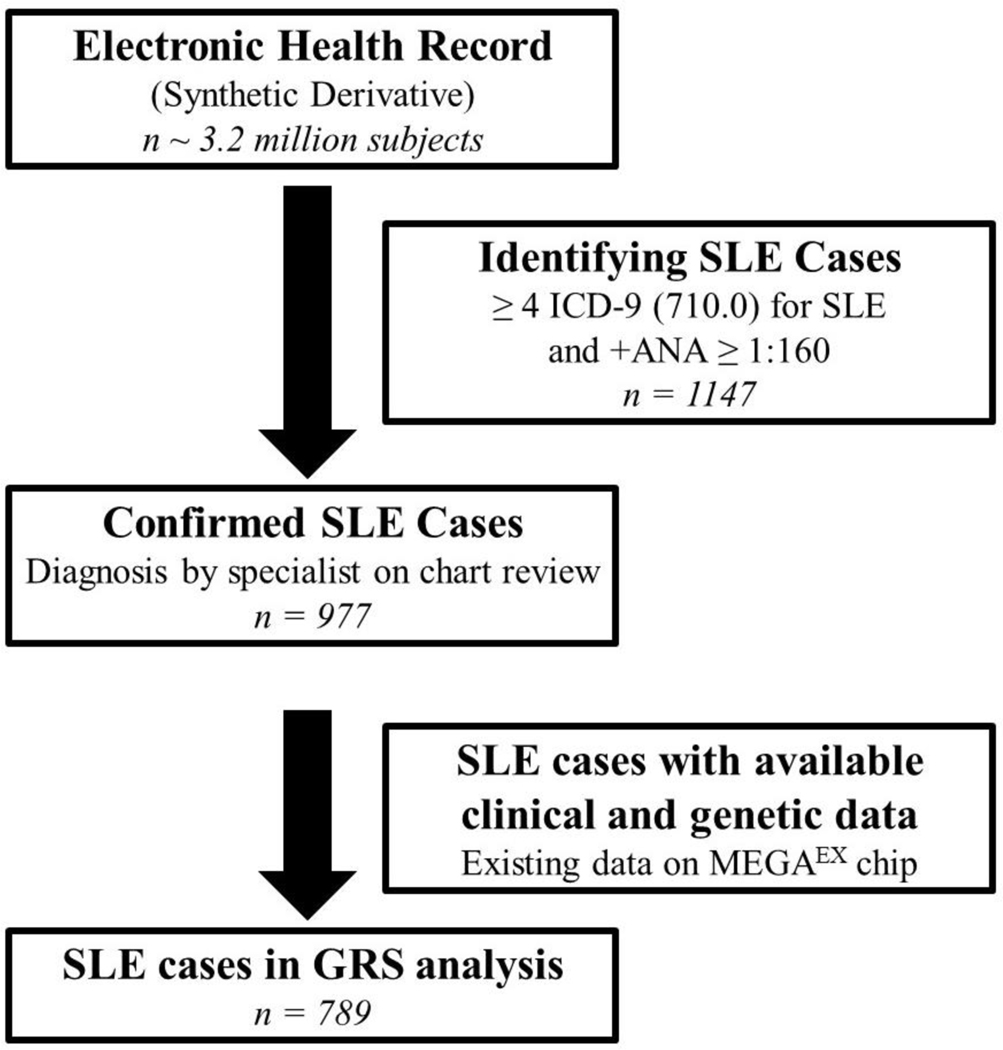
Methods: Using a de-identified electronic health record (EHR) database with an associated DNA biobank, we identified 789 SLE cases and 2,261 controls with available MEGAEX genotyping. A PheRS for SLE was developed using billing codes that captured American College of Rheumatology SLE criteria. We developed a GRS with 58 SLE risk single-nucleotide polymorphisms (SNPs).
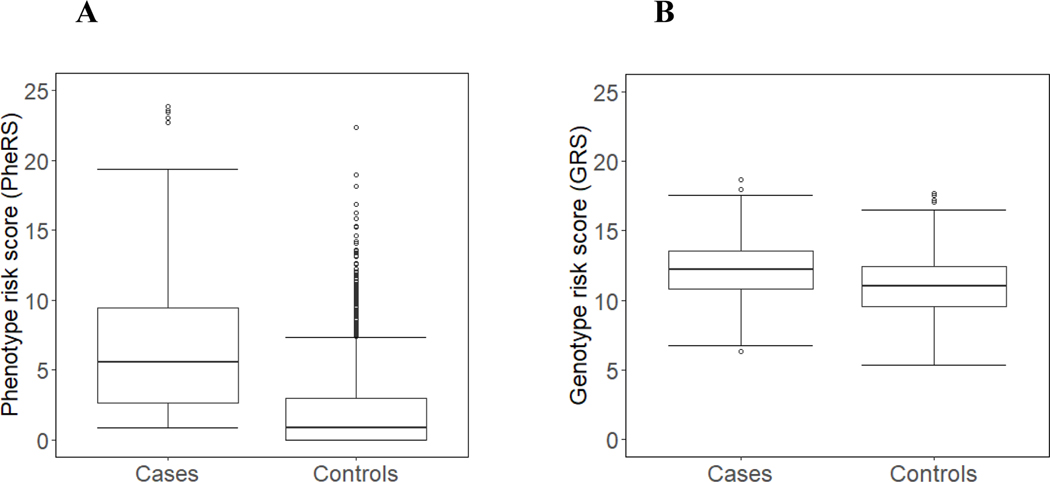
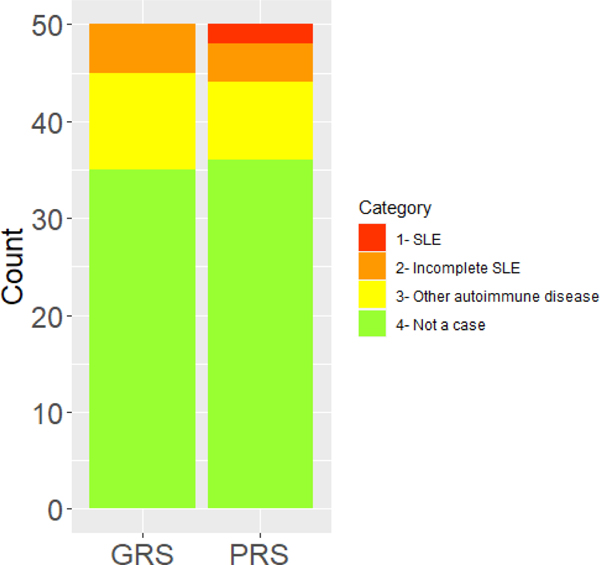
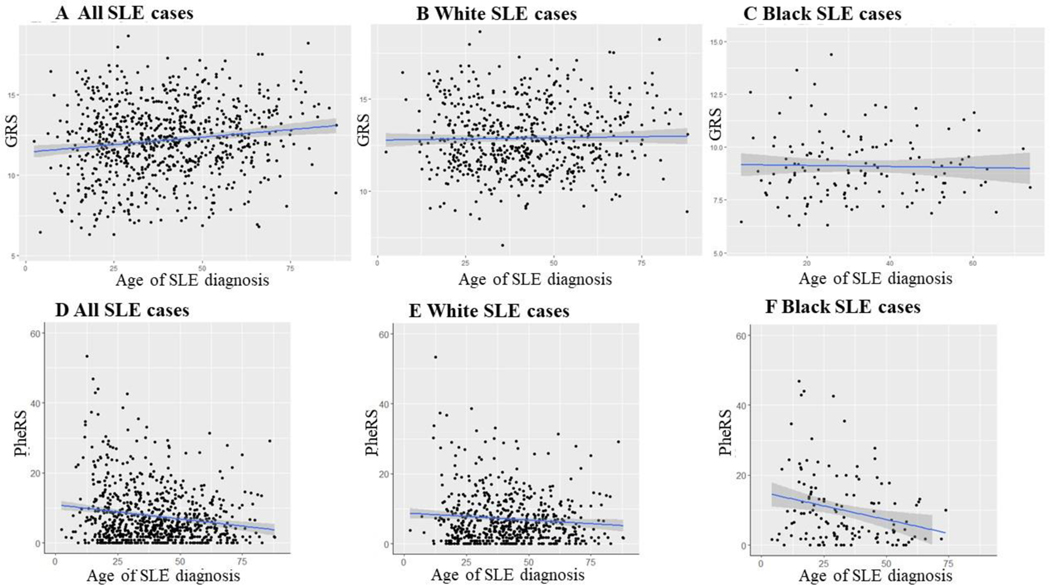
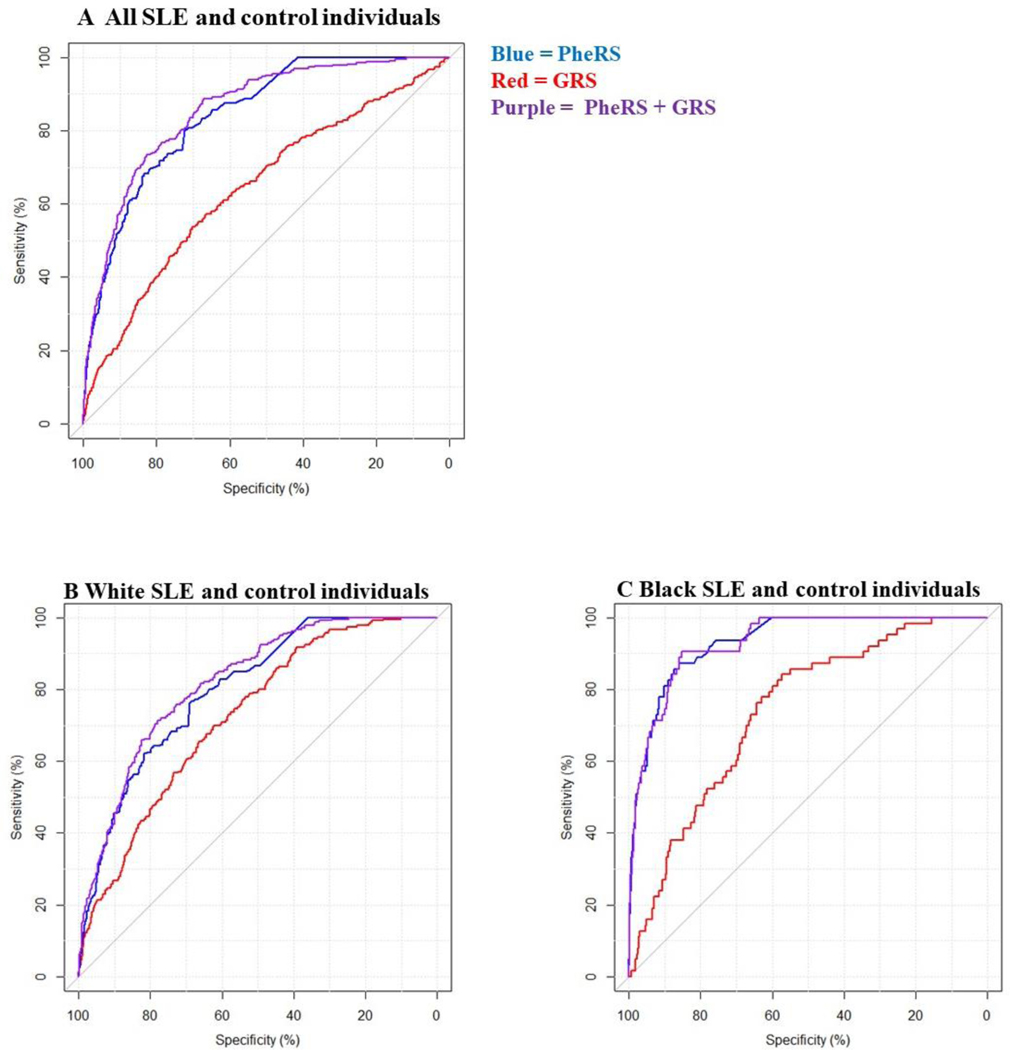
Results: SLE cases had a significantly higher PheRS (mean ± SD 7.7 ± 8.0 versus 0.8 ± 2.0 in controls; P < 0.001) and GRS (mean ± SD 12.2 ± 2.3 versus 11.0 ± 2.0 in controls; P < 0.001). Black individuals with SLE had a higher PheRS compared to White individuals (mean ± SD 10.0 ± 10.1 versus 7.1 ± 7.2, respectively; P = 0.002) but a lower GRS (mean ± SD 9.0 ± 1.4 versus 12.3 ± 1.7, respectively; P < 0.001). Models predicting SLE that used only the PheRS had an area under the curve (AUC) of 0.87. Adding the GRS to the PheRS resulted in a minimal difference with an AUC of 0.89. On chart review, controls with the highest PheRS and GRS had undiagnosed SLE.
Conclusion: We developed a SLE PheRS to identify established and undiagnosed SLE individuals. A SLE GRS using known risk SNPs did not add value beyond the PheRS and was of limited utility in Black individuals with SLE. More work is needed to understand the genetic risks of SLE in diverse populations.
© 2023 American College of Rheumatology.
Conflict of interest statement
Figures
Similar articles
-
Risk alleles for systemic lupus erythematosus in a large case-control collection and associations with clinical subphenotypes.PLoS Genet. 2011 Feb;7(2):e1001311. doi: 10.1371/journal.pgen.1001311. Epub 2011 Feb 17. PLoS Genet. 2011. PMID: 21379322 Free PMC article.
-
Risk prediction models for incident systemic lupus erythematosus among women in the Nurses' health study cohorts using genetics, family history, and lifestyle and environmental factors.Semin Arthritis Rheum. 2023 Feb;58:152143. doi: 10.1016/j.semarthrit.2022.152143. Epub 2022 Nov 25. Semin Arthritis Rheum. 2023. PMID: 36481507 Free PMC article.
-
Phenotype risk scores (PheRS) for pancreatic cancer using time-stamped electronic health record data: Discovery and validation in two large biobanks.J Biomed Inform. 2021 Jan;113:103652. doi: 10.1016/j.jbi.2020.103652. Epub 2020 Dec 3. J Biomed Inform. 2021. PMID: 33279681 Free PMC article.
-
Association of miR-146a polymorphisms with systemic lupus erythematosus: a meta-analysis.Lupus. 2014 Sep;23(10):1023-30. doi: 10.1177/0961203314534512. Epub 2014 May 6. Lupus. 2014. PMID: 24803388 Review.
-
Meta-analysis of associations between XRCC1 gene polymorphisms and susceptibility to systemic lupus erythematosus and rheumatoid arthritis.Int J Rheum Dis. 2018 Jan;21(1):179-185. doi: 10.1111/1756-185X.12966. Epub 2017 Feb 15. Int J Rheum Dis. 2018. PMID: 28198159 Review.
Cited by
-
A data-driven approach to discover and quantify systemic lupus erythematosus etiological heterogeneity from electronic health records.AMIA Annu Symp Proc. 2025 May 22;2024:172-181. eCollection 2024. AMIA Annu Symp Proc. 2025. PMID: 40417520 Free PMC article.
-
Systemic lupus erythematosus genetics: insights into pathogenesis and implications for therapy.Nat Rev Rheumatol. 2024 Oct;20(10):635-648. doi: 10.1038/s41584-024-01152-2. Epub 2024 Sep 4. Nat Rev Rheumatol. 2024. PMID: 39232240 Review.
-
Gene and phenome-based analysis of the shared genetic architecture of eye diseases.Am J Hum Genet. 2025 Feb 6;112(2):318-331. doi: 10.1016/j.ajhg.2025.01.004. Epub 2025 Jan 28. Am J Hum Genet. 2025. PMID: 39879988 Free PMC article.
References
-
- Pramanik B Diagnosis of systemic lupus erythematosus in an unusual presentation: what a primary care physician should know. Curr Rheumatol Rev 2014;10:81–6. - PubMed
-
- Rees F, Doherty M, Lanyon P, Davenport G, Riley RD, Zhang W, et al. Early Clinical Features in Systemic Lupus Erythematosus: Can They Be Used to Achieve Earlier Diagnosis? A Risk Prediction Model. Arthritis Care Res (Hoboken) 2017;69:833–41. - PubMed
Publication types
MeSH terms
Grants and funding
LinkOut - more resources
Full Text Sources
Medical
