. 2023 May 15;136(10):jcs261100.
doi: 10.1242/jcs.261100. Epub 2023 May 25.

GIPC3 couples to MYO6 and PDZ domain proteins, and shapes the hair cell apical region

Affiliations

GIPC3 couples to MYO6 and PDZ domain proteins, and shapes the hair cell apical region

Paroma Chatterjee et al. J Cell Sci. .

Abstract

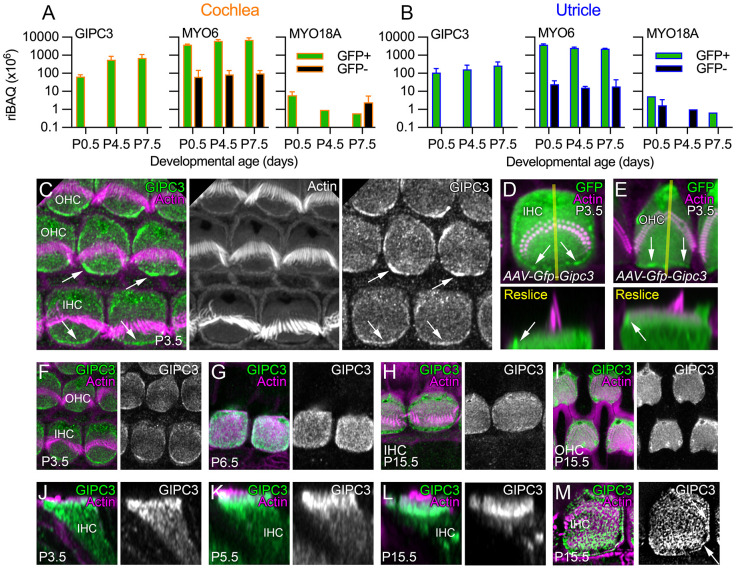
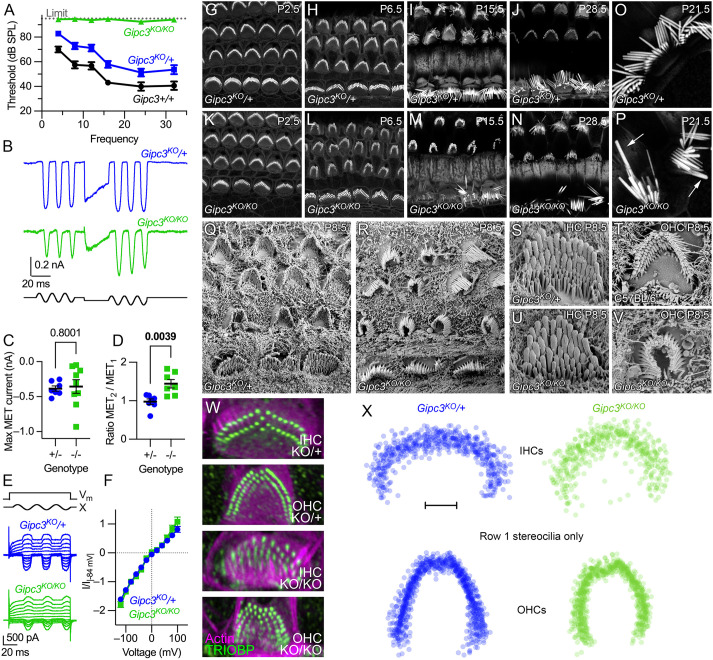
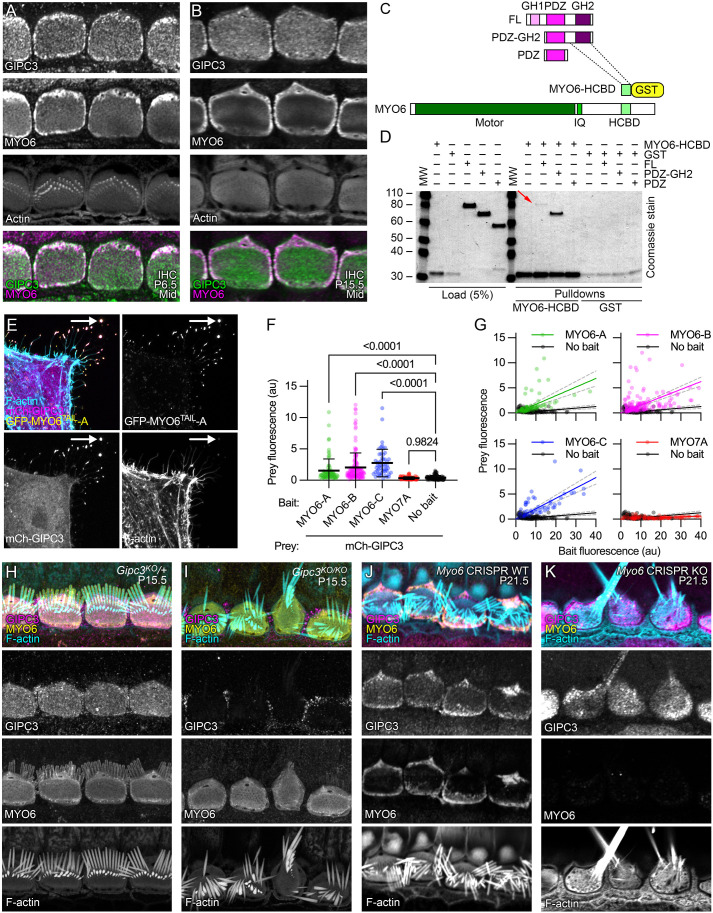
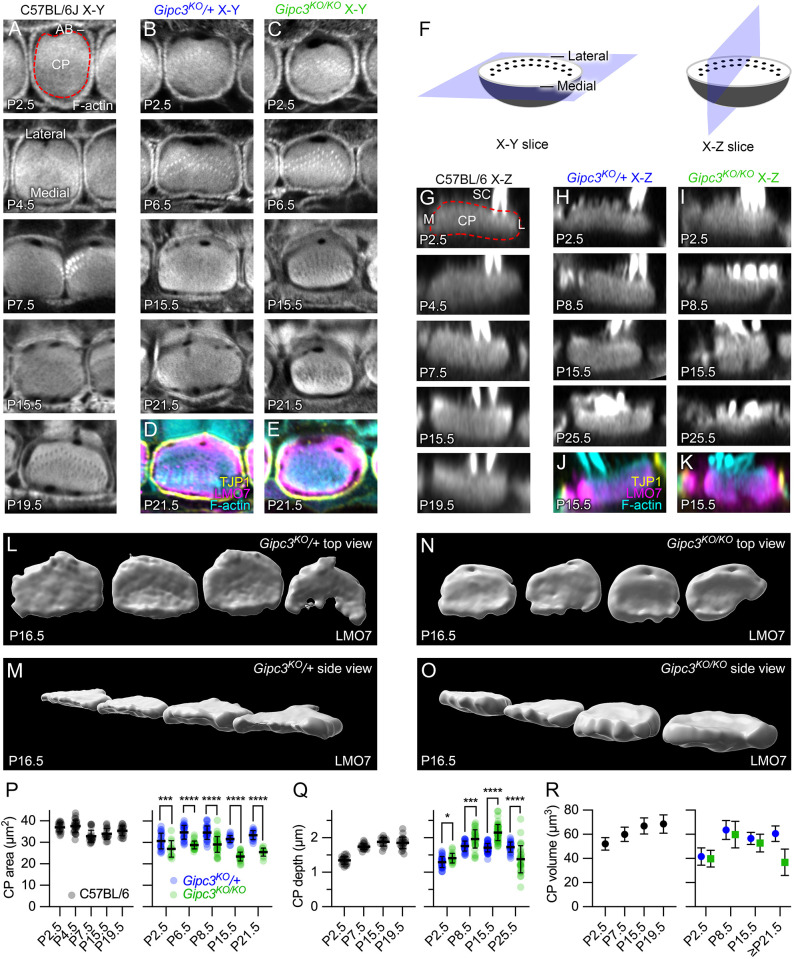
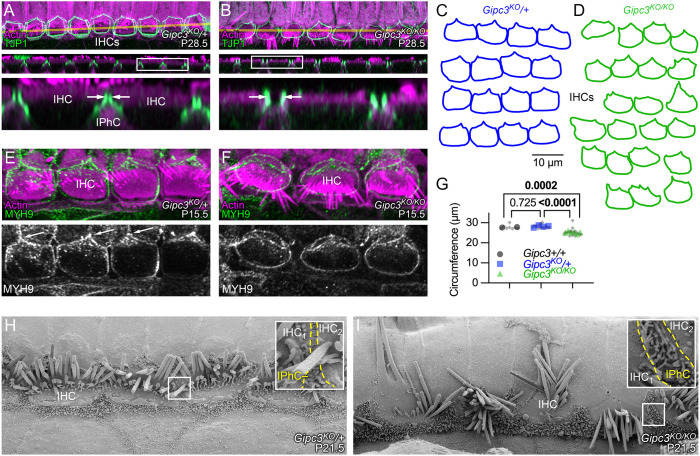
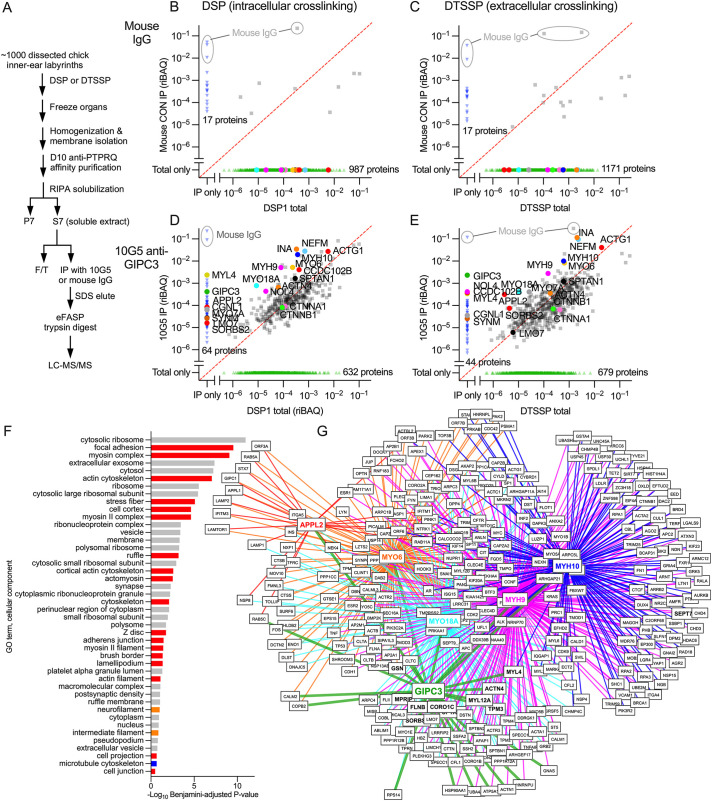
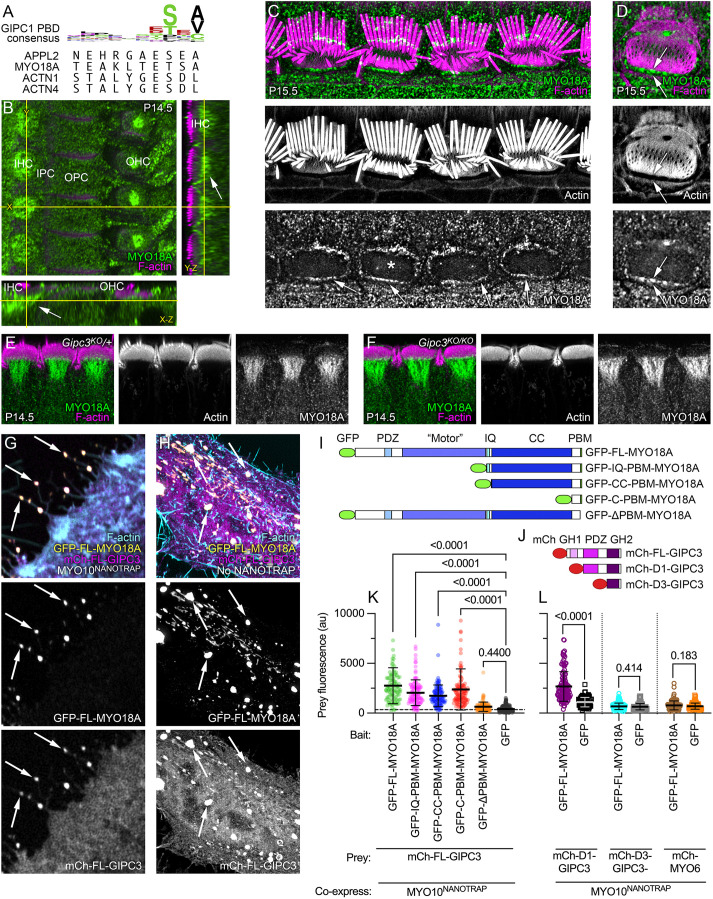
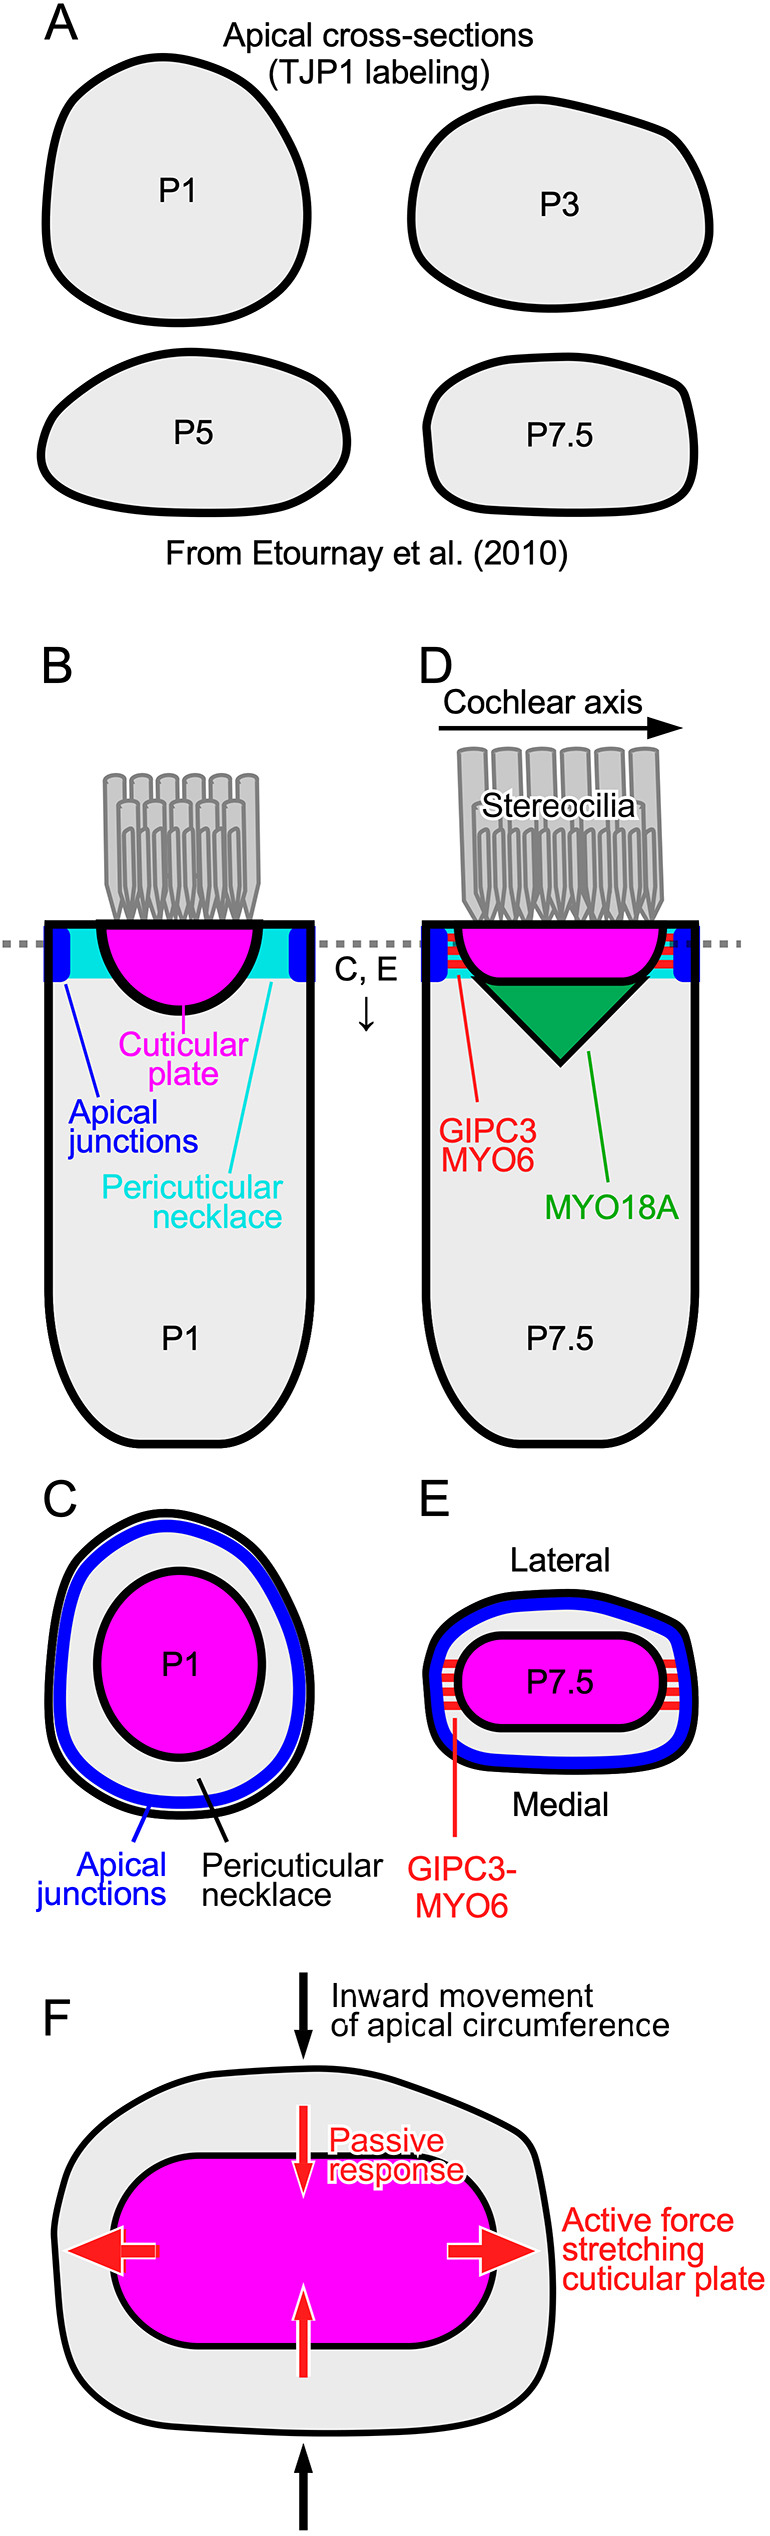
GIPC3 has been implicated in auditory function. Here, we establish that GIPC3 is initially localized to the cytoplasm of inner and outer hair cells of the cochlea and then is increasingly concentrated in cuticular plates and at cell junctions during postnatal development. Early postnatal Gipc3KO/KO mice had mostly normal mechanotransduction currents, but had no auditory brainstem response at 1 month of age. Cuticular plates of Gipc3KO/KO hair cells did not flatten during development as did those of controls; moreover, hair bundles were squeezed along the cochlear axis in mutant hair cells. Junctions between inner hair cells and adjacent inner phalangeal cells were also severely disrupted in Gipc3KO/KO cochleas. GIPC3 bound directly to MYO6, and the loss of MYO6 led to altered distribution of GIPC3. Immunoaffinity purification of GIPC3 from chicken inner ear extracts identified co-precipitating proteins associated with adherens junctions, intermediate filament networks and the cuticular plate. Several of immunoprecipitated proteins contained GIPC family consensus PDZ-binding motifs (PBMs), including MYO18A, which bound directly to the PDZ domain of GIPC3. We propose that GIPC3 and MYO6 couple to PBMs of cytoskeletal and cell junction proteins to shape the cuticular plate.

Keywords: Actin; Cuticular plate; Cytoskeleton; Hair cell; Myosin.


Conflict of interest statement

Competing interests The authors declare no competing or financial interests.

Figures

Fig. 1.
Fig. 1.
GIPC3 in the cochlea and utricle. (A) Mass spectrometry quantification from cochlea using DDA. For A and B, green corresponds to Pou4f3-GFP-positive cells (hair cells), whereas black corresponds to GFP-negative cells; riBAQ measures relative molar abundance, and mean±range are plotted (n=2 each; biological replicates). (B) Mass spectrometry quantification from utricle using DDA. (C) Localization of GIPC3 in P3.5 cochlear hair cells. OHC, outer hair cell. IHC, inner hair cell. Arrows point to concentration of GIPC3 at the periphery of the cuticular plate, at or adjacent to the plasma membrane in the pericuticular necklace region. (D,E) Localization of GFP–GIPC3 introduced into inner (D) and outer (E) hair cells using AAV. Reslice images below are the X-Z images from the transects shown in yellow in the upper panels. Arrows point to concentration of GFP–GIPC3 at the pericuticular necklace region. (F–M) Developmental progression of GIPC3 labeling in IHCs (F–H,J–M) and OHCs (I). M is a lattice SIM image; arrows indicate GIPC3 located at circumferential actin ring of the displayed IHC. AAV experiments were performed twice; immunolocalization experiments were performed more than three times. Panel widths: C, 17.5 µm; D,E, 10 µm; F–I, 15 µm; J–-M, 10 µm. Superresolution modality: C–L, Airyscan; M, lattice SIM.
Fig. 2.
Fig. 2.
Characterization of Gipc3-knockout mice. (A) ABR thresholds for Gipc3 genotypes at 5–6 weeks (mean±s.e.m.). Gipc3KO/KO completely lacked responses, preventing statistical testing. Unpaired two-tailed t-test P-values for Gipc3KO/+ comparison to Gipc3+/+ were: 4 kHz, 0.0045; 8 kHz, 0.0061; 12 kHz, 0.0207; 16 kHz, 0.0103; 24 kHz, 0.1097; 32 kHz, 0.0751. Sample sizes (n; individual ears) were (respectively Gipc3+/+, Gipc3KO/+ and Gipc3KO/KO): 4 kHz, 8 kHz, 16 kHz, 24 kHz, and 32 kHz (8, 28, 18); 12 kHz and 24 kHz (6, 26, 8). (B–F) Mechanoelectrical transduction from P10 IHCs; holding potential of −84 mV. (B) MET in response to sinusoidal displacement bursts, interceded with a positive adapting step. (C) Maximum MET current. Sample sizes were n=7 (Gipc3KO/+) or 9 (Gipc3KO/KO); mean±s.e.m. plotted. Unpaired two-tailed t-tests with P-values as indicated in figure (applies to D as well). (D) Ratio of average responses from second sinusoidal burst divided by responses from first burst (n=7 each). (E) MET currents at different voltages; voltage steps ranged from −120 mV to 100 mV in steps of 20 mV. (F) MET current–voltage relationships. Current at each voltage was divided by the absolute value of the current at −84 mV (mean±s.d.). Sample sizes were n=7 (Gipc3KO/+) or n=4 (Gipc3KO/KO); mean±s.e.m. plotted. (G–N) Bundle morphology visualized by phalloidin staining in cochlear hair cells of Gipc3KO/+ (G–J) and Gipc3KO/KO (K–M) mice during development. (O,P) High magnification view of IHC bundles. Note elongated and thickened Gipc3KO/KO stereocilia in P (arrows), presumably arising from fusion of several stereocilia. (Q,R) SEM of Gipc3KO/+ (Q) and Gipc3KO/KO (R) cochleas. (S–V) Magnified views of IHC (S,U) and OHC (T) bundles. Gipc3KO/KO IHC bundles had increased numbers of rows with thick stereocilia (U); Gipc3KO/KO OHC bundles were often squeezed inwards (V). (W) Examples of TRIOBP labeling to detect rootlets of Gipc3KO heterozygote and knockout IHCs and OHCs. (X) Overlays of row 1 stereocilia for Gipc3KO heterozygote and knockout IHCs and OHCs. Both IHCs and OHC row 1 patterns show inward squeezing. Images in G–X representative of at least two repeats. Scale bar: 2 µm (X). Panel widths: G–N, 40 µm; O,P, 20 µm; Q,R, 17.3 µm; S–V, 5 µm; W, 10 µm.
Fig. 3.
Fig. 3.
GIPC3 interacts with MYO6. (A,B) Colocalization of GIPC3 and MYO6 in IHCs at P6.5 and P15.5 in C57BL/6 cochleas. Localization was performed more than three times. (C) Domain and construct structure of GIPC3 and MYO6. (D) Coomassie-stained gel showing interaction of GIPC3 and MYO6 using GST pulldowns. The GIPC3 full-length construct (red arrow) and the GIPC3 construct containing the PDZ and GH2 domains both interacted with the MYO6 HCBD construct; the GIPC3 construct containing only the PDZ domain did not. Experiment was performed twice. (E–G) NanoSPD analysis of interactions with GIPC3. All transfected cells had mCherry–GIPC3 and MYO10NANOTRAP; GFP–MYO6TAIL constructs were also included, which interacted with MYO10NANOTRAP and were targeted to filopodial tips (arrows). (E) Example of interaction of mCherry–GIPC3 with GFP–MYO6TAIL-A. (F) Prey fluorescence with various constructs. Mean±s.d. plotted. P-values are one-way ANOVA comparisons with Dunnett correction for multiple comparisons to no-bait condition with Dunnett correction for multiple comparisons. au, arbitrary units. (G) Intensity correlation analysis, using scatter plot of bait (X-axis) and prey (Y-axis) fluorescence at individual filopodia tips (from three independent determinations). We used linear fits through the origin; values for slope and R2 were: MYO6A-A (0.172, 0.19), MYO6A-B (0.156, 0.21), MYO6A-C (0.207, 0.39), MYO7A (0.015, −0.32), no bait (0.032, −0.85). Dashed lines are 95% confidence intervals. Sample sizes (n) were MYO6A-A (79 filopodia), MYO6A-B (160), MYO6A-C (52), MYO7A (101), no bait (116). (H,I) MYO6 localization did not change in Gipc3KO/KO IHCs. (J,K) GIPC3 was mislocalized in Myo6 CRISPR knockout G0 IHCs. Panel widths: A,B, 25 µm; E, 30 µm; H–K, 35 µm.
Fig. 4.
Fig. 4.
Cuticular plate defects in Gipc3-knockout mice. (A) Examples of phalloidin labeling at the level of the cuticular plate for C57BL/6 IHCs (X-Y slices). Red dashed line in P2.5 example outlines cuticular plate. Lateral and medial sides of the hair cell indicated in the P4.5 panel. CP, cuticular plate; AB, circumferential actin belt. (B,C) Examples of phalloidin labeling at the level of the cuticular plate for Gipc3KO heterozygote (B) and homozygote (C) IHCs. (D,E) Triple labeling for TJP1 (ZO1; showing apical cell junctions), F-actin and LMO7 (showing cuticular plate). (F) Diagrams illustrating X-Y slice used for panels A–E and X-Z reslice used for panels G–K. Lateral and medial sides of the hair cell are indicated. (G) Examples of phalloidin labeling through the cuticular plate for C57BL/6 IHCs (X-Z reslices). SC, stereocilia; M, medial edge of hair cell; L, lateral edge. (H,I) Examples of phalloidin labeling through the cuticular plate for Gipc3KO heterozygote (H) and homozygote (I) IHCs. (J,K) Triple labeling for TJP1, actin and LMO7. (L–O) Imaris reconstruction (rendering) of LMO7 labeling in Gipc3KO heterozygote (L,M) and homozygote (N,O) IHCs at P16.5. The lateral (kinocilium) edge of the hair cell is at top in L and N; the medial edge is at the bottom. M and O are the same cuticular plates as in L and N but are rotated in two axes. (P–R) Quantification of cuticular plate dimensions (mean±s.d.). (P) Quantification of IHC cuticular plate area from P2.5 to P19.5 in C57BL/6 IHCs (left) and from P2.5 to P21.5 Gipc3KO heterozygote and homozygote IHCs (right). For Gipc3KO, unpaired two-tailed t-tests were used for statistical comparisons. Mean±s.e.m. are plotted in right panels (also for M and N). P-values for cuticular plate area were: P2.5, 0.0073 (n=24 and 13); P6.5, P<0.00001 (n=28 and 27); P8.5, P<0.00001 (n=32 and 41); P15.5, P<0.00001 (n=18 and 25); P21.5, P<0.00001 (n=17 and 14). (Q) Quantification of cuticular plate depth from P2.5 to P19.5 in C57BL/6 IHCs (left) and from P2.5 to P25.5 in Gipc3KO heterozygote and homozygote IHCs (right). P-values for cuticular plate depth were: P2.5, 0.011 (n=33 and 19 for heterozygote and knockout); P8.5, 0.0003 (n=30 and 35); P15.5, P<0.0001 (n=60 and 53); P21.5, P<0.0001 (n=27 and 31). *P<0.05; ***P<0.001; ****P<0.0001. (R) Quantification of cuticular plate volume from P2.5 to P19.5 in C57BL/6 IHCs (left) and from P2.5 to ≥P21.5 in Gipc3KO heterozygote and homozygote IHCs (right). Data were determined from area and depth averages; mean±s.d. plotted. Panel widths: A, 17.5 µm; B–K, 12 µm; L–O, 50 µm.
Fig. 5.
Fig. 5.
Apical junction defects in Gipc3-knockout mice. (A,B) TJP1 immunoreactivity highlights apical junctions in Gipc3KO IHCs. X-Y (top) and X-Z (middle) slices. Yellow lines in upper panels indicate transects used for X-Z reslices in middle panels; magnified boxed regions of reslices are below. immunolocalization experiments were performed more than three times. IPhC, inner phalangeal cell. (C,D) Tracings of TJP1 labeling from four Gipc3KO/+ (C) and six Gipc3KO/KO (D) cochleas. (E,F) MYH9 immunoreactivity highlights apical junctions in Gipc3KO cochleas. (G) Apical circumference area for the indicated genotypes. Number of cochleas and cells per cochlea analyzed: Gipc3+/+, 2 and 4; Gipc3KO/+, 4 and 4; Gipc3KO/KO, 6 and 2–4. P-values determined from nested one-way ANOVA with Tukey correction. (H,I) SEM of P21.5 Gipc3KO/+ and Gipc3KO/KO IHC region. Insets show the junction region between an IHC, an IPhC, and the next IHC. The yellow dashed lines outline the region in between the two IHCs that is occupied by IPhC microvilli. P21.5 SEM was carried out once, with similar results seen in more than 25 IHCs in each genotype. Panel widths: A,B upper and middle panels, 80 µm; A,B lower panels, 20 µm; E,F, 35 µm; G,H, 30 µm (insets, 2 µm).
Fig. 6.
Fig. 6.
GIPC3 interaction networks identified through immunoaffinity purification and protein mass spectrometry. (A) Flow chart for anti-GIPC3 immunoaffinity purification from crude chick stereocilia extracts. F/T, flow through. (B–E) Comparison of abundance (riBAQ) of proteins detected in DSP1 total or DTSSP total (starting S7 extract; plotted on X-axis) compared to the immunoprecipitates (Y-axis) for mouse IgG control (B,C) and 10G5 anti-GIPC3 (D,E) experiments. Panels B and D show results with the DSP-crosslinked starting extract, whereas panels C and E show results with DTSSP crosslinking. Each point represents the average abundance of that protein in two experiments (biological replicates); symbol colors were arbitrarily chosen. Red dashed line is the unity line (equal riBAQ in total and IP). Key proteins are called out. Mouse IgG protein from immunoprecipitation is highlighted in gray. (F) Gene ontology analysis (cellular component) with DAVID of the top 50 proteins from the DTSSP 10G5 eluate. Red, actin-associated components; orange, intermediate filament-associated components; blue, microtubule-associated components; gray, other components. (G) Overlap of protein interaction networks of key proteins from the DTSSP 10G5 eluate (GIPC3, APPL2, MYO6, MYO18A, MYH9 and MYH10). BioGRID-defined protein networks for APPL2, MYO6, MYO18A, MYH9 and MYH10 were compared with the top 100 proteins from the DTSSP 10G5 eluate. Only proteins identified as interactors of two or more of the key proteins were included. Proteins in bold were present in the top 100 proteins from the DTSSP 10G5 eluate.
Fig. 7.
Fig. 7.
MYO18A is located in the hair cell apical domain. (A) Top, sequence logo for binding of ligands to GIPC1 PDZ domain; bottom, C-terminal ten amino acids of APPL2, MYO18A, ACTN1 and ACTN4. (B) Immunolocalization of MYO18A in P14.5 mouse cochlea; slices from a three-dimensional image stack. Transects for other image axes are shown in yellow; the X and Y transects in the main X-Y image show the locations for the Y-Z and X-Z images. Arrow indicates concentration of MYO18A immunoreactivity below the IHC cuticular plate. IHC, inner hair cell; IPC, inner pillar cell; OPC, outer pillar cell; OHC, outer hair cell. Immunolocalization experiments for MYO18A were performed more than five times. (C,D) MYO18A immunoreactivity in P15.5 IHCs using lattice SIM imaging. (C) Image showing four IHCs at the stereocilia/cuticular plate level. (D) Image showing a single IHC (labeled with asterisk in C) at the cuticular plate level (different plane than in C). Arrows delineate the gap between cuticular plate actin and the circumferential actin belt. (E,F) MYO18A immunoreactivity in P14.5 IHCs from folded cochleas using Airyscan imaging. E is from a Gipc3KO/+ mouse and F is from a Gipc3KO/KO mouse. (G) NanoSPD of MYO18A–GIPC3. Example of filopodial targeting of mCherry–GIPC3 by GFP–FL-MYO18A, mediated by MYO10NANOTRAP. (H) Expression of GFP–FL-MYO18A and mCherry–FL-GIPC3 constructs in HeLa cells (no MYO10NANOTRAP expressed). Arrows indicate large cytoplasmic aggregates containing GFP and mCherry. squeezing. Images in C–H representative of at least three repeats. (I) GFP–MYO18A constructs. ‘Motor’, actin- and ATP-binding domains are homologous to myosin motor domains in active myosins; IQ, isoleucine/glutamine calmodulin-binding; PBM, PDZ-binding motif. (J) mCherry–GIPC3 constructs. mCh, mCherry; GH1, GIPC-homology 1; GH2, GIPC-homology 2. (K) Prey (mCh–GIPC3) fluorescence with GFP–MYO18A constructs or GFP control. Mean±s.d. plotted in K and L. One-way ANOVA comparisons to no-bait condition with Dunnett correction for multiple comparisons. Sample sizes (n) were GFP–FL-MYO18A (105 filopodia), GFP–IQ-PBM-MYO18A (109), GFP–CC-PBM-MYO18A (116), GFP–C-PBM-MYO18A (129), GFP–ΔPBM-MYO18A (127), GFP (208). (L) Prey (mCh–GIPC3 constructs or mCh–MYO6) fluorescence with GFP-MYO18A constructs or GFP control. One-way ANOVA comparisons to no-bait condition with Dunnett correction for multiple comparisons. Sample sizes (n) were mCh–D1-GIPC3 (128 filopodia for GFP–FL-MYO18A and 88 for GFP alone), mCh–D3-GIPC3 (180 and 47) and mCh–MYO6 (107 and 93). Panel widths: B, 37.5 µm for X-Y plot (same scale applies to Y-Z and X-Z panels); C, 50 µm; D, 12 µm; E-F, 45 µm; G,H, 15 µm.
Fig. 8.
Fig. 8.
Model for GIPC3 coupling of apical cell junctions to the cuticular plate. (A) Tracings of averaged TJP1-labeled apical cell borders at indicated ages (adapted from fig. 2 of Etournay et al., 2010 with permission). (B,C) Key complexes and processes in P1 IHC. The cuticular plate is rounded up early in development. Apical junctions in blue, cuticular plate in dark orange, stereocilia in gray. The pericuticular necklace is the gap between the apical junctions and the cuticular plate. MYO18A is not shown at this age. (D,E) P7.5 IHC. The cuticular plate is flattened later in development. GIPC3–MYO6 complexes are in red; the MYO18A structure is in green; MYO18A at the apical junction region is not shown. (F) As the apical circumference is remodeled between P1 and P7.5, the IHC narrows along the lateral-medial axis. Inside the cell, active force generated along the cochlear axis stretches the cuticular plate; maintaining constant volume, the cuticular plate passively shrinks along the lateral-medial axis. GIPC3–MYO6 complexes either generate or are simply coupled to the force production that stretches the cuticular plate. Loss of GIPC3 prevents the elongation of the cuticular plate. The MYO18A structure underneath the cuticular plate might assist in its flattening; GIPC3 could couple MYO18A there with MYO6, ACTN1 or ACTN4 in the cuticular plate. B and D show medial-lateral sections through IHC centers; C, E and F show cross-section of IHCs at level of dashed line in B and D. The pericuticular necklace was removed for clarity in C–F, and the apical junctions were removed in F.

Update of

Similar articles

Cited by

References

    1. Avraham, K. B., Hasson, T., Steel, K. P., Kingsley, D. M. and Russell, L. B. (1995). The mouse Snell's waltzer deafness gene encodes an unconventional myosin. Nat. Genet. 11, 369-375. 10.1038/ng1295-369 - DOI - PubMed
    1. Avraham, K. B., Hasson, T., Sobe, T., Balsara, B., Testa, J. R., Skvorak, A. B., Morton, C. C., Copeland, N. G. and Jenkins, N. A. (1997). Characterization of unconventional MYO6, the human homologue of the gene responsible for deafness in Snell's waltzer mice. Hum. Mol. Genet. 6, 1225-1231. 10.1093/hmg/6.8.1225 - DOI - PubMed
    1. Banani, S. F., Lee, H. O., Hyman, A. A. and Rosen, M. K. (2017). Biomolecular condensates: organizers of cellular biochemistry. Nat. Rev. Mol. Cell Biol. 18, 285-298. 10.1038/nrm.2017.7 - DOI - PMC - PubMed
    1. Billington, N., Beach, J. R., Heissler, S. M., Remmert, K., Guzik-Lendrum, S., Nagy, A., Takagi, Y., Shao, L., Li, D., Yang, Y.et al. (2015). Myosin 18A coassembles with nonmuscle myosin 2 to form mixed bipolar filaments. Curr. Biol. 25, 942-948. 10.1016/j.cub.2015.02.012 - DOI - PMC - PubMed
    1. Bird, J. E., Barzik, M., Drummond, M. C., Sutton, D. C., Goodman, S. M., Morozko, E. L., Cole, S. M., Boukhvalova, A. K., Skidmore, J., Syam, D., et al. (2017). Harnessing molecular motors for nanoscale pulldown in live cells. Mol. Biol. Cell 28, 463-475. 10.1091/mbc.e16-08-0583 - DOI - PMC - PubMed

Publication types