

Plasma levels of interleukin-6 mediate neurocognitive performance in older breast cancer survivors: The Thinking and Living With Cancer study
- PMID: 37096888
- PMCID: PMC10750797
- DOI: 10.1002/cncr.34784
Plasma levels of interleukin-6 mediate neurocognitive performance in older breast cancer survivors: The Thinking and Living With Cancer study
Abstract
Background: Immune activation/inflammation markers (immune markers) were tested to explain differences in neurocognition among older breast cancer survivors versus noncancer controls.
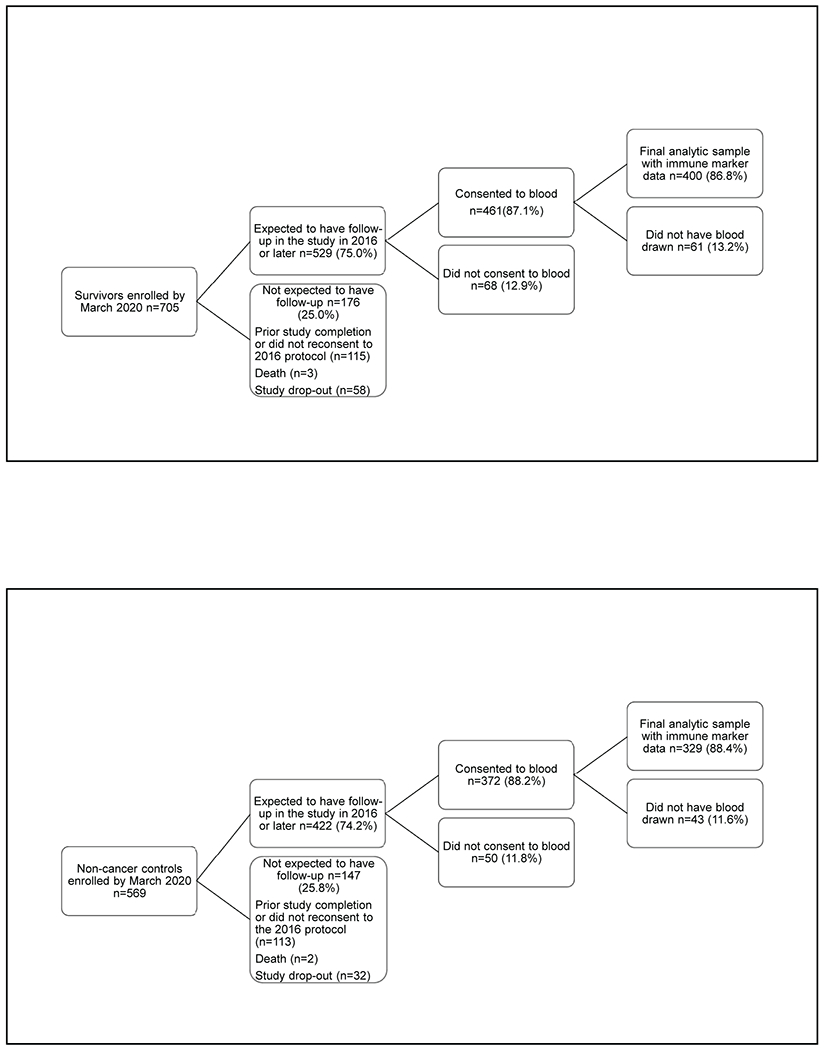
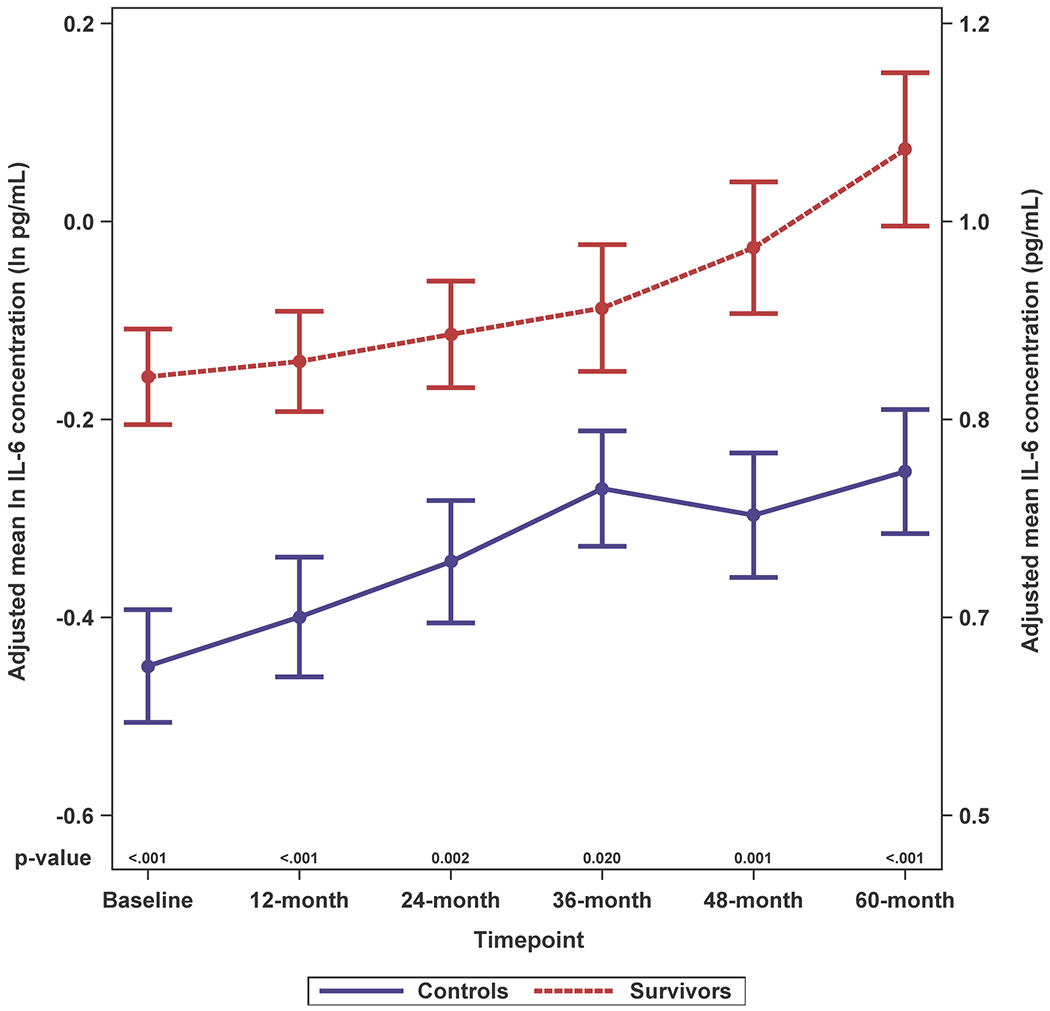
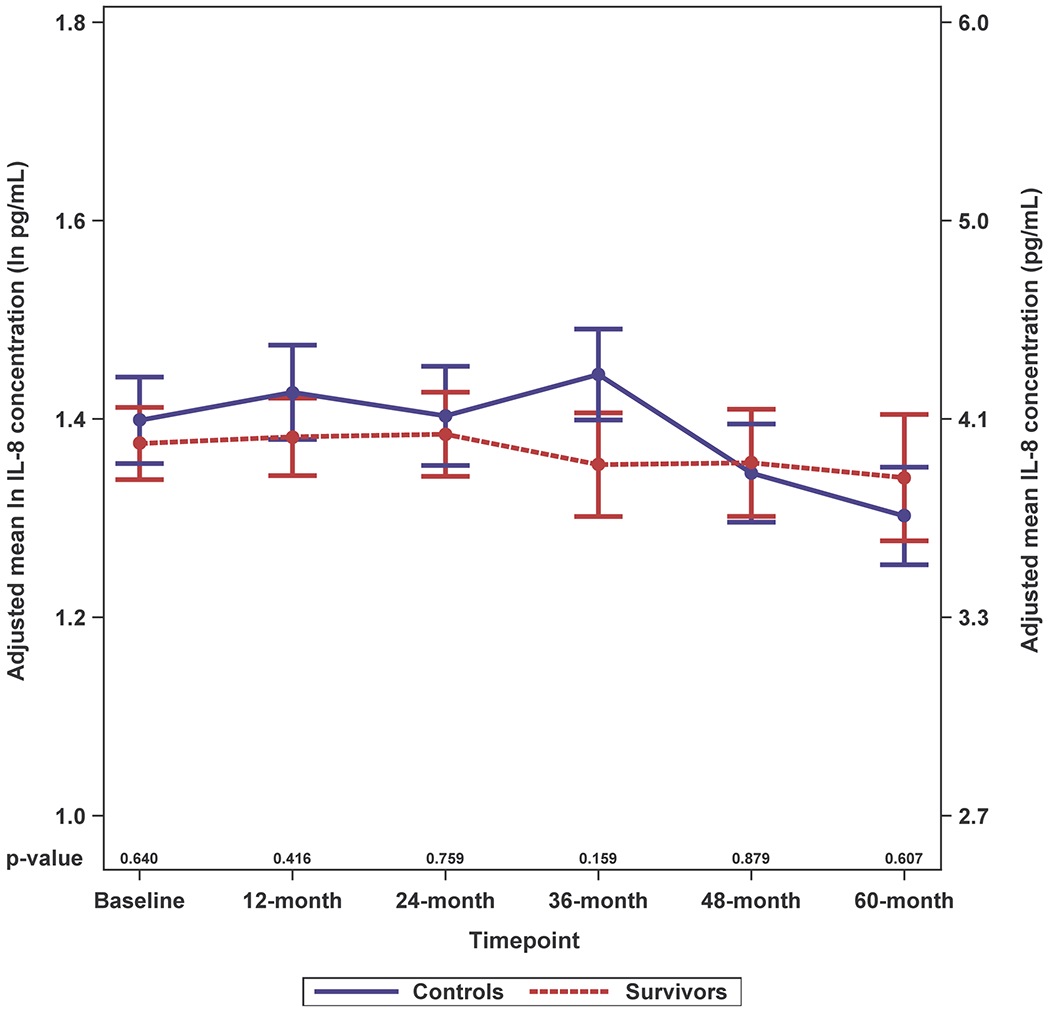
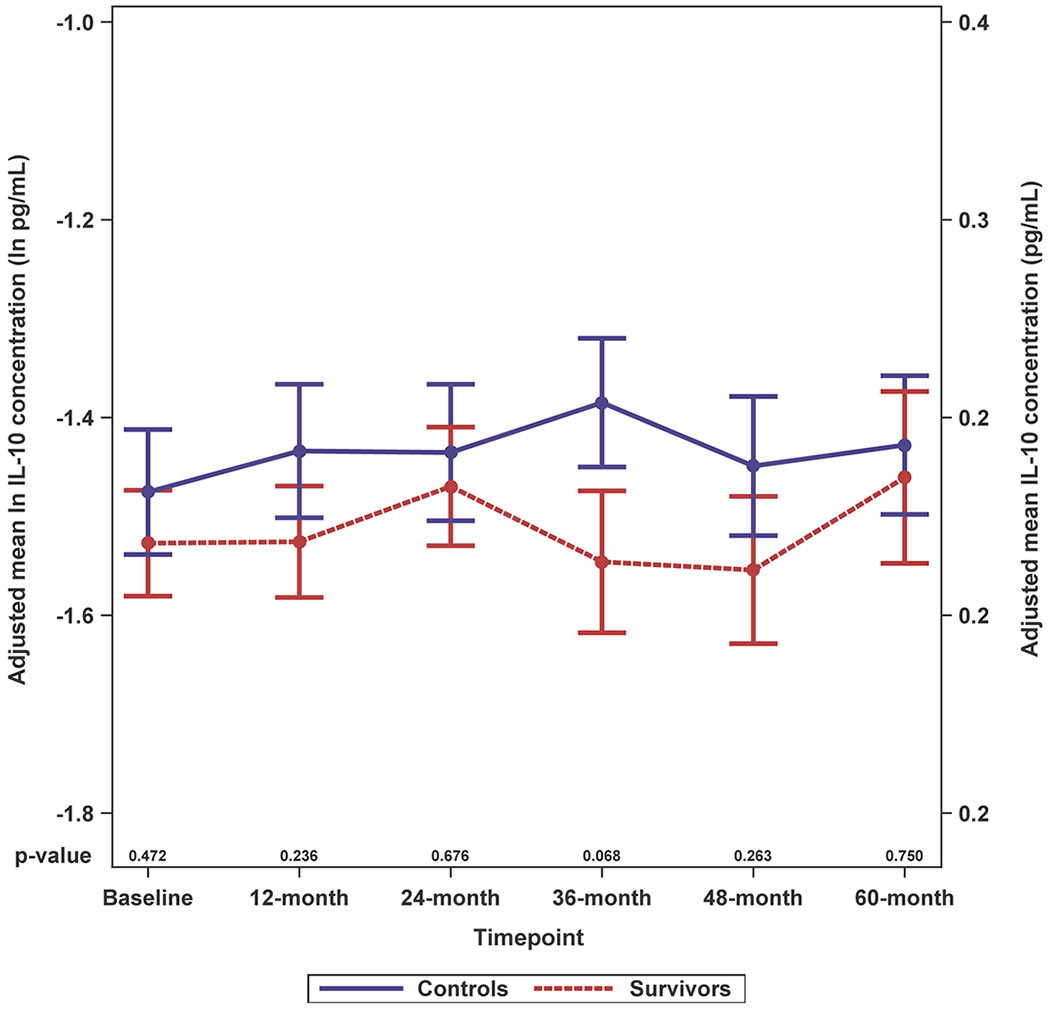
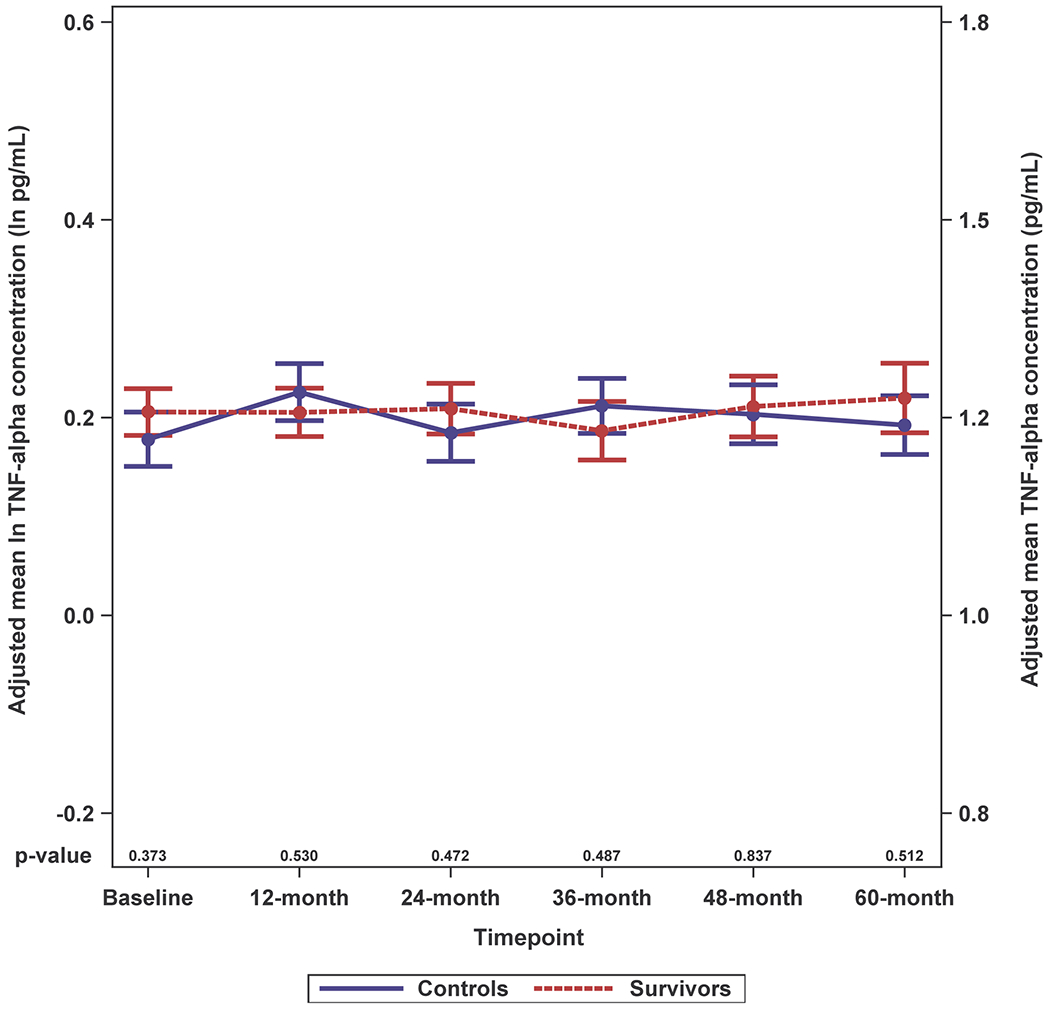
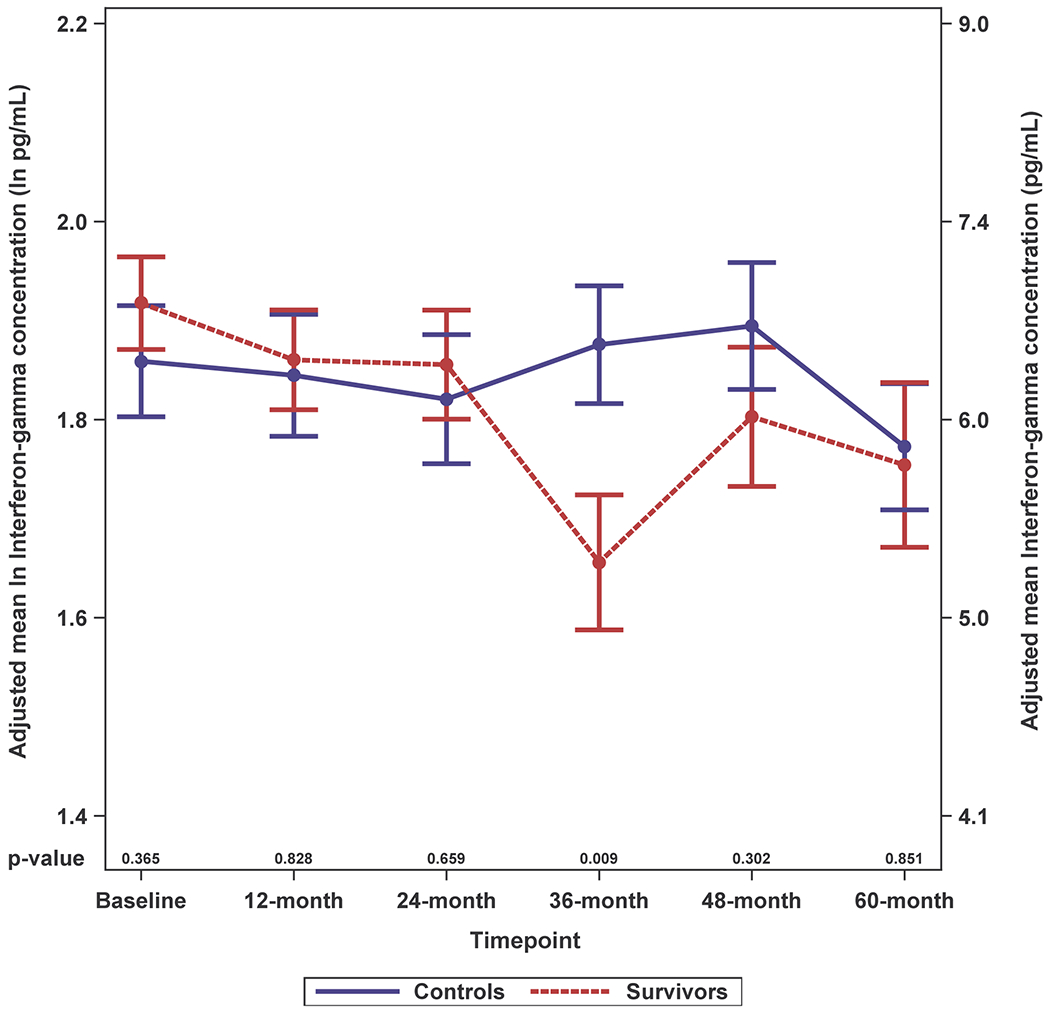
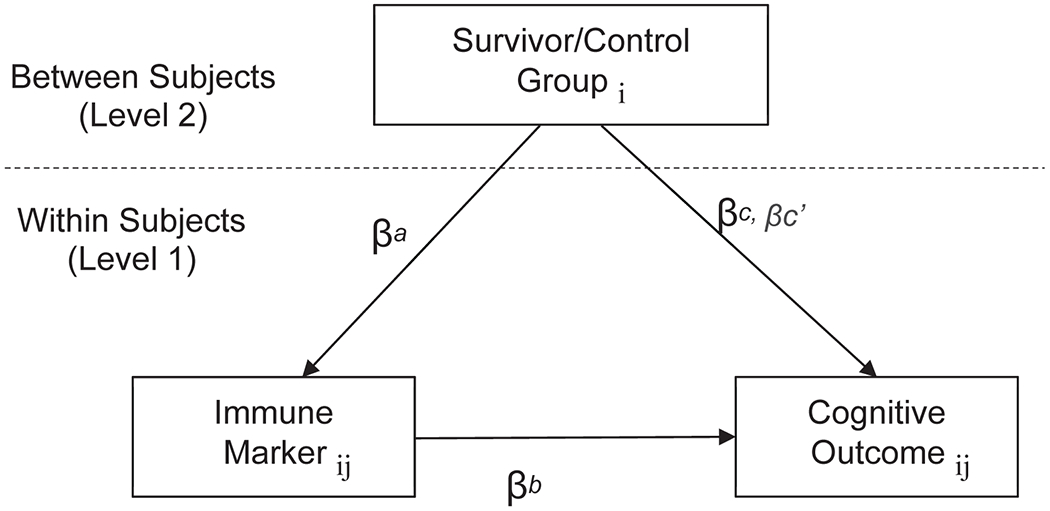
Methods: Women >60 years old with primary breast cancer (stages 0-III) (n = 400) were assessed before systemic therapy with frequency-matched controls (n = 329) and followed annually to 60 months; blood was collected during annual assessments from 2016 to 2020. Neurocognition was measured by tests of attention, processing speed, and executive function (APE). Plasma levels of interleukin-6 (IL-6), IL-8, IL-10, tumor necrosis factor α (TNF-α), and interferon γ were determined using multiplex testing. Mixed linear models were used to compare results of immune marker levels by survivor/control group by time and by controlling for age, racial/ethnic group, cognitive reserve, and study site. Covariate-adjusted multilevel mediation analyses tested whether survivor/control group effects on cognition were explained by immune markers; secondary analyses examined the impact of additional covariates (e.g., comorbidity and obesity) on mediation effects.
Results: Participants were aged 60-90 years (mean, 67.7 years). Most survivors had stage I (60.9%) estrogen receptor-positive tumors (87.6%). Survivors had significantly higher IL-6 levels than controls before systemic therapy and at 12, 24, and 60 months (p ≤ .001-.014) but there were no differences for other markers. Survivors had lower adjusted APE scores than controls (p < .05). Levels of IL-6, IL-10, and TNF-α were related to APE, with IL-6 explaining part of the relationship between survivor/control group and APE (p = .01). The magnitude of this mediation effect decreased but remained significant (p = .047) after the consideration of additional covariates.
Conclusions: Older breast cancer survivors had worse long-term neurocognitive performance than controls, and this relationship was explained in part by elevated IL-6.
Keywords: breast cancer; cancer-related cognitive decline; cognition; immune activation; inflammation; older survivors.
© 2023 American Cancer Society.
Figures
Similar articles
-
Elevated C-Reactive Protein and Subsequent Patient-Reported Cognitive Problems in Older Breast Cancer Survivors: The Thinking and Living With Cancer Study.J Clin Oncol. 2023 Jan 10;41(2):295-306. doi: 10.1200/JCO.22.00406. Epub 2022 Sep 30. J Clin Oncol. 2023. PMID: 36179271 Free PMC article.
-
Epigenetic aging in older breast cancer survivors and noncancer controls: preliminary findings from the Thinking and Living with Cancer Study.Cancer. 2023 Sep 1;129(17):2741-2753. doi: 10.1002/cncr.34818. Epub 2023 Jun 1. Cancer. 2023. PMID: 37259669 Free PMC article.
-
An Examination of the Longitudinal Relationship Between Cognitive Function and Physical Activity Among Older Breast Cancer Survivors in the Thinking and Living With Cancer Study.Ann Behav Med. 2023 Apr 5;57(3):237-248. doi: 10.1093/abm/kaac048. Ann Behav Med. 2023. PMID: 36356044 Free PMC article.
-
Cognitive impairment in breast cancer survivors treated with chemotherapy depends on control group type and cognitive domains assessed: A multilevel meta-analysis.Neurosci Biobehav Rev. 2017 Dec;83:417-428. doi: 10.1016/j.neubiorev.2017.10.028. Epub 2017 Oct 29. Neurosci Biobehav Rev. 2017. PMID: 29092778 Review.
-
Peripheral levels of C-reactive protein, tumor necrosis factor-α, interleukin-6, and interleukin-1β across the mood spectrum in bipolar disorder: A meta-analysis of mean differences and variability.Brain Behav Immun. 2021 Oct;97:193-203. doi: 10.1016/j.bbi.2021.07.014. Epub 2021 Jul 28. Brain Behav Immun. 2021. PMID: 34332041
Cited by
-
Accelerated Aging in Cancer and Cancer Treatment: Current Status of Biomarkers.Cancer Med. 2025 May;14(9):e70929. doi: 10.1002/cam4.70929. Cancer Med. 2025. PMID: 40322791 Free PMC article. Review.
-
Effect and clinical mechanism exploration of acupuncture intervention for chemotherapy-related cognitive impairment (CRCI) in triple-negative breast cancer: study protocol for a randomized controlled trial.Front Neurol. 2025 Jul 23;16:1565040. doi: 10.3389/fneur.2025.1565040. eCollection 2025. Front Neurol. 2025. PMID: 40771967 Free PMC article.
-
Inflammation and cognitive performance in elite athletes: A cross-sectional study.Brain Behav Immun Health. 2024 Oct 5;42:100872. doi: 10.1016/j.bbih.2024.100872. eCollection 2024 Dec. Brain Behav Immun Health. 2024. PMID: 39881815 Free PMC article.
-
Age-related and postmenopausal breast cancer progression and treatment management: The significance of pro-inflammatory cytokines and CXC chemokines.Genes Dis. 2025 Mar 19;12(5):101606. doi: 10.1016/j.gendis.2025.101606. eCollection 2025 Sep. Genes Dis. 2025. PMID: 40584290 Free PMC article. Review.
-
Alzheimer disease-related biomarkers and cancer-related cognitive decline: the Thinking and Living with Cancer study.J Natl Cancer Inst. 2024 Sep 1;116(9):1495-1507. doi: 10.1093/jnci/djae113. J Natl Cancer Inst. 2024. PMID: 38788675 Free PMC article.
References
-
- Ahles TA, Saykin AJ, McDonald BC, et al. Longitudinal assessment of cognitive changes associated with adjuvant treatment for breast cancer: impact of age and cognitive reserve. Journal of clinical oncology : official journal of the American Society of Clinical Oncology. 2010;28(29):4434–4440. doi:10.1200/JCO.2009.27.0827 - DOI - PMC - PubMed
Publication types
MeSH terms
Substances
Grants and funding
- U54 CA137788/CA/NCI NIH HHS/United States
- K01 CA212056/CA/NCI NIH HHS/United States
- AG072976/AG/NIA NIH HHS/United States
- R01 CA237535/CA/NCI NIH HHS/United States
- R01 CA244673/CA/NCI NIH HHS/United States
- K08 CA241337/CA/NCI NIH HHS/United States
- K99 CA270294/CA/NCI NIH HHS/United States
- AG068086/AG/NIA NIH HHS/United States
- CA137788/CA/NCI NIH HHS/United States
- K01 AG065485/AG/NIA NIH HHS/United States
- CA261793/CA/NCI NIH HHS/United States
- CA008748/CA/NCI NIH HHS/United States
- R00 CA270294/CA/NCI NIH HHS/United States
- R01 CA218496/CA/NCI NIH HHS/United States
- R01 AG082348/AG/NIA NIH HHS/United States
- AG028716/AG/NIA NIH HHS/United States
- CA244673/CA/NCI NIH HHS/United States
- R01 CA261793/CA/NCI NIH HHS/United States
- P30 AG010133/AG/NIA NIH HHS/United States
- R01 CA172119/CA/NCI NIH HHS/United States
- P30CA51008/NH/NIH HHS/United States
- CA212056/CA/NCI NIH HHS/United States
- CA51008/CA/NCI NIH HHS/United States
- CA129769/CA/NCI NIH HHS/United States
- R56 AG068086/AG/NIA NIH HHS/United States
- CA241337/CA/NCI NIH HHS/United States
- P30 CA008748/CA/NCI NIH HHS/United States
- CA237535/CA/NCI NIH HHS/United States
- U54 CA132378/CA/NCI NIH HHS/United States
- P30 CA051008/CA/NCI NIH HHS/United States
- R01 CA129769/CA/NCI NIH HHS/United States
- AG010133/AG/NIA NIH HHS/United States
- R01 AG068193/AG/NIA NIH HHS/United States
- CA197289/CA/NCI NIH HHS/United States
- P30 AG028716/AG/NIA NIH HHS/United States
- CA172119/CA/NCI NIH HHS/United States
- P30 AG072976/AG/NIA NIH HHS/United States
- CA270294/CA/NCI NIH HHS/United States
- R35 CA197289/CA/NCI NIH HHS/United States
LinkOut - more resources
Full Text Sources
Medical
Research Materials
Miscellaneous
