

PI-RADS: Where Next?
- PMID: 37097134
- PMCID: PMC10315529
- DOI: 10.1148/radiol.223128
PI-RADS: Where Next?
Abstract
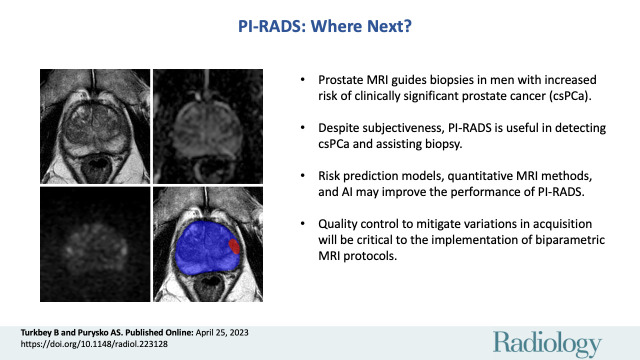
Prostate MRI plays an important role in the clinical management of localized prostate cancer, mainly assisting in biopsy decisions and guiding biopsy procedures. The Prostate Imaging Reporting and Data System (PI-RADS) has been available to radiologists since 2012, with the most up-to-date and actively used version being PI-RADS version 2.1. This review article discusses the current use of PI-RADS, including its limitations and controversies, and summarizes research that aims to improve future iterations of this system.
© RSNA, 2023 See also the review "Adnexal Lesion Imaging: Past, Present, and Future" by Sadowski et al in this issue.
Conflict of interest statement
Figures
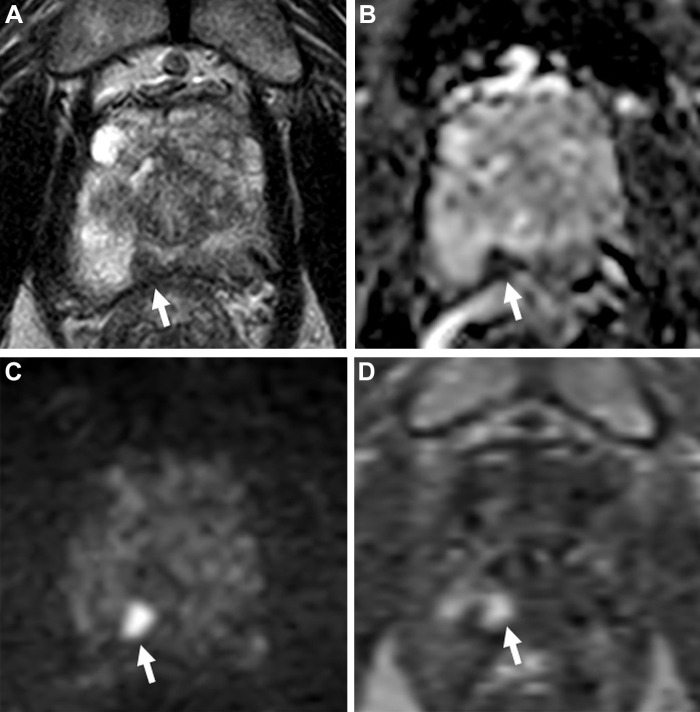
![Images in a 74-year-old man with a serum prostate-specific antigen level
of 12.9 ng/mL. (A) Axial T2-weighted MRI scan, (B) apparent diffusion
coefficient map, and (C) diffusion-weighted image with a b value of 1500 sec/mm2
demonstrate no focal lesion within the prostate gland. (D) Dynamic
contrast-enhanced MRI scan shows a very subtle linear enhancement in the right
mid peripheral zone (arrow). Overall, the multiparametric MRI examination was
negative for a cancer-suspicious lesion according to the Prostate Imaging
Reporting and Data System. (E) Axial fluorine 18 DCFPyL PET/CT image
demonstrates bilateral uptake (greater on the right side) in the prostate
(arrows). Prostate biopsy revealed Gleason 4+3 prostate cancer within the right
mid peripheral zone. DCFPyL =
2-(3-{1-carboxy-5-[(6-18F-fluoro-pyridine-3-carbonyl)-amino]-pentyl}-ureido)-pentanedioic
acid).](https://cdn.ncbi.nlm.nih.gov/pmc/blobs/82c5/10315529/88f77069e914/radiol.223128.fig4.jpg)
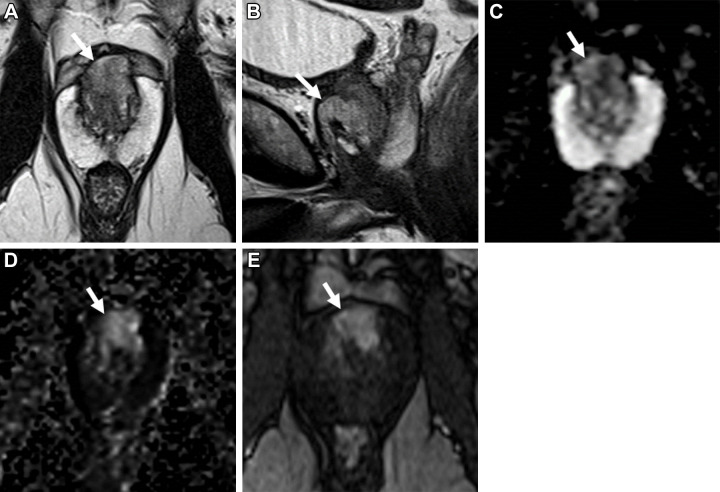
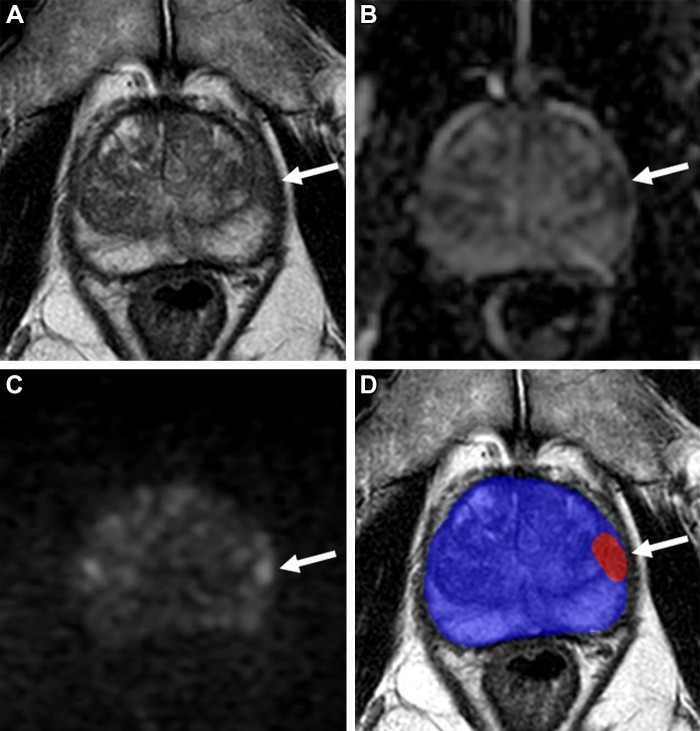
![Images in a 59-year-old man with a prostate-specific antigen level of 2.9
ng/mL and a prior negative prostate biopsy. (A) Axial T2-weighted MRI scan shows
a subtle, noncircumscribed, moderately hypointense focus in the left base
posteromedial peripheral zone (arrow) (T2-weighted MRI Prostate Imaging
Reporting and Data System [PI-RADS] score of 3). On the (B) axial
diffusion-weighted image with a high b value (1400 sec/mm2), the lesion has
ill-defined mildly hyperintense signal (arrow), and on the (C) apparent
diffusion coefficient (ADC) map, it has markedly hypointense signal (arrow)
(diffusion-weighted imaging and ADC PI-RADS score of 3). On the (D) dynamic
contrast-enhanced (DCE) MRI scan, the lesion shows early contrast enhancement
(arrow) (DCE MRI PI-RADS score of positive). The final assessment category
assigned was PI-RADS category 4. The focal abnormality was not identified at the
time of the MRI interpretation by a novice reader, who assigned PI-RADS category
2 to the examination. Upon review of the images by a more experienced reader,
the lesion was identified, and an MRI-targeted biopsy of the lesion revealed
prostate cancer with a Gleason score of 3+4.](https://cdn.ncbi.nlm.nih.gov/pmc/blobs/82c5/10315529/69b9a533f443/radiol.223128.fig6.jpg)
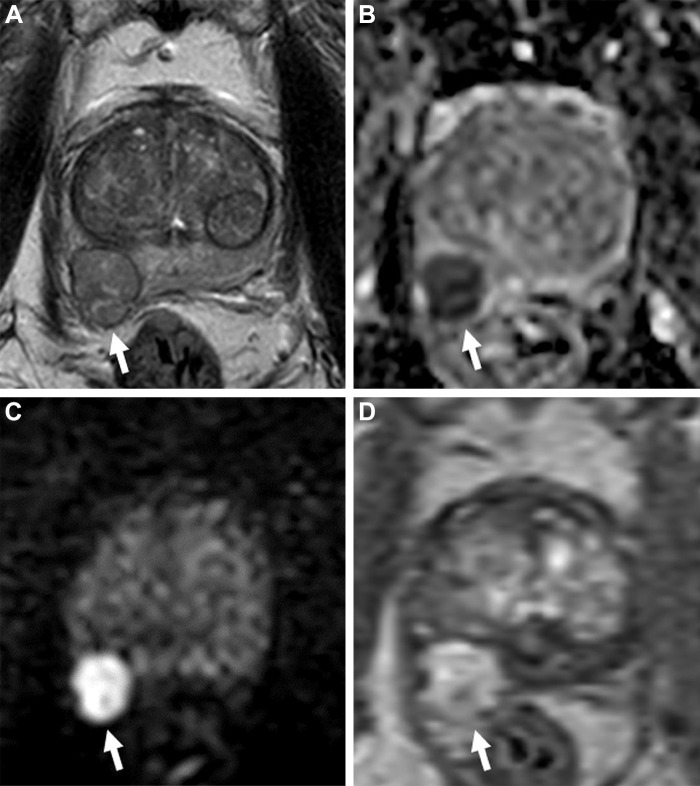
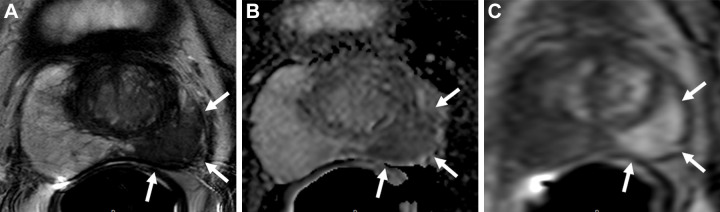
![Images in a 65-year-old man with a prostate-specific antigen level of 3.4
ng/mL and no prior biopsy. (A) Axial T2-weighted MRI scan shows a 0.6-cm focal
lesion with hypointense signal in the right mid posteromedial peripheral zone
(arrow) (T2-weighted MRI Prostate Imaging Reporting and Data System [PI-RADS]
score of 4). (B) Axial diffusion-weighted image with a high b value of 1400
sec/mm2 shows susceptibility artifacts from rectal gas (arrow), causing
geometric distortion that makes it difficult to categorize the lesion. (C) The
apparent diffusion coefficient map shows the lesion with a markedly hypointense
signal (arrow), and it is not as distorted as at diffusion-weighted imaging. (D)
Dynamic contrast-enhanced (DCE) MRI scan shows early focal contrast enhancement
within this lesion (arrow) (DCE MRI PI-RADS score of positive). The DCE image
helped confirm the finding on the T2-weighted image and assign a final
assessment category, since at least two of the three sequences must have
sufficient diagnostic quality to give a Prostate Imaging Reporting and Data
System score. MRI-targeted biopsy of the lesion revealed prostate cancer with a
Gleason score of 3+4.](https://cdn.ncbi.nlm.nih.gov/pmc/blobs/82c5/10315529/6c18edbb425e/radiol.223128.fig8.jpg)
References
-
- Steyn JH , Smith FW . Nuclear magnetic resonance imaging of the prostate . Br J Urol 1982. ; 54 ( 6 ): 726 – 728 . - PubMed
-
- Dickinson L , Ahmed HU , Allen C , et al. . Magnetic resonance imaging for the detection, localisation, and characterisation of prostate cancer: recommendations from a European consensus meeting . Eur Urol 2011. ; 59 ( 4 ): 477 – 494 . - PubMed
Publication types
MeSH terms
LinkOut - more resources
Full Text Sources
Medical
Research Materials
Miscellaneous
