. 2023 Aug 7;220(8):e20221483.
doi: 10.1084/jem.20221483. Epub 2023 Apr 25.

TRAF3-EWSR1 signaling axis acts as a checkpoint on germinal center responses

Affiliations

TRAF3-EWSR1 signaling axis acts as a checkpoint on germinal center responses

Yanchuan Li et al. J Exp Med. .

Erratum in

Abstract

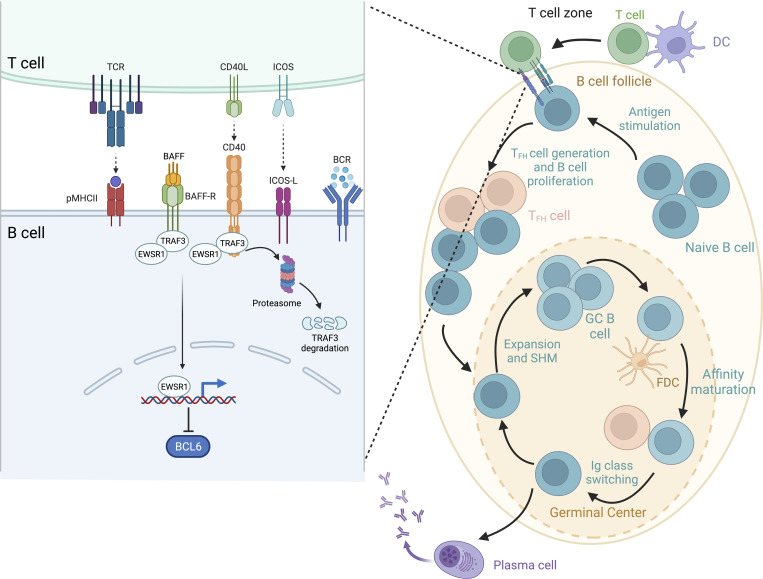
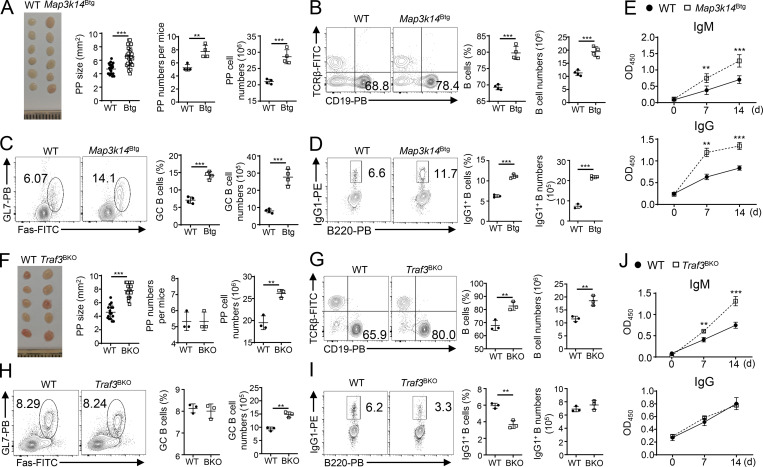
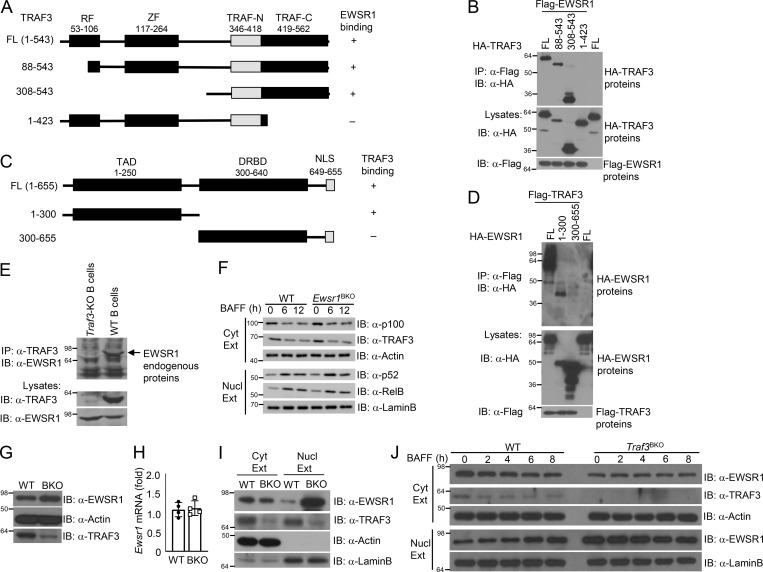
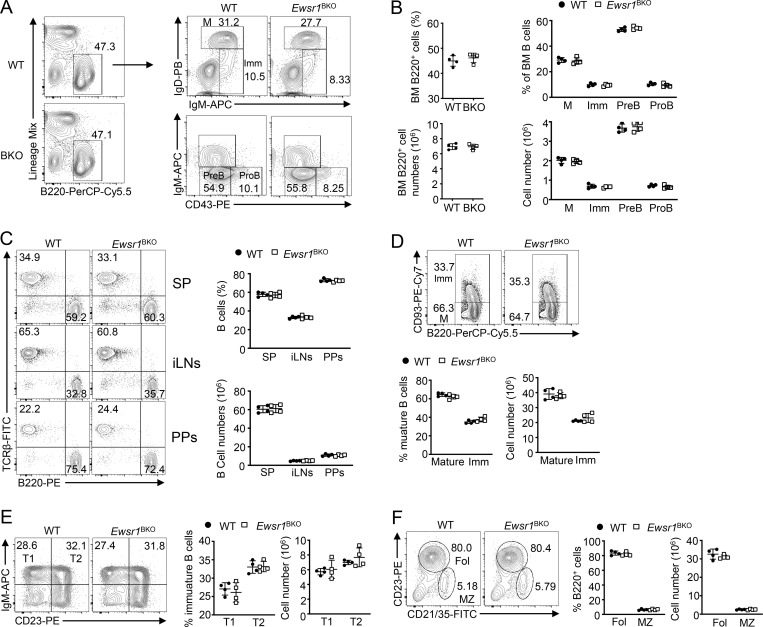
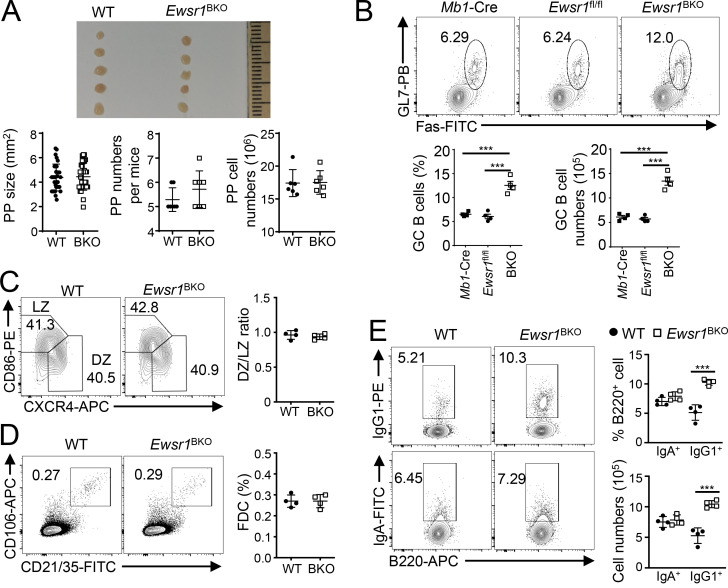
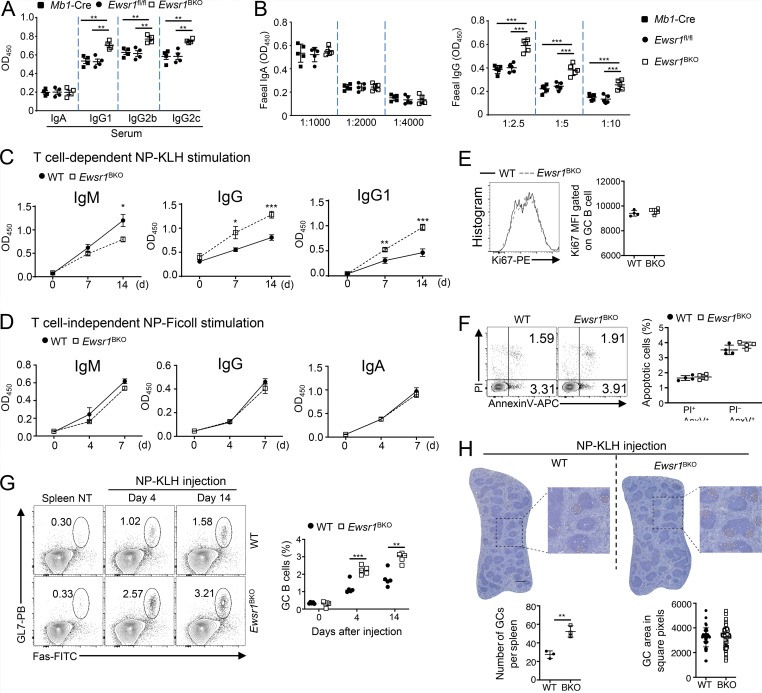
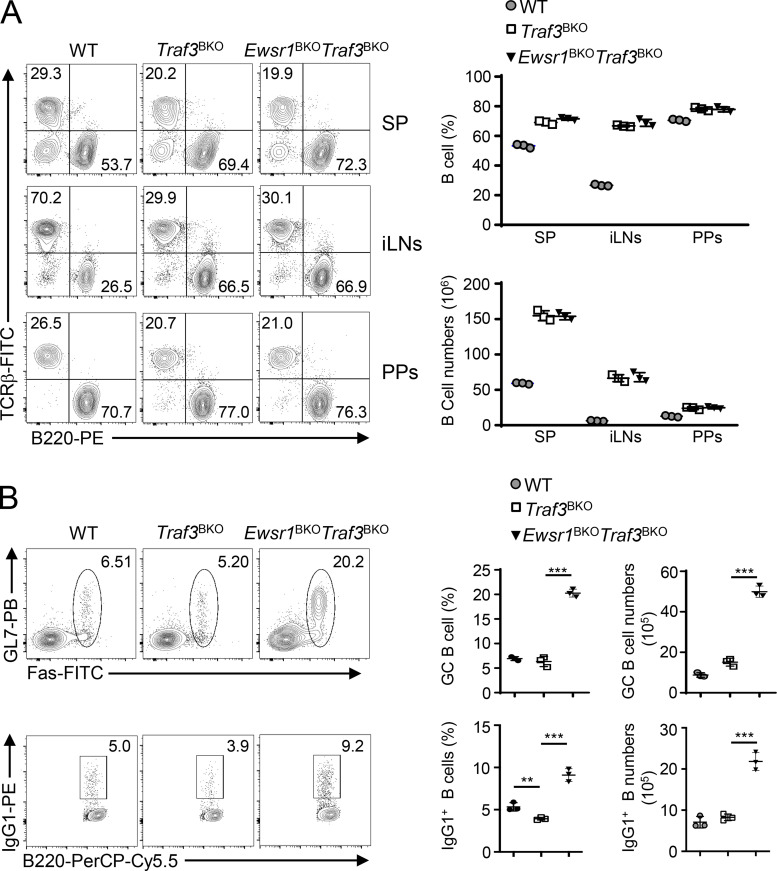
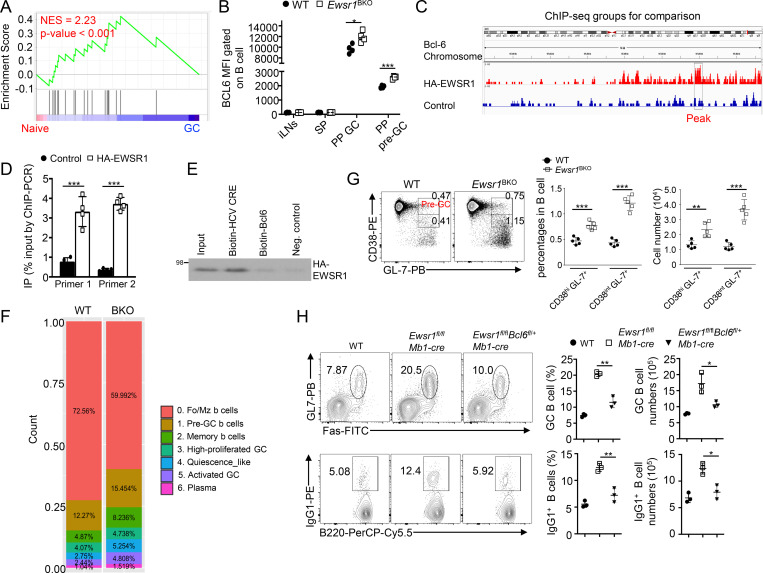
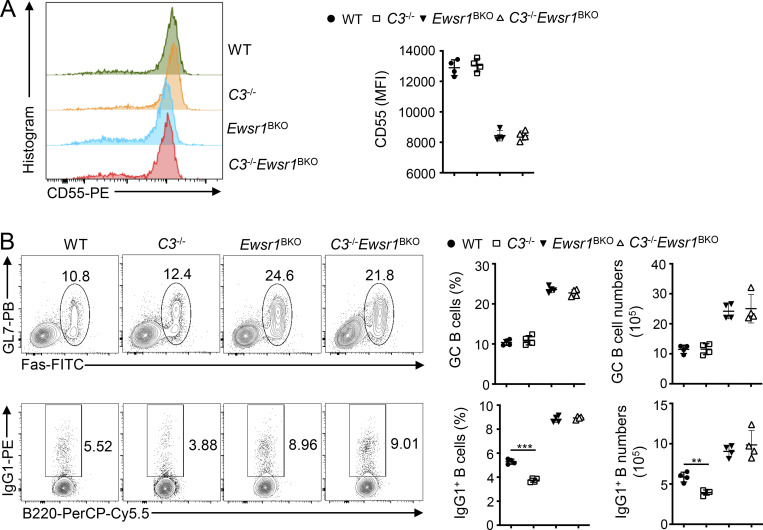
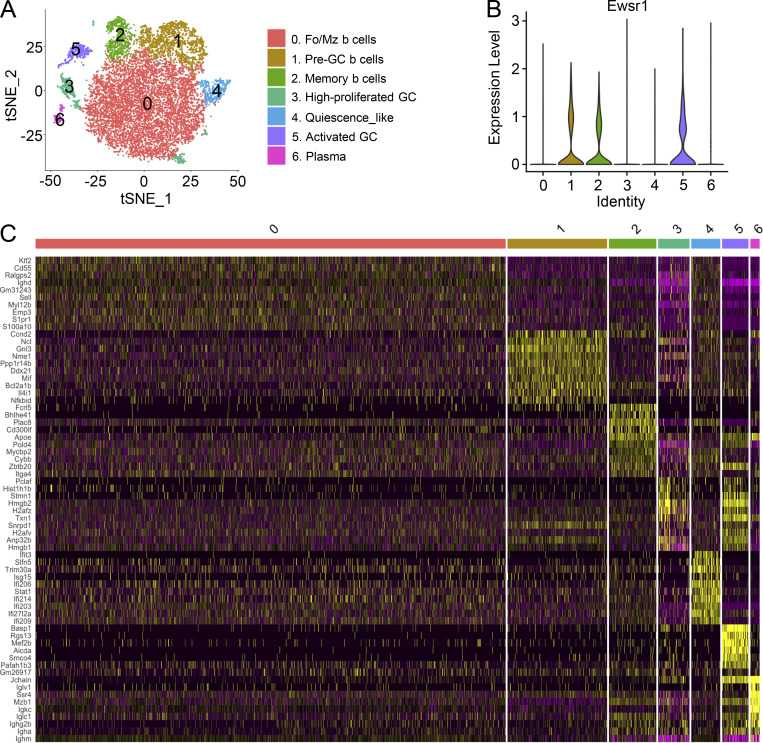
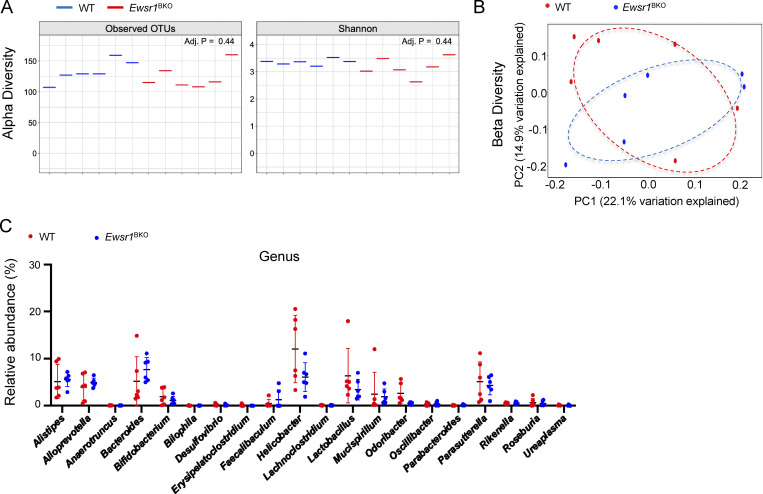
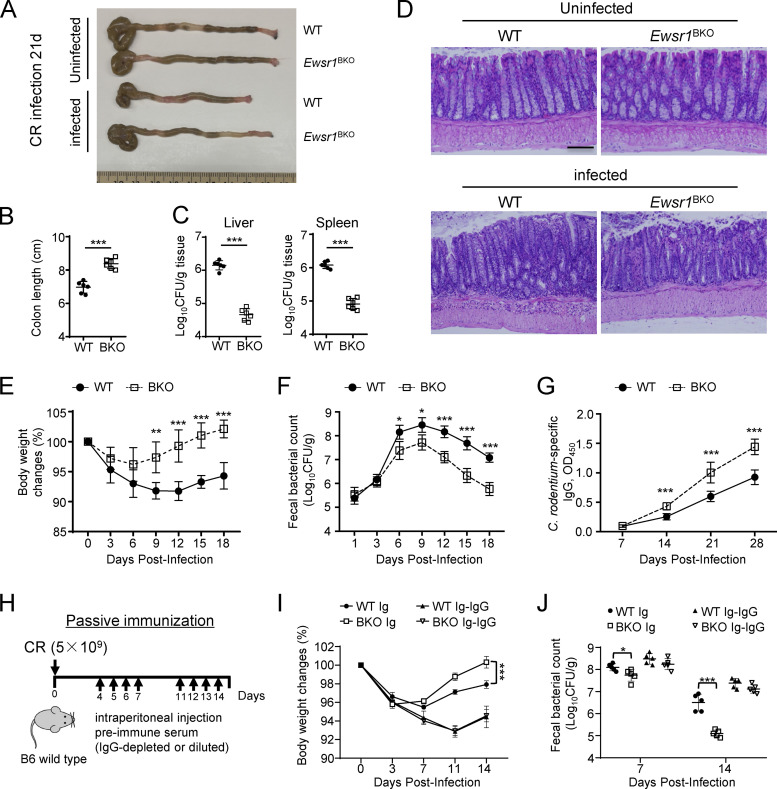
The formation of germinal centers (GCs) is crucial for humoral immunity and vaccine efficacy. Constant stimulation through microbiota drives the formation of constitutive GCs in Peyer's patches (PPs), which generate B cells that produce antibodies against gut antigens derived from commensal bacteria and infectious pathogens. However, the molecular mechanism that regulates this persistent process is poorly understood. We report that Ewing Sarcoma Breakpoint Region 1 (EWSR1) is a brake to constitutive GC generation and immunoglobulin G (IgG) production in PPs, vaccination-induced GC formation, and IgG responses. Mechanistically, EWSR1 suppresses Bcl6 upregulation after antigen encounter, thereby negatively regulating induced GC B cell generation and IgG production. We further showed that tumor necrosis factor receptor-associated factor (TRAF) 3 serves as a negative regulator of EWSR1. These results established that the TRAF3-EWSR1 signaling axis acts as a checkpoint for Bcl6 expression and GC responses, indicating that this axis is a therapeutic target to tune GC responses and humoral immunity in infectious diseases.


Conflict of interest statement

Disclosures: The authors declare no competing interests exist.

Figures

None
Graphical abstract
Figure 1.
Figure 1.
Analysis of GC homeostasis and humoral immunity in Map3k14Btg and Traf3BKO mice. (A) Representative PP image and summary graphs of PPs size (WT: n = 21, Btg: n = 31), numbers and cell numbers of WT and Map3k14Btg mice (n = 4 mice/group, 6–8 wk old). (B) Flow cytometric analysis of CD19+ B cells in PPs of WT or Map3k14Btg mice (n = 4 mice/group, 6–8 wk old). (C) Flow cytometric analysis of GC B cells (B220+ GL7+Fas+) in PPs of WT or Map3k14Btg mice (n = 4 mice/group, 6–8 wk old). (D) Flow cytometric analysis of IgG1+ B cells in PPs of WT or Map3k14Btg mice (n = 4 mice/group, 6–8 wk old). (E) T cell–dependent immune response in WT and Map3k14Btg mice (n = 5 mice/group, 6–8 wk old). Serum levels of NP-specific IgM and IgG were measured by ELISA at indicated time points. (F) Representative PPs image and summary graphs of PP size (WT: n = 16, BKO: n = 16), and cell numbers of WT and Traf3BKO mice (n = 3 mice/group, 6–8 wk old). (G) Flow cytometric analysis of CD19+ B cells in PPs of WT or Traf3BKO mice (n = 3 mice/group, 6–8 wk old). (H) Flow cytometric analysis of GC B cells in PPs of WT or Traf3BKO mice (n = 3 mice/group, 6–8 wk old). (I) Flow cytometric analysis of IgG1+ B cells in PPs of WT or Traf3BKO mice (n = 3 mice/group, 6–8 wk old). (J) T cell–dependent immune response in WT and Traf3BKO mice (n = 5 mice/group, 6–8 wk old). Serum levels of NP-specific IgM and IgG were measured by ELISA at indicated time points. Data are representative of three independent experiments. Summary graphs are presented as mean ± SD (A–D and F–I) or mean ± SEM. (E and J) P values were determined by unpaired two-tailed Student’s t test. **P < 0.01 and ***P < 0.001.
Figure 2.
Figure 2.
TRAF3 regulates EWSR1 nuclear localization via protein interaction. (A) Schematic diagram of TRAF3 and its truncation mutants, depicting the ring finger (RF), zinc finger (ZF), and TRAF (TRAF-N and TRAF-C) domains and indicating their EWSR1-binding affinity based on the coIP results from B. (B) CoIP analysis of EWSR1 interaction with TRAF3 mutants using whole-cell lysates of HEK293 cells transfected with the indicated expression vectors. Cell lysates were also subjected to direct immunoblotting (IB) to monitor the expression of TRAF3 mutants and EWSR1. (C) Schematic diagram depicting the transcriptional activation domain (TAD), DNA- and RNA-binding domains (DRBD), and nuclear localization signals (NLS) of EWSR1 and its mutants and their ability to bind TRAF3 (based on coIP results of D). (D) CoIP analysis of TRAF3 interaction with EWSR1 mutants using whole-cell lysates of HEK293 cells transfected with the indicated expression vectors (upper). Cell lysates were also subjected to direct immunoblotting to monitor the expression of EWSR1 mutants and TRAF3 (lower). (E) CoIP analysis of endogenous TRAF3/EWSR1 interaction in splenic B cells. TRAF3 deleted B cells were used as a negative control. (F) Immunoblot analysis of the indicated proteins using cytoplasmic or nuclear extracts of WT and Ewsr1BKO splenic B cells stimulated as indicated. (G) Immunoblot analysis of the indicated proteins in whole-cell lysates of freshly isolated splenic B cells from WT and Traf3BKO mice. (H) RT-qPCR analysis of Ewsr1 mRNA in WT and Traf3BKO splenic B cells. (I) Immunoblot analysis of the indicated proteins using cytoplasmic (Cyt Ext) and nuclear (Nucl Ext) extracts of freshly isolated splenic B cells from WT and Traf3BKO mice. (J) Immunoblot analysis of the indicated proteins using cytoplasmic or nuclear extracts of WT and Traf3BKO splenic B cells stimulated as indicated. Data are representative of three independent experiments. The molecular weight measurements are kD. Source data are available for this figure: SourceData F2.
Figure S1.
Figure S1.
Generation of Ewsr1BKO mice. (A) Schematic of Ewsr1 gene targeting using an FRT-LoxP vector. Targeted mice were crossed with Mb1-Cre to generate BKO mice. (B) Genotyping PCR analysis of Ewsr1+/+ (+/+), Ewsr1+/fl (+/fl), and Ewsr1fl/fl (fl/fl) mice crossed with Mb1-Cre mice, showing WT and flox alleles of Ewsr1 gene as well as Mb1 WT and Mb1-Cre fusion gene locus. (C) Immunoblot (IB) analysis of the EWSR1 proteins deletion in whole-cell lysates of freshly isolated splenic B cells from WT and Ewsr1BKO mice. Data are representative of three independent experiments. The molecular weight measurements are kD. Source data are available for this figure: SourceData FS1.
Figure S2.
Figure S2.
Flow cytometric analysis of B cell–specific EWSR1 deletion in bone marrow and secondary lymphoid organs. (A and B) Flow cytometric analysis of pro-B (B220+ IgMCD43+), pre-B cell (B220+ IgMCD43+), immature B (Imm, B220+IgM+IgD), and mature B (M, B220+IgM+IgD+) stages in the bone marrow (BM) of WT and Ewsr1BKO mice (n = 4 mice/group, 6–8 wk old). (C) Flow cytometric analyses of B220+ B cells in the spleen (SP), inguinal lymph nodes (iLNs), and PPs of WT or Ewsr1BKO mice (n = 4 mice/group, 6–8 wk old). (DF) Flow cytometric analyses of immature (Imm, B220+CD93+) and mature (B220+ CD93) B cells (D), immature T1 (CD93+IgM+CD23) and T2 (CD93+IgM+CD23+) B cells (E), and follicular ([Fol] B220+ CD21intCD23+CD93) and marginal zone ([MZ] B220+ CD21hiCD23CD93) B cells (F) in the spleens of WT and Ewsr1BKO mice (n = 4 mice/group, 6–8 wk old). Data are representative of three independent experiments. Summary graphs are presented as mean ± SD, and P values were determined by unpaired two-tailed Student’s t test.
Figure 3.
Figure 3.
Ewsr1 controls GC generation in PPs under homeostatic conditions. (A) Representative image and summary graphs of PP size (WT: n = 32, BKO: n = 32), numbers, and cell numbers in WT and Ewsr1BKO mice (n = 6 mice/group, 6–8 wk old). (B) Flow cytometric analysis of GC B cells in PPs of WT (Mb1-Cre and Ewsr1fl/fl) or Ewsr1BKO mice (n = 4 mice/group, 6–8 wk old). (C) Flow cytometric analysis of the DZ (CXCR4highCD86low) and LZ (CXCR4lowCD86high) ratio in the PPs of WT and Ewsr1BKO mice (n = 4 mice/group, 6–8 wk old). (D) Flow cytometric analysis of follicular dendritic cells (FDC; CD45CD31CD106+CD21/35+) in PPs of WT or Ewsr1BKO mice (n = 4 mice/group, 6–8 wk old). (E) Flow cytometric analysis of IgG1+ B cells and IgA+ B cells in PPs of WT or Ewsr1BKO mice (n = 4 mice/group, 6–8 wk old). Data are representative of three independent experiments. Summary graphs are presented as mean ± SD. P values were determined by an unpaired two-tailed Student’s t test. ***P < 0.001.
Figure 4.
Figure 4.
Increased IgG antibody responses in Ewsr1BKO mice. (A and B) ELISA analysis of basal IgG isotype levels in serum (A; n = 4 mice/group, 8 wk old) or fecal (B; n = 5 mice/group, 8 wk old) samples from non-immunized WT (Mb1-Cre and Ewsr1fl/fl) and Ewsr1BKO mice. (C) ELISA analysis kinetics of NP-specific IgM, IgG, and IgG1 production after NP-KLH–immunized WT and Ewsr1BKO mice (n = 8 mice/group, 6–8 wk old). (D) ELISA analysis kinetics of NP-specific IgM, IgG, and IgG1 production after NP-Ficoll–immunized WT and Ewsr1BKO mice (WT: n = 6, BKO: n = 6, 6–8 wk old). (E) Flow cytometric analysis of proliferating cells (Ki67+) in the PPs of WT and Ewsr1BKO mice GC B cells (n = 4 mice/group, 6–8 wk old). (F) Flow cytometric analysis of apoptotic cells based on Annexin V and propidium iodide (PI) staining in the PPs of WT and Ewsr1BKO mouse GC B cells (n = 4 mice/group, 6–8 wk old). (G) Flow cytometric analysis of the frequency of GC B cells in WT and Ewsr1BKO mice immunized with NP-KLH for the indicated days (n = 5 mice/group, 6–8 wk old). (H) Immunohistochemical staining of GCs (peanut agglutinin+) in splenic sections from G on day 14. Scale bar: 500 μm. GC area was quantified by ImageJ. Data are representative of two (G and H) or at least three (A–F) independent experiments. Summary graphs are presented as mean ± SD. P values were determined by an unpaired two-tailed Student’s t test. *P < 0.05; **P < 0.01; ***P < 0.001.
Figure 5.
Figure 5.
Flow cytometric analysis of B cell and GC homeostasis in WT, Traf3BKO, and Traf3BKOEwsr1BKO mice. (A) Flow cytometric analysis of B220+ B cells and TCRβ+ T cells in the spleen (SP), inguinal lymph nodes (iLNs), and PPs of WT, Traf3BKO, and Traf3BKOEwsr1BKO mice (n = 3 mice/group, 6–8 wk old). (B) Flow cytometric analysis of GC B cells and IgG1+ B cells in PPs of WT, Traf3BKO, and Traf3BKOEwsr1BKO mice (n = 3 mice/group, 6–8 wk old). Data are representative of two independent experiments. Summary graphs are presented as mean ± SD, and P values were determined by unpaired two-tailed Student’s t test. **P < 0.01 and ***P < 0.001.
Figure 6.
Figure 6.
Bcl6 contributes to EWSR1-mediated GC regulation. (A) GSEA analysis of differentially expressed genes between WT and Ewsr1-deficient B cells (listed in Table S2) based on the expression profiles of purified bulk populations from naive B cells versus GC B cells after immunization with the T dependent antigen. NES, normalized enrichment score. (B) Flow cytometric analysis of Bcl6 expression using median fluorescence intensity (MFI) on gated B cells as indicated (n = 4 mice/group, 6–8 wk old). (C) Genomic location annotation and ChIP-seq peaks analysis of HA-EWSR1 and control DNA-binding specificity in A549 cells. (D) ChIP-PCR detecting the binding of EWSR1 to the first intron region of the Bcl6 gene using two different primers in BJAB cells transfected with HA-EWSR1 or control plasmid. (E) Analysis of the binding of HA-EWSR1 with Biotin-labeled Bcl6 by RNA pulldown assay. Biotin-labeled HCV CRE was the positive control. The molecular weight measurements are kD. (F) Frequency plot of each B cell population between WT and Ewsr1BKO mice according to Seurat cluster identification. Fol/MZ, follicular/marginal zone. (G) Flow cytometric analysis of pre-GC B cells (B220+ CD38hiGL-7+) and CD38intGL7+ B cells in PPs of WT or Ewsr1BKO mice (n = 4 mice/group, 6–8 wk old). (H) Flow cytometric analysis of GC B cells and IgG1+ B cells in PPs of WT, Ewsr1fl/flMb1-Cre, and Ewsr1fl/flBcl6fl/+Mb1-Cre mice (n = 3 mice/group, 6–8 wk old). Data are representative of one (A and F) or two (B, D, E, G, and H) independent experiments. Summary graphs are presented as means ± SD, and P values were determined by an unpaired two-tailed Student’s t test. *P < 0.05; **P < 0.01; and ***P < 0.001. Source data are available for this figure: SourceData F6.
Figure S3.
Figure S3.
Flow cytometric analysis of WT, C3−/−, Ewsr1BKO, and C3−/−Ewsr1BKO mice. (A) Flow cytometric analysis of the CD55 expression on gated splenic B cells from WT, C3−/−, Ewsr1BKO, and C3−/−Ewsr1BKO (n = 4 mice/group, 6–8 wk old), presented as representative histograms (left) and summary graph of median fluorescence intensity (MFI; right). (B) Flow cytometric analyses of GC B cells and IgG1+ B cells in PPs of WT, C3−/−, Ewsr1BKO, and C3−/−Ewsr1BKO (n = 4 mice/group, 6–8 wk old). Data are representative of two independent experiments. Summary graphs are presented as mean ± SD, and P values were determined by unpaired two-tailed Student’s t test. **P < 0.01; and ***P < 0.001.
Figure S4.
Figure S4.
scRNA-seq analysis of PPs B cells subsets in WT and Ewsr1BKO mice. (A) scRNA-seq data from WT and Ewsr1BKO PP B cells were combined with batch correction for a total of 13,645 cells (shown as individual dots) and displayed by annotated t-distributed stochastic neighbor embedding (tSNE). Fol/MZ, follicular/marginal zone. (B) Violin plot showing the expression level of Ewsr1 among B cell clusters in WT PP B cells. (C) Heatmap showing integrated scRNA-seq analysis of top differentially expressed genes between WT and Ewsr1BKO mice in each identified cluster. Data are representative of one independent experiment.
Figure S5.
Figure S5.
Commensal microbiota analysis in the fecal extracts of WT and Ewsr1BKO mice. (A) Visualization of alpha diversity by principal coordinate analysis (PCoA). OTU, operational taxonomic units. (B) Visualization of beta diversity by PCoA. (C) Microbiota composition at genus level (n = 6 mice/group, 8 wk old male). Data are representative of one independent experiment.
Figure 7.
Figure 7.
EWSR1 negatively regulates host defense against C. rodentium infection. WT and Ewsr1BKO mice (n = 6 mice/group, 6–8 wk old) were orally infected with 5 × 10⁹ CFU of C. rodentium. The infected and control mice were sacrificed 21 d after infection. (A–G) The colon length (A and B), bacteria titers in the liver and spleen (C), and colon histological staining with H&E with a scale bar of 200 μm (D) were analyzed. Bodyweight changes (E), fecal C. rodentium titers (F), and C. rodentium–specific IgG production in serum (G) were examined at indicated timepoints. We performed the passive immunization experiments by injecting preimmune sera into C. rodentium–infected mice. To generate immune serum, WT or Ewsr1BKO mice were infected with C. rodentium and sera were collected 3 wk later. IgG-depleted or non-depleted immune sera were injected into C. rodentium–infected mice. (H) Schematic of experimental design for passive immunization. (I and J) Bodyweight changes (I) and fecal C. rodentium titers (J) were detected in the feces of C. rodentium–infected mice as indicated (n = 5 mice/group, 6–8 wk old). Data are representative of two independent experiments. Summary graphs are presented as mean ± SD. P values were determined by unpaired two-tailed Student’s t test. *P < 0.05; **P < 0.01; and ***P <0.001.

Similar articles

Cited by

References

    1. Araya, N., Hirota K., Shimamoto Y., Miyagishi M., Yoshida E., Ishida J., Kaneko S., Kaneko M., Nakajima T., and Fukamizu A.. 2003. Cooperative interaction of EWS with CREB-binding protein selectively activates hepatocyte nuclear factor 4-mediated transcription. J. Biol. Chem. 278:5427–5432. 10.1074/jbc.M210234200 - DOI - PubMed
    1. Arkatkar, T., Du S.W., Jacobs H.M., Dam E.M., Hou B., Buckner J.H., Rawlings D.J., and Jackson S.W.. 2017. B cell-derived IL-6 initiates spontaneous germinal center formation during systemic autoimmunity. J. Exp. Med. 214:3207–3217. 10.1084/jem.20170580 - DOI - PMC - PubMed
    1. Aurias, A., Rimbaut C., Buffe D., Dubousset J., and Mazabraud A.. 1983. Translocation of chromosome 22 in Ewing’s sarcoma. C. R. Seances Acad. Sci. III. 296:1105–1107. - PubMed
    1. Basso, K., and Dalla-Favera R.. 2010. BCL6: Master regulator of the germinal center reaction and key oncogene in B cell lymphomagenesis. Adv. Immunol. 105:193–210. 10.1016/S0065-2776(10)05007-8 - DOI - PubMed
    1. Beccaria, C.G., Amezcua Vesely M.C., Fiocca Vernengo F., Gehrau R.C., Ramello M.C., Tosello Boari J., Gorosito Serrán M., Mucci J., Piaggio E., Campetella O., et al. . 2018. Galectin-3 deficiency drives lupus-like disease by promoting spontaneous germinal centers formation via IFN-γ. Nat. Commun. 9:1628. 10.1038/s41467-018-04063-5 - DOI - PMC - PubMed

Publication types