. 2023 Jul 3;220(7):e20221853.
doi: 10.1084/jem.20221853. Epub 2023 Apr 25.

Depleting CD103+ resident memory T cells in vivo reveals immunostimulatory functions in oral mucosa

Affiliations

Depleting CD103+ resident memory T cells in vivo reveals immunostimulatory functions in oral mucosa

J Michael Stolley et al. J Exp Med. .

Abstract

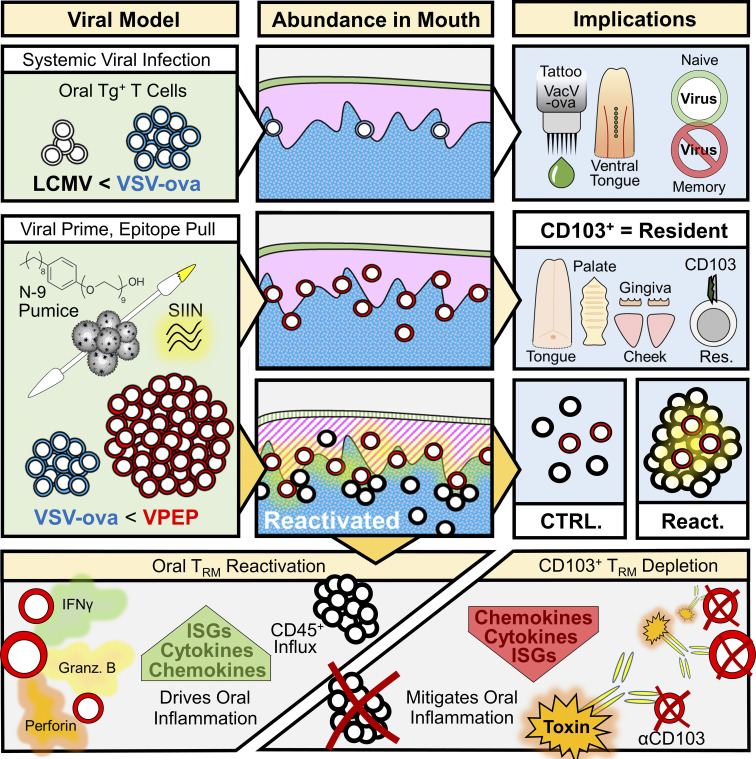
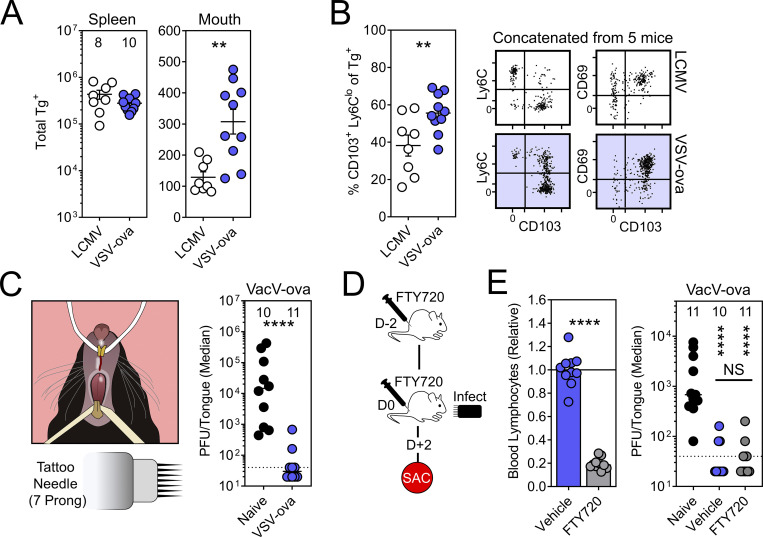
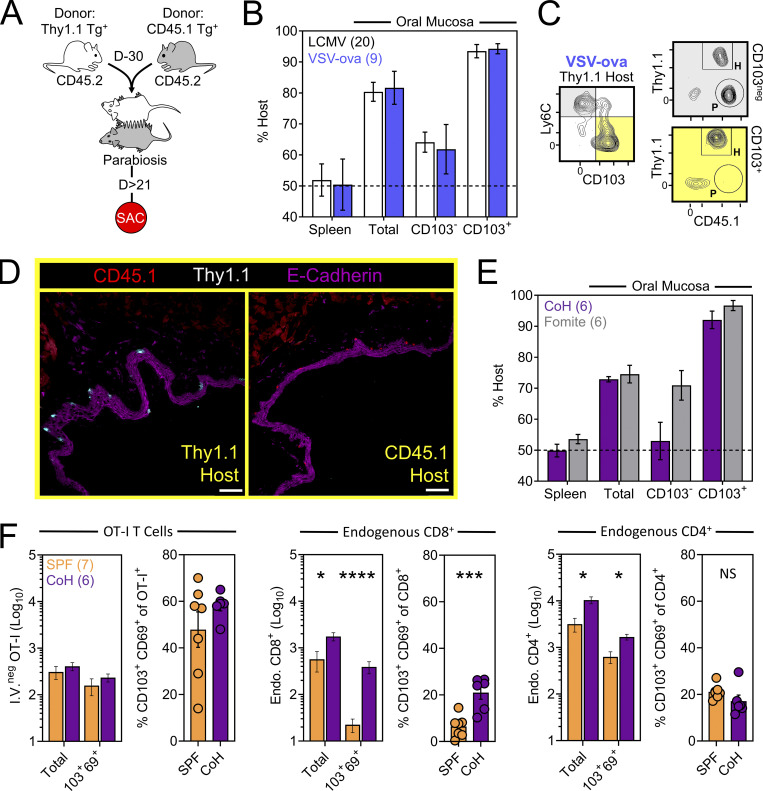
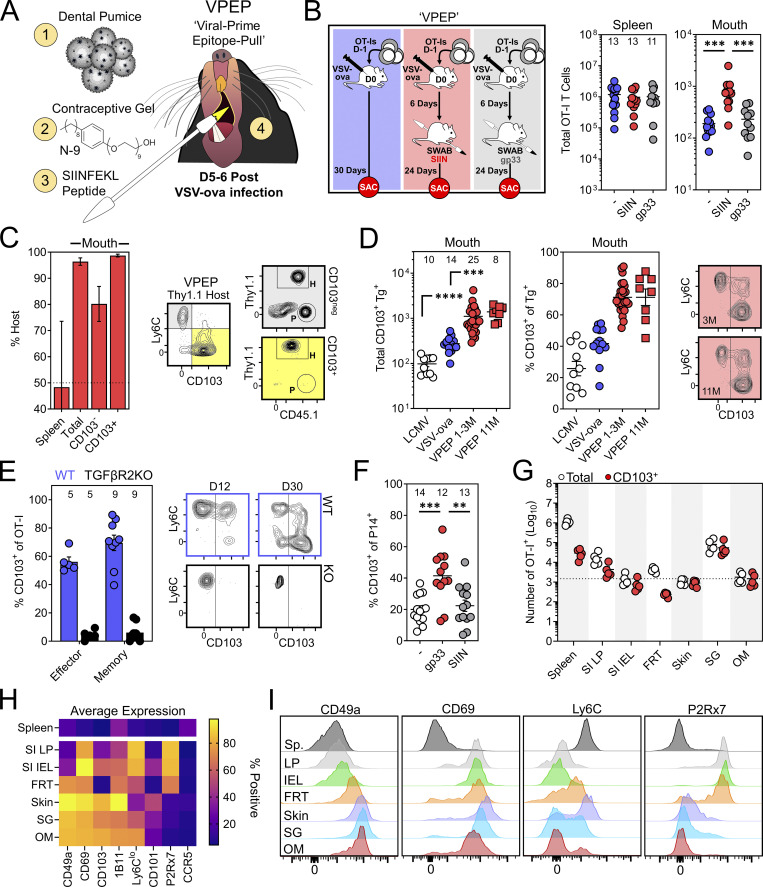
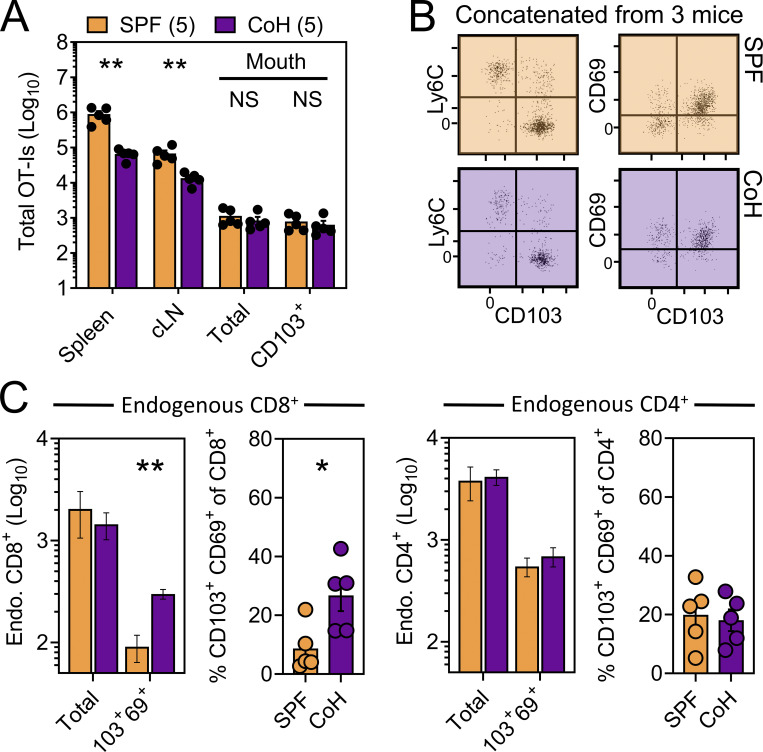
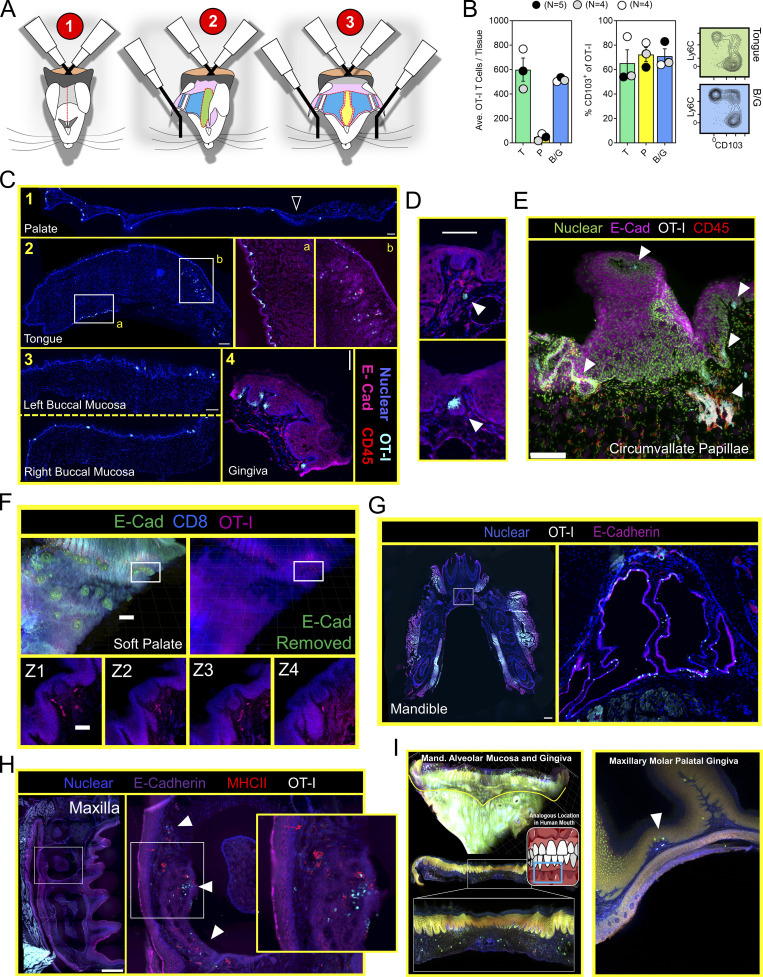
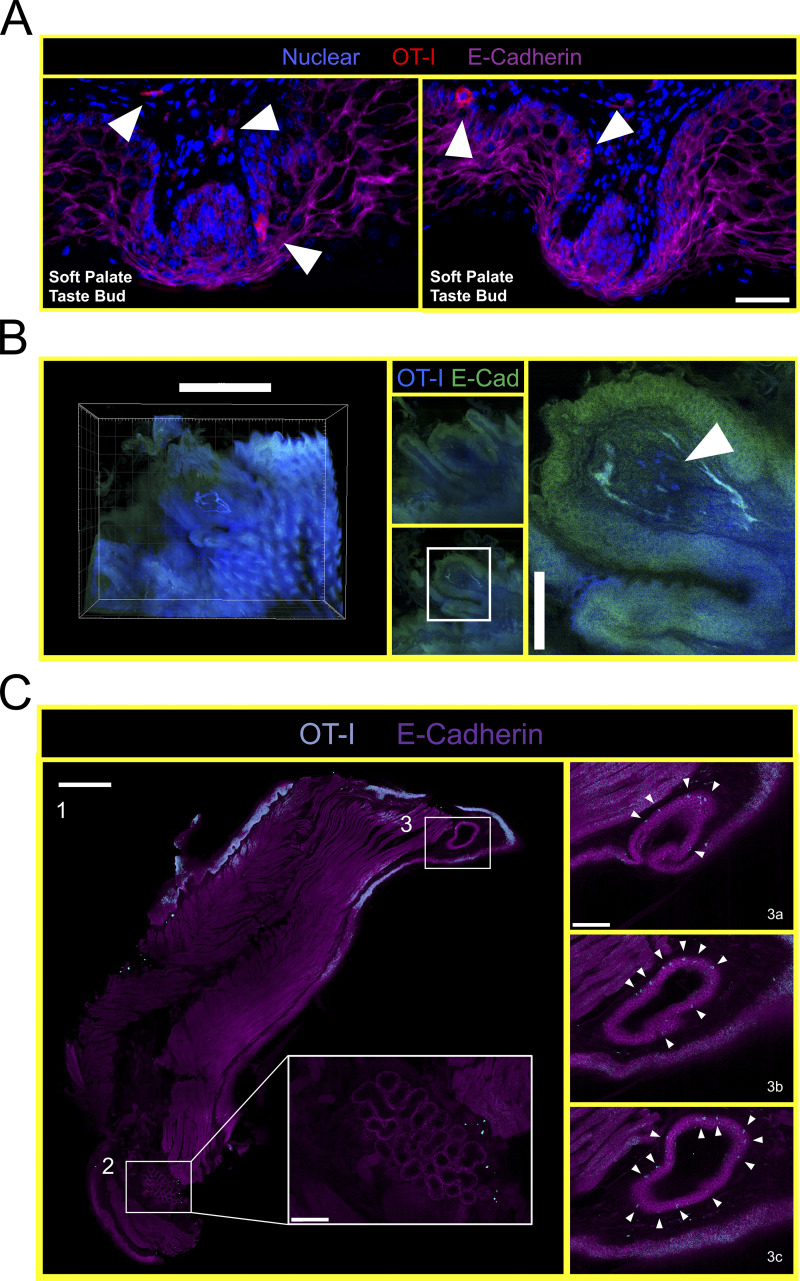
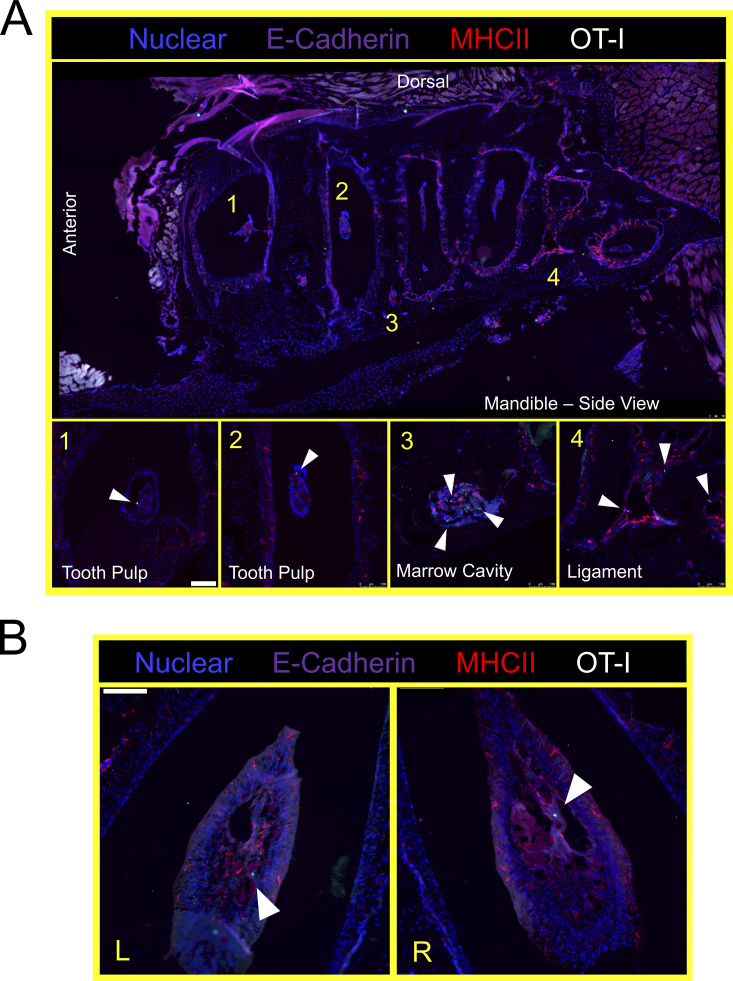
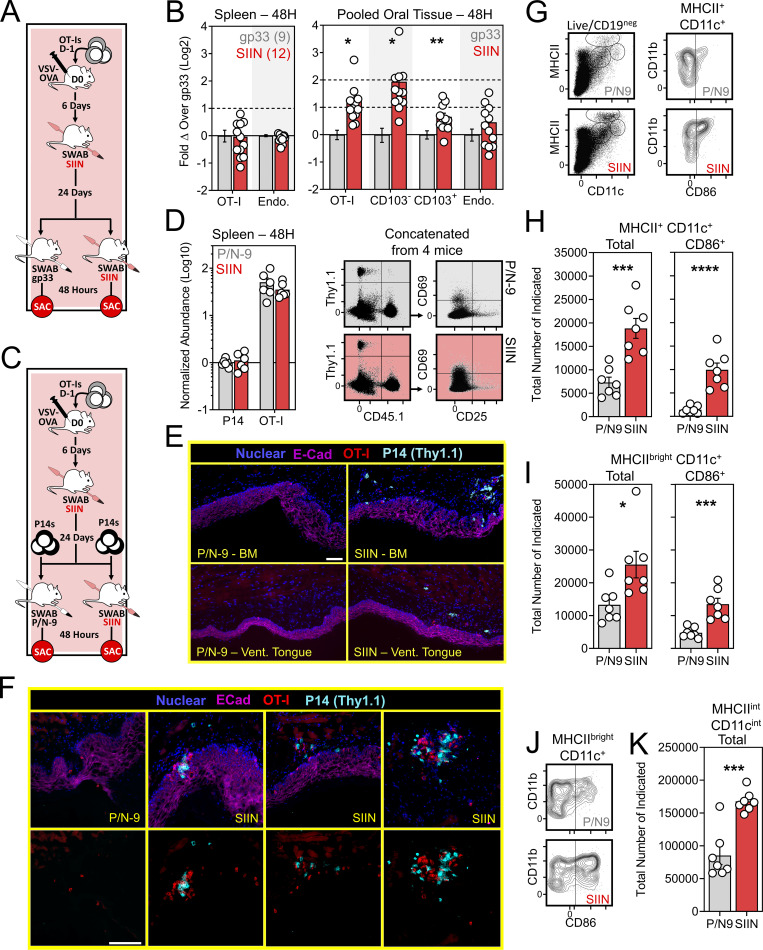
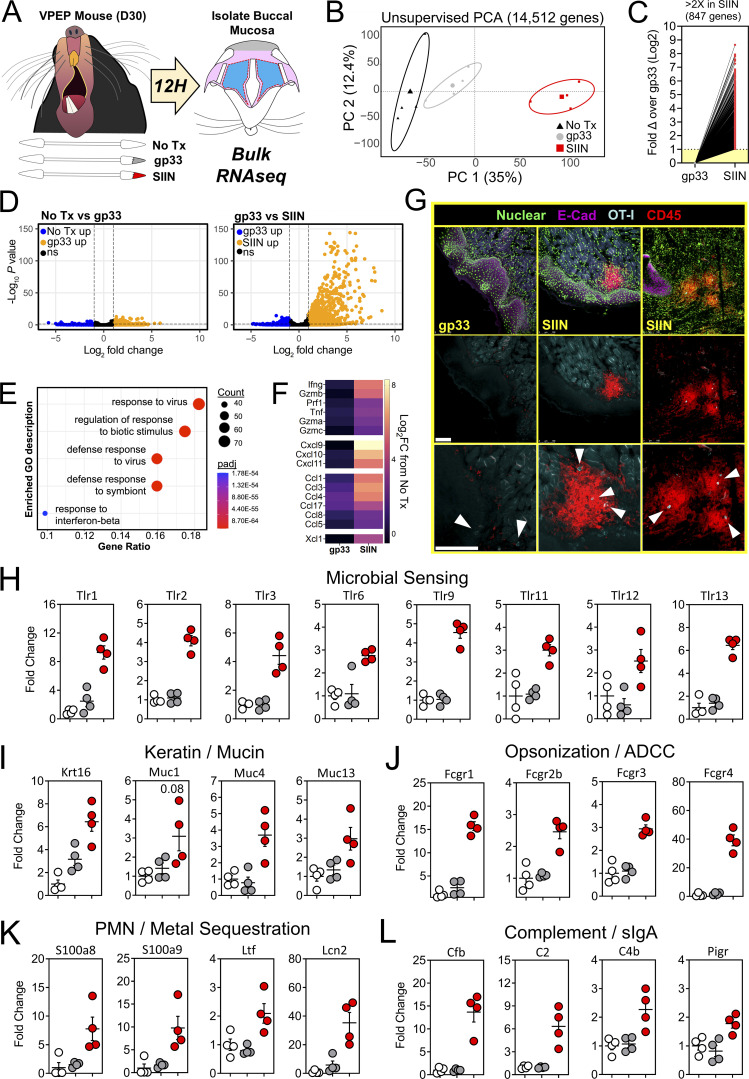
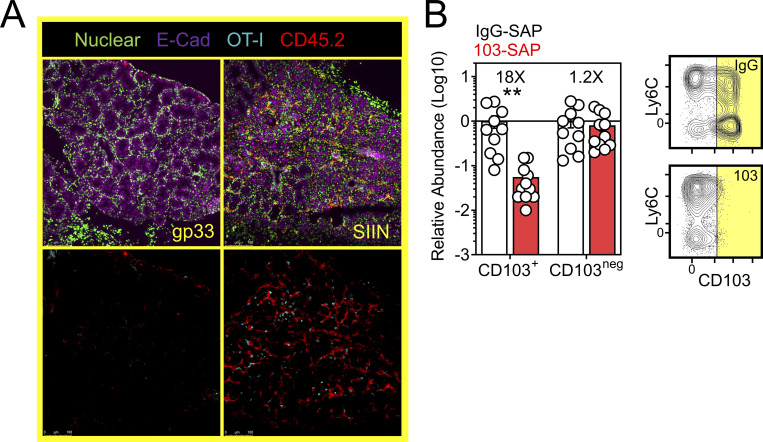
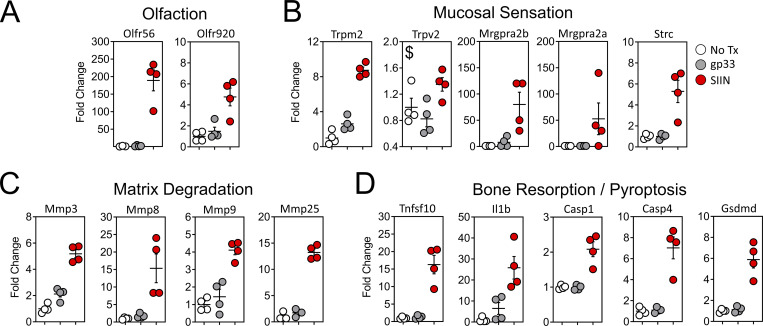
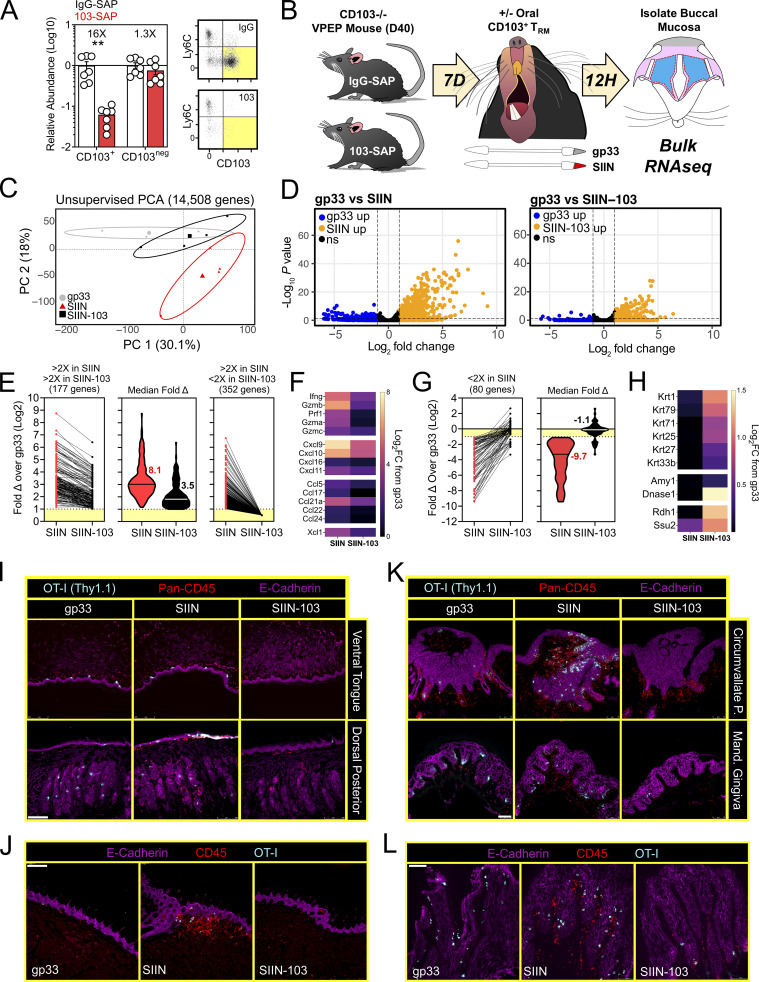
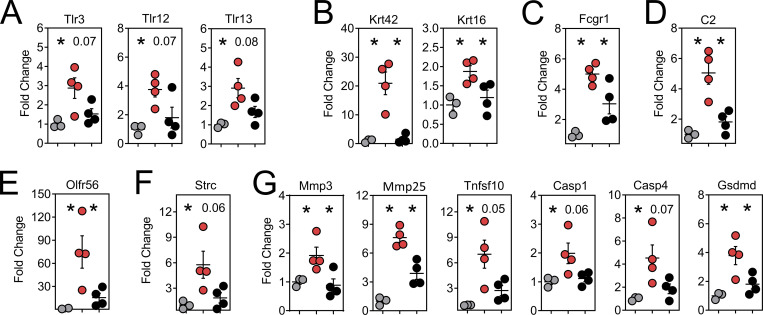
The oral mucosa is a frontline for microbial exposure and juxtaposes several unique tissues and mechanical structures. Based on parabiotic surgery of mice receiving systemic viral infections or co-housing with microbially diverse pet shop mice, we report that the oral mucosa harbors CD8+ CD103+ resident memory T cells (TRM), which locally survey tissues without recirculating. Oral antigen re-encounter during the effector phase of immune responses potentiated TRM establishment within tongue, gums, palate, and cheek. Upon reactivation, oral TRM triggered changes in somatosensory and innate immune gene expression. We developed in vivo methods for depleting CD103+ TRM while sparing CD103neg TRM and recirculating cells. This revealed that CD103+ TRM were responsible for inducing local gene expression changes. Oral TRM putatively protected against local viral infection. This study provides methods for generating, assessing, and in vivo depleting oral TRM, documents their distribution throughout the oral mucosa, and provides evidence that TRM confer protection and trigger responses in oral physiology and innate immunity.


Conflict of interest statement

Disclosures: The authors declare no competing interests exist.

Figures

None
Graphical abstract
Figure 1.
Figure 1.
TRM-phenotype cells populate the oral mucosa following systemic viral infections and contribute to local immunity. (A) Mice received 5 × 10⁴ congenically labeled P14 or OT-I T cells 1 d prior to systemic infection with LCMV-Arm or VSV-ova. Enumeration of Tg+ T cells in spleen (left) and oral tissue (right). Numbers above bars indicate replicates per group from two independent experiments. (B) Phenotype of Tg+ T cells in the oral mucosa following systemic LCMV-Arm or VSV-ova infection. Flow cytometry plots are concatenated from five mice from one of two independent experiments (gated on intravascular-staining negative Tg+ CD8+ T cells). (C) Left: Cartoon of mouse restraint for lingual infections. Right: Tongue viral titers 48 h after infection of the ventral lingual mucosa with VacV-ova in naive (black) vs. VSV-ova memory mice (blue). Dotted line represents limit of detection (40 PFU/tongue). (D) Experimental strategy and time course. Mice received two doses of FTY720 or vehicle control and were sacrificed (SAC) 48 h after lingual challenge with VacV-ova. (E) Left: Relative lymphocyte abundance in blood 48 h after treatment with vehicle control or FTY720. Right: VacV-ova viral titers in tongues of naive (black) or VSV-ova memory mice treated with either vehicle control (blue) or FTY720 (gray). Numbers indicate replicates per group from two independent experiments (N ≥ 4 mice/group/experiment). Error bars in A and B represent mean ± SEM. Data in C and D show median. All dots represent individual mice. **, P < 0.01; ****, P < 0.0001 as determined by an unpaired Student’s t test (A, B, and E; left) with an additional Mann–Whitney test (C) or Kruskal–Wallis multi-comparison test (E; right).
Figure 2.
Figure 2.
CD103+ memory CD8+ T cells in the oral mucosa are TRM. (A) Parabiosis strategy to determine the degree by which Tg+ T cells in the oral mucosa following systemic viral infections are resident. (B) Percent host among P14 T cells and OT-I T cells in the spleen and oral mucosa (comparing CD103neg vs. CD103+ subsets) following systemic LCMV-Arm (white) or VSV-ova (blue) infection. Numbers indicate parabiotic mice per group from at least two independent experiments. (C) Representative flow cytometry highlighting host vs. partner OT-I T cells among CD103neg Ly6Chi and CD103+ Ly6Clo CD8+ T cells within the oral mucosa of a Thy1.1+ VSV-ova immune parabiont. H = Host-derived cells, P = Partner-derived cells. (D) Representative histology of the ventral lingual mucosa from VSV-ova immune parabionts. Scale bar represents 75 µm. (E) Percent host among endogenous CD8+ T cells within spleen and oral mucosa (comparing CD103neg vs. CD103+ subsets) of parabiotic mice cohoused (purple; CoH) or exposed to the soiled bedding (gray; fomite) of pet shop mice for >60 d prior to surgery. Numbers represent individual parabiotic mice per group from cohoused or fomite-exposed parabiont cohorts analyzed on sperate days. (F) Left: Total i.v.neg OT-I T cells (left) and percentage of CD103+ CD69+ OT-I T cells isolated from the oral mucosa of VSV-ova immune mice housed under SPF conditions (orange) or cohoused with pet shop mice (purple) for >60 d. Middle: Enumeration of endogenous and TRM-phenotype CD8+ T cells in SPF vs. cohoused mice. Right: Enumeration of endogenous and TRM-phenotype CD4+ T cells in SPF vs. cohoused mice. Numbers in F indicate replicates per group from two independent experiments. In all graphs, error bars represent mean ± SEM. All dots represent individual mice. *, P < 0.05; ***, P < 0.001; ****, P < 0.0001 as determined by an unpaired Student’s t test between the relevant comparisons.
Figure 3.
Figure 3.
A VPEP strategy generates preternaturally abundant oral TRM. (A) VPEP approach. The oral surfaces are swabbed with SIIN peptide dissolved in fine dental pumice and contraceptive gel containing N-9. (B) Quantification of OT-I T cells in spleens and oral mucosa of mice given systemic VSV-ova alone (blue), VPEP (red; SIIN), or VPEP with irrelevant gp33 peptide (gray; gp33). Numbers above bars indicate replicates per group from three independent experiments (N ≥ 3 mice per group). (C) Percent host OT-I T cells in spleens and oral mucosa of VPEP parabionts 21 d after surgery (left). Right: Representative flow cytometry of CD8+ T cells isolated from the oral mucosa of a Thy1.1+ VPEP parabiont. Data represent two pairs of VPEP parabionts. (D) Enumeration (left) and percent CD103+ of Tg+ T cells (middle) in the oral mucosa in mice 1 mo after infection with systemic LCMV-Arm (white), systemic VSV-ova alone (blue), given VPEP (red circles), or given VPEP and aged an additional 10 mo (red squares). Right: Representative flow cytometry of oral OT-I T cells from VPEP mice infected 3 or 11 mo prior. (E) Left: Percentage of WT and TGFβRII−/− OT-I T cells expressing CD103 in the oral mucosa 4 and 24 d after VPEP (10 or 30 d after VSV-ova infection). Numbers indicate replicates per group from the two timepoints analyzed. Right: Representative flow cytometry plots. (F) Mice were infected with LCMV-Arm ± oral swabbing with relevant (gp33) or irrelevant (SIIN) peptide. Percentage of P14 T cells expressing CD103 is plotted. Numbers indicate replicates per group from three independent experiments (N ≥ 3 mice per group). (G) Enumeration of total i.v.neg OT-I T cells and CD103+ OT-I T cells from the indicated locations. Hashed line denotes the average number of CD103+ OT-I T cells isolated from the oral mucosa. Data are representative of five VPEP memory mice. SI LP, small intestine lamina propria; SI IEL, small intestine intraepithelial compartment; FRT, female reproductive tract; SG, salivary glands; OM, oral mucosa. (H) Heatmap showing expression patterns of several canonical TRM markers among total i.v.neg OT-I T cells isolated from the indicated tissues. (I) Representative histograms showing expression patterns of CD49a, CD69, Ly6C, and P2Rx7 among OT-I T cells isolated from the indicated tissues. In all graphs, error bars represent mean ± SEM. All dots represent individual mice. **, P < 0.01; ***, P < 0.001; ****, P < 0.0001 as determined by an unpaired Student’s t test between the relevant comparisons.
Figure S1.
Figure S1.
VPEP-established oral TRM are durably maintained following cohousing with pet shop mice. (A) Enumeration of OT-I T cells isolated from the indicated tissues of VPEP mice following >2 mo of cohousing (CoH) with pet shop mice. Data represent two independent experiments with N = 2–3 mice per experiment. (B) Representative flow cytometry plots concatenated from three mice from one of two independent experiments, highlighting phenotype of oral OT-I T cells in SPF vs. cohoused VPEP memory mice. (C) Left: Enumeration of total endogenous CD8+ T cells and percentage of endogenous CD8+ T cells expressing CD103 and CD69 in VPEP mice housed under SPF conditions (orange) or cohoused for >2 mo with pet shop mice (purple). Right: Enumeration of total endogenous CD4+ T cells and percentage of endogenous CD4+ T cells expressing CD103 and CD69 in VPEP mice housed under SPF conditions or cohoused for >2 mo. All dots represent individual mice. *, P < 0.05; **, P < 0.01 as determined by an unpaired Student’s t test between SPF and CoH groups.
Figure 4.
Figure 4.
Mouth TRM are broadly distributed and associated with taste buds. (A) Stepwise process for isolating murine oral tissues including tongue (T; green), palate (P; yellow), and buccal mucosa/gingiva (BM/G; blue). Lateral ovoid shapes in 1 represent the masseter muscles. (B) Individual oral tissues from N ≥ 4 VPEP mice pooled by tissue type into a single sample for flow cytometric analysis. Left: Average number of OT-I T cells recovered from the indicated tissue. Right: Percentage of OT-I T cells expressing CD103, and representative flow cytometry highlighting tongue and buccal mucosa. Data from three independent experiments are shown. (C) IF microscopy of (1) hard and soft palate, (2) tongue, (3) left and right buccal mucosa, and (4) gingiva from VPEP memory mice >90 d after infection. All scale bars represent 200 µm, except in 2 (tongue) where the scale bar represents 500 µm. (D) OT-I T cells associated with taste buds in the soft palate. Two separate examples are shown with scale bar representing 100 µm. Colors reflect staining panel in C. (E) IF microscopy of the circumvallate papillae. Scale bar denotes 100 µm. Arrowheads reflect location of OT-I T cells in VPEP memory mice. (F) Ce3D imaging of the soft palate showing OT-I T cells in close proximity to taste buds directly posterior to the eighth palatine ridge. Scale bar in top left panel depicts 200 µm and scale bar in Z-stacks represent 50 µm. (G) IF image of a whole decalcified mandible from a mouse that received VPEP >30 d prior. Inset highlights OT-I T cells within Wharton’s (submandibular) duct. Lingual muscles intentionally obscured to better visualize periodontium and salivary ducts. Scale bar represents 500 µm. (H) OT-I T cells within maxillary gingiva of VPEP memory mouse, with corresponding magnified images highlighting gingiva surrounding the maxillary second molar. Scale bars in left panel represent 500 µm. Arrowheads denote clusters of OT-I T cells. (I) Ce3D imaging of mandibular (left) and maxillary (right) gingiva showing the presence of OT-I T cells (green) established through VPEP. Analogous location in human mouth shown for mandibular gingiva example. Yellow line denotes mucogingival junction. Arrowhead denotes location of OT-I T cells. All images are representative of at least three histological sections, per indicated tissue location, per mouse, of three or more individual VPEP mice. Taste buds in D and F were identified based on location and crescent morphology.
Figure S2.
Figure S2.
VPEP-elicited OT-I T cells surveil taste buds of the soft palate, circumvallate papillae, and minor salivary glands and ducts in the buccal mucosa. (A) Immunofluorescence images of two separate soft palate taste buds located immediately distal to the eighth palatine ridge. Blue = nuclear, red = OT-I, pink = E-Cadherin. Scale bar represents 50 µm. Taste buds identified based on location and crescent morphology. Arrowheads denote location of OT-I T cells. (B) Ce3D imaging of OT-I T cells within the circumvallate papillae of a VPEP memory mouse. Scale bars in left and right panels represent 500 and 100 µm, respectively. Arrowhead denotes location of OT-I T cells. (C) Ce3D on isolated buccal mucosa >30 d after VPEP. Individual 2-D slices from overall 3-D structure are shown in all panels. (1) Entire cleared buccal mucosa slice, highlighting a minor salivary gland (bottom of image; 2) and a salivary duct (top of image; 3). Scale bar represents 500 µm. (2) Enlarged image of buccal mucosa minor salivary gland. Scale bar represents 100 µm. (3a–c) Magnified images of buccal mucosa salivary duct, showing three different images through the Z plane. Scale bar represents 100 µm. Arrowheads denote OT-I T cells. Ce3D images are representative of at least two VPEP memory mice in which Ce3D was performed.
Figure S3.
Figure S3.
VPEP-elicited OT-I T cells surveil the murine periodontium. (A) Lateral view of decalcified mandibula. Magnified images 1 and 3 are from the indicated locations, but from different tissue slices of the same tissue. (B) Aerial view of decalcified mandibular molar dental pulp in which OT-I T cells are present. L and R denote left and right second molars. Arrowheads denote location of OT-I T cells. Scale bars in A and B represent 100 µm.
Figure 5.
Figure 5.
Oral T cell antigen sensing bolsters cellular immunity in the mouth. (A) Experimental design. (B) Relative abundance of OT-I T cells and endogenous CD8+ T cells in spleens and oral mucosa of VPEP memory mice orally swabbed with gp33 (gray) or SIIN (red) 48 h earlier. Data represent fold change over the indicated phenotype in gp33 swabbed mice. Numbers indicate replicates per group from two independent experiments with ≥4 mice per group. (C) Experimental strategy to assess the ability of oral T cell reactivation to recruit circulating memory T cells into the oral mucosa. (D) Comparison of transferred P14 T cells and OT-I T cells abundance and phenotype in spleens of gp33- or SIIN-swabbed mice 48 h later. Concatenated flow cytometry plots are shown from one of two independent experiments (right). (E) IF imaging of buccal mucosa (top) and ventral lingual mucosa (bottom) from mice orally swabbed 48 h prior with P/N-9 or SIIN in irritants. (F) Higher magnification images of buccal mucosa 48 h after swabbing with P/N-9 or SIIN peptide. Nuclear and E-Cadherin staining removed from bottom panels to better visualize T cell aggregates. Images in E and F are representative of at least three sections, per tissue, per mouse, of six individual mice per group over two independent experiments. (G) Representative flow cytometry plots showing MHCII- and CD11c-expressing subsets in the cLNs of VPEP memory mice exposed 48 h prior to oral swabbing with P/N-9 or P/N-9 containing SIIN (left). CD86 expression among MHCII+ CD11c+ cLN DCs following the indicated treatment (right). (H) Quantification of total MHCII+ CD11c+ DCs (left) and those expressing CD86 (right). (I) Quantification of total MHCbright CD11c+ DCs (left) and those expressing CD86 (right). (J) Representative flow cytometry showing CD86 upregulation on cLN MHCIIbright CD11c+ DCs following the indicated treatment. (K) Enumeration of cLN macrophages (MHCIIint CD11cint) 48 h after oral swabbing with P/N-9 or P/N-9 containing SIIN. Data in G–K are representative of two independent experiments. Scale bars in E and F represents 100 µm. Dots in B, D, H, I, and K represent individual mice. *, P < 0.05; **, P < 0.01; ***, P < 0.001; ****, P < 0.0001 as determined by an unpaired Student’s t test between the relevant comparisons.
Figure 6.
Figure 6.
Oral TRM peptide reactivation triggers an oral inflammatory and antimicrobial state. (A) Buccal mucosa mRNA was isolated from untreated VPEP memory mice, or 12 h after swabbing with gp33 or SIIN peptide. (B) Unsupervised PCA plots showing clustering of No Tx (black), gp33 (gray), and SIIN (red) treatment groups. (C) Fold change of all significantly upregulated DEGs. (D) Volcano plots highlighting DEGs that are significantly (FDR P value <0.05) upregulated (>1log2 fold change; orange) or downregulated (<1log2 fold change; blue) between No Tx vs. gp33 (left) and gp33 vs. SIIN (right) treatment groups. N = 4 mice per group. (E) Gene Ontogeny (GO) enrichment analysis for genes upregulated (FDR P value <0.05) in SIIN- compared to gp33-treated buccal mucosa. (F) Log2 fold change (FC) of T cell effector molecule and chemokine genes comparing either gp33- or SIIN-swabbed mice to No Tx mice. (G) Immunofluorescence microscopy of buccal mucosa 8 h after swabbing with gp33 or SIIN peptide (top row). Two SIIN-swabbed mice are shown to portray heterogenous anatomic localization of CD45+ cell clusters upon oral TRM reactivation. Nuclear and E-Cadherin stains removed (middle, bottom). Bottom: Enlarged images with arrowheads highlighting OT-I T cells within inflammatory clusters. Scale bars represent 100 µm. Representative images are from at least three buccal mucosa sections, per mouse, of three or more individual mice per group. (H–L) Fold change in DEGs related to microbial sensing (H), keratin and mucus production (I), opsonization (J), neutrophil (PMN) degranulation and metal sequestration (K), and compliment activation and mucosal IgA secretion (L) in gp33-treated mice (gray) and SIIN-treated mice (red) relative to No Tx mice (white). Dots in H–L represent individual mice.
Figure S4.
Figure S4.
Oral T cell reactivation induces minor salivary gland inflammation. (A) VPEP memory mice were orally swabbed with gp33 or SIIN peptide and buccal mucosa was isolated 8 h later. A pronounced increase in OT-I T cells (teal) and pan-leukocytes (red) was observed within minor salivary glands exclusively in SIIN-treated buccal mucosa. Bottom row: Nuclear and E-Cadherin staining removed to better visualize OT-I T cell (CD45.1) and pan-leukocyte (CD45.2) infiltration. (B) Left: Relative abundance of CD103+ and CD103neg OT-I T cells isolated from major salivary glands of VPEP mice receiving a single treatment with IgG-SAP or 103-SAP 1 wk prior. Right: Representative flow cytometry. All dots represent individual mice, with N = 10–11 mice per group from three independent experiments. Numbers above bar graphs represent mean fold change between the relevant comparisons. **, P < 0.01 as determined by an unpaired Student’s t test.
Figure 7.
Figure 7.
Oral peptide reactivation triggers local gene expression changes related to olfaction, mucosal sensing, and bone resorption. Fold change in DEGs relative to untreated VPEP memory mice (No Tx; white), 12 h after swabbing with gp33 (gray) or SIIN (red) in irritants. (A–D) Highlighted are genes involved in olfaction (A), mucosal sensation (B), extracellular matrix degradation (C), and bone resorption/pyroptosis (D). In all graphs, differences between gp33 vs. SIIN treatment groups are significant (FDR P value <0.05 and >1log2 fold change), except Trpv2 (a noxious temperature sensor; denoted with $ in B) where differences between gp33 vs. SIIN groups showed FDR P value <0.05 and a 1.63 fold change. All dots represent individual mice.
Figure 8.
Figure 8.
CD103+ TRM mediate transcriptional changes in the oral mucosa upon antigen sensing. (A) Relative abundance (left) and representative flow cytometry (right) of CD103+ and CD103neg OT-I T cells from the oral mucosa of VPEP memory mice treated with SAP-IgG or SAP-103 antibodies. Data represent three independent experiments (N = 2–3 mice per group per experiment). Flow cytometry plots are concatenated from two mice per group from one experiment. (B) OT-I T cells were expanded through VPEP in CD103−/− hosts. Treatment groups included gp33, SIIN, and SIIN-103, with groups established based on OT-I T cell frequencies in blood. 12 h after swabbing, buccal mucosa was isolated, and bulk RNAseq was performed. (C) Unsupervised PCA plots showing clustering of gp33 (gray), SIIN (red), and SIIN-103 (black) treatment groups. (D) Volcano plots highlighting DEGs significantly (FDR P value <0.05) upregulated (>1log2 fold change [FC]; orange) or downregulated (<1log2 FC; blue) between gp33- vs. SIIN-treated buccal mucosa (left) or gp33- vs. SIIN-103–treated buccal mucosa (right). N = 3 (gp33) or 4 (SIIN, SIIN-103) mice per treatment group. (E) Fold change over gp33 of all significantly upregulated DEGs in SIIN mice and their corresponding relative expression in SIIN-103 mice. (F) Heatmaps showing Log2 fold change of select T cell effector molecule and chemokine genes significantly upregulated in SIIN mice relative to gp33-treated mice, and their corresponding expression levels upon CD103+ TRM depletion and SIIN swabbing. (G) Fold change over gp33 of all significantly downregulated DEGs in SIIN mice and their corresponding relative expression in SIIN-103 mice. (H) Heatmaps showing Log2 fold change of select keratin, digestion, and odontogenesis genes significantly downregulated in SIIN mice relative to gp33 treated mice, and their corresponding expression levels upon CD103+ TRM depletion and SIIN swabbing. (I) Representative tongue histology from gp33-, SIIN-, or SIIN-103–treated mice. Images acquired at 10× magnification. Scale bar represents 250 µm. (J) Additional representative tongue histology as in I. Scale bar represents 200 µm. (K) Representative histology of circumvallate papillae (top) and gingiva (bottom) from gp33-, SIIN-, or SIIN-103–treated mice as in J. Images acquired at 20× magnification. Scale bar represents 75 µm. (L) Additional higher magnification image of gingiva as in K. Scale bar denotes 100 µm. Representative images are from at least three sections, per tissue, per mouse, of three to four individual mice per group. Dots in A represent individual mice. **, P < 0.01 in A determined by an unpaired Student’s t test between SAP-IgG- vs. SAP-103–treated mice.
Figure S5.
Figure S5.
Genes related to microbial sensing, keratin production, opsonization, complement activation, and periodontitis induced upon oral TRM reactivation are blunted upon CD103+ TRM depletion. (A–G) Highlighted are genes for TLRs (A), keratin production (B), antibody-dependent cell-mediated cytotoxicity (C), complement (D), olfaction (E), steriocillin (F), and periodontitis (G). As in Fig. 8, gray circles represent gp33-treated animals, red circles represent SIIN-treated animals, black circles represent SIIN-103–treated animals. Differences between gp33 vs. SIIN and SIIN vs. SIIN-103 are all statistically significant (*, P < 0.05; as determined by a Student’s t test between the relevant comparisons) unless otherwise indicated, in which case P values are shown. Dots represent individual mice per group. N = 3 (gp33) or 4 (SIIN, SIIN-103) mice per treatment group.

Comment in

  • Guardians of the oral barriers.
    Buggert M. Buggert M. J Exp Med. 2023 Jul 3;220(7):e20230550. doi: 10.1084/jem.20230550. Epub 2023 May 15. J Exp Med. 2023. PMID: 37184540 Free PMC article.

Similar articles

Cited by

References

    1. Al-Majid, A., Alassiri S., Rathnayake N., Tervahartiala T., Gieselmann D.-R., and Sorsa T.. 2018. Matrix metalloproteinase-8 as an inflammatory and prevention biomarker in periodontal and peri-implant diseases. Int. J. Dent. 2018:7891323. 10.1155/2018/7891323 - DOI - PMC - PubMed
    1. Anderson, K.G., Mayer-Barber K., Sung H., Beura L., James B.R., Taylor J.J., Qunaj L., Griffith T.S., Vezys V., Barber D.L., and Masopust D.. 2014. Intravascular staining for discrimination of vascular and tissue leukocytes. Nat. Protoc. 9:209–222. 10.1038/nprot.2014.005 - DOI - PMC - PubMed
    1. Ariotti, S., Hogenbirk M.A., Dijkgraaf F.E., Visser L.L., Hoekstra M.E., Song J.-Y., Jacobs H., Haanen J.B., and Schumacher T.N.. 2014. T cell memory. Skin-resident memory CD8⁺ T cells trigger a state of tissue-wide pathogen alert. Science. 346:101–105. 10.1126/science.1254803 - DOI - PubMed
    1. Balaji, S., Cholan P.K., and Victor D.J.. 2021. An emphasis of T-cell subsets as regulators of periodontal health and disease. J. Clin. Transl. Res. 7:648–656. - PMC - PubMed
    1. Baller, J., Kono T., Herman A., and Zhang Y.. 2019. CHURP: A lightweight cli framework to enable novice users to analyze sequencing datasets in parallel. In. Proceedings of the Practice and Experience in Advanced Research Computing on Rise of theMachines (Learning), PEARC ’19. Association for Computing Machinery, New York, NY, USA. 1–5. 10.1145/3332186.3333156 - DOI

Publication types