. 2023 Jun 15;83(12):2066-2076.
doi: 10.1158/0008-5472.CAN-22-3755.

Prospective Analysis Reveals Associations between Carbohydrate Intakes, Genetic Predictors of Short-Chain Fatty Acid Synthesis, and Colorectal Cancer Risk

Affiliations

Prospective Analysis Reveals Associations between Carbohydrate Intakes, Genetic Predictors of Short-Chain Fatty Acid Synthesis, and Colorectal Cancer Risk

Cody Z Watling et al. Cancer Res. .

Abstract

Whole grain and fiber intakes may decrease the risk of colorectal cancer. The interplay between host genetic factors, colonization of specific bacteria, production of short-chain fatty acids (SCFA), and intake of whole grains and fiber could alter the protective role of carbohydrates against colorectal cancer. Here, we assessed intakes of types and sources of carbohydrates in 114,217 UK Biobank participants with detailed dietary data (2-5 24-hour dietary assessments), and a host polygenic score (PGS) was applied to categorize participants as high or low for intraluminal microbial SCFA production, namely, butyrate and propionate. Multivariable Cox proportional hazards models were used to determine the associations of carbohydrates and SCFA with colorectal cancer incidence. During a median follow-up of 9.4 years, 1,193 participants were diagnosed with colorectal cancer. Risk was inversely associated with intakes of non-free sugar and whole grain fiber. Evidence of heterogeneity was observed by the butyrate PGS; consuming higher amounts of whole grain starch was only associated with a lower risk of colorectal cancer in those with predicted high SCFA production. Similarly, in additional analyses utilizing the larger UK Biobank cohort (N = 343,621) with less detailed dietary assessment, only individuals with a high genetically predicted butyrate production had a lower risk of colorectal cancer per 5 g/day intake of bread and cereal fiber. This study suggests that colorectal cancer risk varies by intake of carbohydrate types and sources, and the impact of whole grain intake may be modified by SCFA production.

Significance: Prospective population-level analyses provide evidence supporting the importance of butyrate production in reduction of colorectal cancer risk by whole grain consumption.


Figures

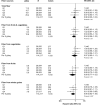
Figure 1. Multivariable-adjusted hazard ratios (95% CI) for colorectal cancer risk by the percentage of energy intake from carbohydrates, sugars, and starches. All models are stratified by sex, age at recruitment, and adjusted for region of recruitment, body mass index, height, physical activity, Townsend deprivation index, education, smoking, alcohol consumption, ethnicity, diabetes status, nonsteroidal anti-inflammatory drug use, red and processed meat intake, fruit and vegetables intake (except for non-free sugars), energy intake, and female-specific covariates: menopausal hormone therapy use, and menopausal status. g/day and percentage of energy from carbohydrate, sugars, and starch calculated as mean per day within each quartile. g/day, grams per day; N, number of participants; Q, quartile; ref, reference group.
Figure 1.
Multivariable-adjusted hazard ratios (95% CI) for colorectal cancer risk by the percentage of energy intake from carbohydrates, sugars, and starches. All models are stratified by sex, age at recruitment, and adjusted for region of recruitment, body mass index, height, physical activity, Townsend deprivation index, education, smoking, alcohol consumption, ethnicity, diabetes status, nonsteroidal anti-inflammatory drug use, red and processed meat intake, fruit and vegetables intake (except for non-free sugars), energy intake, and female-specific covariates: menopausal hormone therapy use, and menopausal status. g/day and percentage of energy from carbohydrate, sugars, and starch calculated as mean per day within each quartile. g/day, grams per day; N, number of participants; Q, quartile; ref, reference group.
Figure 2. Multivariable-adjusted hazard ratios (95% CI) for colorectal cancer risk by total fiber and fiber from various sources. All models are stratified by sex, age at recruitment, adjusted for region of recruitment, body mass index, height, physical activity, Townsend deprivation index, education, smoking, alcohol consumption, ethnicity, diabetes status, nonsteroidal anti-inflammatory drug use, red and processed meat intake, fruit and vegetable intake (except for total fiber, and fiber from fruits and/or vegetables), energy intake, and female-specific covariates: menopausal hormone therapy use and menopausal status. g/day of fiber calculated as mean intake per day within each quartile. g/day, grams per day; N, number of participants Q, quartile; ref, reference group.
Figure 2.
Multivariable-adjusted hazard ratios (95% CI) for colorectal cancer risk by total fiber and fiber from various sources. All models are stratified by sex, age at recruitment, adjusted for region of recruitment, body mass index, height, physical activity, Townsend deprivation index, education, smoking, alcohol consumption, ethnicity, diabetes status, nonsteroidal anti-inflammatory drug use, red and processed meat intake, fruit and vegetable intake (except for total fiber, and fiber from fruits and/or vegetables), energy intake, and female-specific covariates: menopausal hormone therapy use and menopausal status. g/day of fiber calculated as mean intake per day within each quartile. g/day, grams per day; N, number of participants Q, quartile; ref, reference group.
Figure 3. Multivariable-adjusted hazard ratios (95% CI) for intake of carbohydrates and fiber and colorectal cancer risk separated by genetically predicted host short-chain fatty acid production for butyrate (A) and propionate (n = 87,417; B). All models are stratified by sex, age at recruitment, adjusted for region of recruitment, first 10 genetic principal components, body mass index, height, physical activity, Townsend deprivation index, education, smoking, alcohol consumption, diabetes status, nonsteroidal anti-inflammatory drug use, red and processed meat intake, fruit and vegetable intake (except when fiber from vegetables and/or fruits, and non-free sugar intake was the exposure), energy intake, and female-specific covariates: menopausal hormone therapy use and menopausal status. Analyses are restricted to white British participants. χ2 and P value represents improvement of fit obtained from likelihood ratio tests for including an interaction term between butyrate or propionate polygenic score and carbohydrate type/source (modeled as a 5% energy increment) or fiber source (modeled as a 5 gram/day increment) into the model.
Figure 3.
Multivariable-adjusted hazard ratios (95% CI) for intake of carbohydrates and fiber and colorectal cancer risk separated by genetically predicted host short-chain fatty acid production for butyrate (A) and propionate (n = 87,417; B). All models are stratified by sex, age at recruitment, adjusted for region of recruitment, first 10 genetic principal components, body mass index, height, physical activity, Townsend deprivation index, education, smoking, alcohol consumption, diabetes status, nonsteroidal anti-inflammatory drug use, red and processed meat intake, fruit and vegetable intake (except when fiber from vegetables and/or fruits, and non-free sugar intake was the exposure), energy intake, and female-specific covariates: menopausal hormone therapy use and menopausal status. Analyses are restricted to white British participants. χ2 and P value represents improvement of fit obtained from likelihood ratio tests for including an interaction term between butyrate or propionate polygenic score and carbohydrate type/source (modeled as a 5% energy increment) or fiber source (modeled as a 5 gram/day increment) into the model.
Figure 4. Multivariable-adjusted hazard ratios (95% CI) for intake of fiber from breads and cereals from the touchscreen questionnaire and colorectal cancer risk by genetically predicted host short-chain fatty acid production for butyrate (A) and propionate (n = 343,621; B). Models stratified for sex and age at recruitment, and further adjusted for region, first 10 principal components, height, physical activity, Townsend deprivation index, education, employment, smoking, alcohol consumption measured at recruitment, diabetes status, nonsteroidal anti-inflammatory drug use, body mass index, processed and red meat intake, and female-specific covariates: menopausal hormone therapy use and menopausal status. Analyses are restricted to white British participants. χ2 and P value represents improvement of fit obtained from likelihood ratio tests for including an interaction term between butyrate or propionate polygenic score and fiber from breads and cereals (modeled as a 5 gram/day increment) into the model. g/day, grams per day; N, number of participants; Q, quintile; ref, reference group.
Figure 4.
Multivariable-adjusted hazard ratios (95% CI) for intake of fiber from breads and cereals from the touchscreen questionnaire and colorectal cancer risk by genetically predicted host short-chain fatty acid production for butyrate (A) and propionate (n = 343,621; B). Models stratified for sex and age at recruitment, and further adjusted for region, first 10 principal components, height, physical activity, Townsend deprivation index, education, employment, smoking, alcohol consumption measured at recruitment, diabetes status, nonsteroidal anti-inflammatory drug use, body mass index, processed and red meat intake, and female-specific covariates: menopausal hormone therapy use and menopausal status. Analyses are restricted to white British participants. χ2 and P value represents improvement of fit obtained from likelihood ratio tests for including an interaction term between butyrate or propionate polygenic score and fiber from breads and cereals (modeled as a 5 gram/day increment) into the model. g/day, grams per day; N, number of participants; Q, quintile; ref, reference group.

References

    1. Sung H, Ferlay J, Siegel RL, Laversanne M, Soerjomataram I, Jemal A, et al. . Global cancer statistics 2020: GLOBOCAN estimates of incidence and mortality worldwide for 36 cancers in 185 countries. CA Cancer J Clin 2021;71:209–49. - PubMed
    1. World Cancer Research Fund/American Institute for Cancer Research. Continuous Update Project Expert Report. Diet, nutrition, physical activity and colorectal cancer. 2018.
    1. Bouvard V, Loomis D, Guyton KZ, Grosse Y, Ghissassi FE, Benbrahim-Tallaa L, et al. . Carcinogenicity of consumption of red and processed meat. Lancet Onc 2015;16:1599–600. - PubMed
    1. World Cancer Research Fund International Systematic Literature Review. The associations between food, nutrition and physical activity and the risk of colorectal cancer. 2017. https://www.wcrf.org/wp-content/uploads/2021/02/colorectal-cancer-slr.pdf.
    1. So D, Whelan K, Rossi M, Morrison M, Holtmann G, Kelly JT, et al. . Dietary fiber intervention on gut microbiota composition in healthy adults: a systematic review and meta-analysis. Am J Clin Nutr 2018;107:965–83. - PubMed

Publication types