. 2023 Jul;10(19):e2301107.
doi: 10.1002/advs.202301107. Epub 2023 Apr 25.

Ultrasound Responsive Nanovaccine Armed with Engineered Cancer Cell Membrane and RNA to Prevent Foreseeable Metastasis

Affiliations

Ultrasound Responsive Nanovaccine Armed with Engineered Cancer Cell Membrane and RNA to Prevent Foreseeable Metastasis

Wenqi Sun et al. Adv Sci (Weinh). 2023 Jul.

Abstract

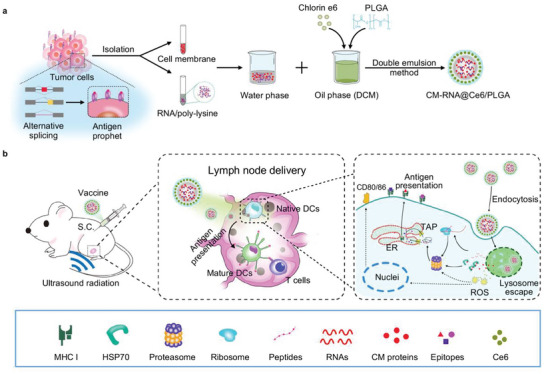
Cancer vaccine has been considered as a promising immunotherapy by inducing specific anti-tumor immune response. Rational vaccination at suitable time to efficiently present tumor associated antigen will boost tumor immunity and is badly needed. Here, a poly (lactic-co-glycolic acid) (PLGA)-based cancer vaccine of nanoscale is designed, in which engineered tumor cell membrane proteins, mRNAs, and sonosensitizer chlorin e6 (Ce6) are encapsulated at high efficiency. The nanosized vaccine can be efficiently delivered into antigen presentation cells (APCs) in lymph nodes after subcutaneous injection. In the APCs, the encapsulated cell membrane and RNA from engineered cells, which have disturbed splicing resembling the metastatic cells, provide neoantigens of metastatic cancer in advance. Moreover, the sonosensitizer Ce6 together with ultrasound irradiation promotes mRNA escape from endosome, and augments antigen presentation. Through 4T1 syngeneic mouse model, it has been proved that the proposed nanovaccine is efficient to elicit antitumor immunity and thus prevent cancer metastasis.

Keywords: alternative splicing; antigen presentation; cancer vaccine; sonosensitizer.


Conflict of interest statement

The authors declare no conflict of interest.

Figures

Scheme 1
Scheme 1
a) Schematic illustration showing the preparation steps of cancer vaccine. b) Schematic of vaccine delivery in lymph node and intercellular antigen presentation.
Figure 1
Figure 1
Preparation and characterization of fabricated nanoparticles. a) Schematic illustration showing the procedure of cell membrane and RNA and cancer vaccine preparation with double emulsion method. b) TEM image of Blank@PLGA, CM@Ce6/PLGA, RNA@Ce6/PLGA, and CM‐RNA@Ce6/PLGA. Scale bar = 200 nm. c) Size distribution of Blank@PLGA, CM@Ce6/PLGA, RNA@Ce6/PLGA, and CM‐RNA@Ce6/PLGA. d) Zeta potential of Blank@PLGA, CM@Ce6/PLGA, RNA@Ce6/PLGA, and CM‐RNA@Ce6/PLGA. n = 3. e) qPCR analysis of Gapdh expression in lysates of Blank@PLGA, CM@Ce6/PLGA, RNA@Ce6/PLGA, and CM‐RNA@Ce6/PLGA. n = 3. f) The protein encapsulation efficiency of Blank@PLGA, CM@Ce6/PLGA, RNA@Ce6/PLGA, and CM‐RNA@Ce6/PLGA measured by BCA assay. n = 3. Data are represented by mean ± SEM of three replicates. Statistical significance was determined by one‐way ANOVA with Tukey's post hoc test. ***p < 0.001, ****p < 0.0001. ns, not significant.
Figure 2
Figure 2
In vitro and in vivo delivery of the fabricated nanoparticles. a) Schematic showing the preparation of DiO and DiR labeled nanoparticles and animal experiment procedures. b) Representative confocal microscope images of the distribution of DiO labeled nanoparticles in the lymph nodes and other main organs 12 h after subcutaneous injection. n = 3. Scale bar = 200 µm. c) Fluorescent statistics of (b). d) Representative IVIS analysis of the distribution of DiR labeled nanoparticles in lymph nodes and other main organs 12 h after subcutaneous injection. n = 3. Scale bar = 1 cm. e) Fluorescent statistics of (d). f) Schematic showing the cell uptake experiment. g) Confocal fluorescence images showing the uptake of nanoparticles by DCs. Cell nuclei were stained with Hoechst 33342 (blue), and cytoskeletons were stained with Actin‐Tracker Green (green). Scale bar = 20 µm. Data shown are representative images of three different experiments. Statistical significance was determined by two‐way ANOVA with Tukey's post hoc test. ****p < 0.0001. ns, not significant.
Figure 3
Figure 3
Ultrasound irradiation promotes endosome/lysosome escape and enhances antigen presentation associated factors. a) Confocal microscope images of colocalization of CM‐RNA@Ce6/PLGA and DCs. The lysosomes were stained with Lyso‐Tracker Green, and nuclei were stained with Hoechst 33342. Scale bar = 25 µm. b) Schematic of Luci‐RNA@Ce6/PLGA preparation. c) Luciferase activity in cells treated as indicated. n = 3. d) Confocal microscope images of ROS generated in DCs. ROS was stained with DCFH‐DA, and nuclei were stained with Hoechst 33342. Scale bar = 50 µm. e) Western blot analysis of HSP70 expression in DCs treated as indicated. GAPDH served as internal control. f) Statistics of Western blot data. n = 3. g) mRNA expression tested by qPCR. n = 3. Data are represented by mean ± SEM. Statistical significance was determined by one‐way ANOVA with Tukey's post hoc test. *p < 0.05, **p < 0.01, ***p < 0.001, ****p < 0.0001. ns, not significant.
Figure 4
Figure 4
Ultrasound irradiation boosts DCs maturation and antigen presentation. a) Schematic depicting OVA CM‐RNA@Ce6/PLGA preparation. b) Schematic diagram showing the experimental procedure of DCs maturation analysis. c) Representative flow cytometry data showing the antigen presentation analysis. n = 3. d) Statistics of (c). e) Schematic diagram showing the antigen presentation analysis. f) Representative flow cytometry data of SIINFEKL peptide presented by DCs. n = 3. g) Statistics of (f). Data are represented by mean ± SEM. Statistical significance was determined by one‐way ANOVA with Tukey's post hoc test. **p < 0.01, ***p < 0.001, ****p < 0.0001.
Figure 5
Figure 5
Inhibition of tumor growth by cancer vaccine. a) Schematic illustration showing the vaccination schedule and tumor challenge. b) Growth curves for 4T1 tumors on mice after immunity by different nanovaccines. n = 6. Statistical significance was determined by two‐way ANOVA with Tukey's post hoc test. c) The tumor weight in different groups. n = 6. d) Flow cytometry data showing the infiltrating CTLs at the tumor tissues with different treatments. e) Immunofluorescent staining of indicated markers in tumor tissues with different treatments. n = 6. f) Statistics of (e). Data are represented by mean ± SEM. Statistical significance was determined by one‐way ANOVA with Tukey's post hoc test. **p < 0.01, ***p < 0.001, ****p < 0.0001.
Figure 6
Figure 6
SRSF1 promotes cancer cell migration and enhances immunogenicity. a) Representative images of wound healing assay. n = 3. b) Statistics of (a). c) Flow cytometry analysis of infiltrating CTL in tumors. n = 3. d) Statistics of (c). e) Representative immunofluorescent images showing the CD3+CD4+, CD3+CD8+, and CD4+Foxp3+ cells in tumor tissues. n = 3. f) Statistics of (e). g) Representative RNA‐seq read coverage illustrating images of specific genes. Data are represented by mean ± SEM. Statistical significance was determined by Student's t‐test. ***p < 0.001, ****p < 0.0001.
Figure 7
Figure 7
Inhibition of tumor growth and metastasis by Srsf1‐vaccine. a) Schematic illustration of Srsf1‐vaccine preparation and experimental design. b) Tumor growth cures of different groups with indicated treatments. n = 6. Statistical significance was determined by two‐way ANOVA with Tukey's post hoc test. c) Tumor weight in mice. n = 6. d) Flow cytometry analysis of infiltrating CTLs in tumors by flow cytometry. e) Representative immunofluorescent analysis of CD3+CD4+, CD3+CD8+, and CD4+Foxp3+ cells tumor tissues treated as indicated. n = 6. f) Statistics of (e). g) Representative images of metastasis of lungs. n = 6. h) Statistics of (g). Data are represented by mean ± SEM. Statistical significance was determined by one‐way ANOVA with Tukey's post hoc test. *p < 0.05, **p < 0.01, ***p < 0.001, ****p < 0.0001.
Figure 8
Figure 8
Inhibition of tumor growth and metastasis by PlaB‐vaccine. a) Schematic illustration of PlaB‐vaccine preparation and experimental design. b) Tumor growth cures of different groups with indicated treatments. n = 6. Statistical significance was determined by two‐way ANOVA with Tukey's post hoc test. c) Tumor weight in mice. n = 6. d) Flow cytometry analysis of infiltrating CTLs in tumors treated same as above. e) Representative immunofluorescent analysis of CD3+CD4+, CD3+CD8+, and CD4+Foxp3+ cells in tumor tissues treated as indicated. n = 6. f) Statistics of (e). g) Representative images of metastasis of lungs. n = 6. h) Statistics of (g). Data are represented by mean ± SEM. Statistical significance was determined by one‐way ANOVA with Tukey's post hoc test. *p < 0.05, **p < 0.01, ***p < 0.001, ****p < 0.0001.

Similar articles

Cited by

References

    1. Liu J., Fu M., Wang M., Wan D., Wei Y., Wei X., J. Hematol. Oncol. 2022, 15, 28. - PMC - PubMed
    1. Lin M. J., Svensson‐Arvelund J., Lubitz G. S., Marabelle A., Melero I., Brown B. D., Brody J. D., Nat Cancer 2022, 3, 911. - PubMed
    1. Enokida T., Moreira A., Bhardwaj N., J. Clin. Invest. 2021, 131, e146956. - PMC - PubMed
    1. Finn O. J., Nat. Rev. Immunol. 2003, 3, 630. - PubMed
    1. Saxena M., van der Burg S. H., Melief C. J. M., Bhardwaj N., Nat. Rev. Cancer 2021, 21, 360. - PubMed

Publication types