. 2023 Jun 8;8(11):e165373.
doi: 10.1172/jci.insight.165373.

MOGAD patient autoantibodies induce complement, phagocytosis, and cellular cytotoxicity

Affiliations

MOGAD patient autoantibodies induce complement, phagocytosis, and cellular cytotoxicity

Soumya S Yandamuri et al. JCI Insight. .

Abstract

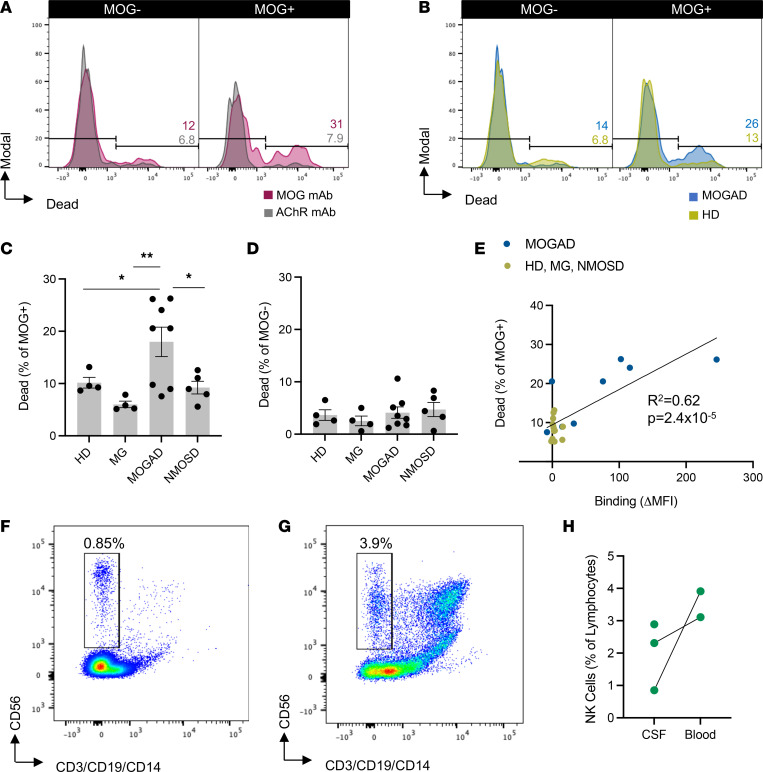
Myelin oligodendrocyte glycoprotein (MOG) antibody-associated disease (MOGAD) is an inflammatory demyelinating CNS condition characterized by the presence of MOG autoantibodies. We sought to investigate whether human MOG autoantibodies are capable of mediating damage to MOG-expressing cells through multiple mechanisms. We developed high-throughput assays to measure complement activity (CA), complement-dependent cytotoxicity (CDC), antibody-dependent cellular phagocytosis (ADCP), and antibody-dependent cellular cytotoxicity (ADCC) of live MOG-expressing cells. MOGAD patient sera effectively mediate all of these effector functions. Our collective analyses reveal that (a) cytotoxicity is not incumbent on MOG autoantibody quantity alone; (b) engagement of effector functions by MOGAD patient serum is bimodal, with some sera exhibiting cytotoxic capacity while others did not; (c) the magnitude of CDC and ADCP is elevated closer to relapse, while MOG-IgG binding is not; and (d) all IgG subclasses can damage MOG-expressing cells. Histopathology from a representative MOGAD case revealed congruence between lesion histology and serum CDC and ADCP, and we identified NK cells, mediators of ADCC, in the cerebrospinal fluid of relapsing patients with MOGAD. Thus, MOGAD-derived autoantibodies are cytotoxic to MOG-expressing cells through multiple mechanisms, and assays quantifying CDC and ADCP may prove to be effective tools for predicting risk of future relapses.

Keywords: Autoimmune diseases; Autoimmunity; Demyelinating disorders; Neurological disorders; Neuroscience.


Conflict of interest statement

Conflict of interest: KCO has received research support from Alexion (part of AstraZeneca), Viela Bio (part of Horizon Therapeutics), Cabaletta Bio, and argenx. KCO is a consultant and equity shareholder of Cabaletta Bio. KCO has served as consultant/advisor for Alexion and Roche. EEL receives research support from Genentech and has served as a consultant for Genentech, Janssen, TG Therapeutics, NGM Bio, EMD Serono, Genzyme, and Bristol Myers Squibb. JMT receives royalties from Alexion and is a consultant for Q32 Bio, a company developing complement inhibitors. He holds stock in and will receive royalty income from Q32 Bio. RJN has received consultancy fees from Alexion, argenx, CSL Behring, Grifols, Immunovant, Momenta (part of Janssen), Ra Pharmaceuticals (part of UCB), and Viela Bio. CFL may accrue revenue for a patent (no. 7101679) regarding aquaporin-4–associated antibodies for diagnosis of neuromyelitis optica and receives research support from the National MS Society, Biogen, and NIH. EPF has served on advisory boards for Alexion, Genentech, Horizon Therapeutics, and UCB. He has received research support from UCB. He has received speaker honoraria from Pharmacy Times. He received royalties from UpToDate. EPF is a member of the medical advisory board of the MOG project. EPF is an editorial board member of the Journal of the Neurological Sciences and Neuroimmunology Reports. A patent (patent application no. Patent Application #:PCT/US2022/079874) has been submitted on DACH1-IgG as a biomarker of paraneoplastic autoimmunity.

Figures

Figure 1
Figure 1. MOG IgG1 mAb induces CDC and ADCP of live MOG-expressing cells in vitro.
(A) Schematic of CDC and ADCP assays utilizing live HEK cells partially transfected with full-length human MOG-GFP, incubated with 1 μg/mL MOG or control AChR mAbs, followed by the addition of NHS for CDC or macrophages for ADCP induction. MAC formation and cell death for CDC and phagocytosis and loss of MOG+ cells for ADCP were quantified by flow cytometry. (B and C) Contour plots depict (B) MAC formation and (C) death of HEK cells based on MOG expression upon incubation with MOG versus AChR mAbs in the CDC assay. (D and E) Macrophage phagocytosis of MOG+ cells is shown by (D) dot plots depicting the frequency of GFP+ macrophages, and (E) histograms of MOG+ cells out of the total HEK cell population, upon incubation with MOG versus AChR mAbs in the ADCP assay. (F and G) Histograms show (F) MAC formation and (G) death of MOG versus MOG+ HEK cells upon incubation with MOG versus AChR mAbs in the CDC assay. All graphs are representative. Each experiment was performed at least 3 times in duplicate. Frequencies of indicated gates depicted on plots.
Figure 2
Figure 2. MOG IgG1 and IgG3 induce CDC while all IgG subclasses induce ADCP.
The MOG mAb variable region was subcloned into Fc vectors to recombinantly produce MOG IgG1, IgG2, IgG3, IgG4, and Fc mutant (FcMt) mAbs. (A) Sandwich ELISAs indicate binding of MOG IgG1, IgG2, IgG3, and IgG4 mAbs at 10 μg/mL to commensurate subclass-specific antibodies. Serial dilutions of the 4 MOG subclass mAbs, the MOG FcMt mAb, and the AChR IgG1 mAb were tested for MOG binding and effector functions. (B) MAb binding to MOG was quantified as ΔMFI using a live flow cytometry MOG-CBA. (CF) MAC formation and death of (C and D) MOG+ and (E and F) MOG cells in the CDC assay. (G and H) Phagocytosis and MOG+ cells out of total HEK cells in the ADCP assay. Each experiment was performed at least 2 times in duplicate. In BH, each dot represents the average of duplicates.
Figure 3
Figure 3. MOGAD patient serum induces CDC and ADCP of live MOG-expressing cells while HD, MG, and NMOSD serum do not.(A–L)
HI serum from patients with MOGAD (nCDC = 17, nADCP = 19), MG (nCDC = 13, nADCP = 12), and NMOSD (nCDC = 15, nADCP = 10) and HD (nCDC = 11, nADCP = 7) were evaluated for CDC (AI) and ADCP induction (JL), normalized to that of media alone (no antibodies or donor serum). (A) Representative histograms depict MAC deposition on MOG+ cells by MOGAD versus HD serum in the CDC assay. (B and C) Comparative MAC formation on (B) MOG+ and (C) MOG cells by condition. (D) Representative histogram depicts dead MOG+ cells by MOGAD versus HD serum. (E and F) Comparative dead (E) MOG+ and (F) MOG cells by condition. (G) Resultant frequency of MOG+ cells out of total HEK cells. (H) Comparison of frequency of MAC formation versus death of MOG+ cells per sample. (I) Linear regression of MOGAD samples only (goodness of fit, R2, and significance of nonzero slope, P value, shown on graph). (J) Representative dot plot depicts frequency of phagocytosing macrophages (GFP+) upon incubation with MOGAD versus HD serum in ADCP assay. (K and L) Frequency of (K) phagocytosing macrophages and (L) MOG+ cells out of total HEK cells by condition. Each dot represents a patient (average of duplicates), normalized to media-only control, and bars depict mean ± SEM. Normality test followed by Kruskal-Wallis for B (P = 2.3 × 10⁻⁴), C (P = 0.22), E (P = 5.6 × 10⁻³), and K (P = 1.4 × 10⁻⁵) and 1-way ANOVA for G (P = 1.2 × 10⁻⁵) and L (P = 1.1 × 10⁻⁵). For P ≤ 0.05, multiple comparisons were corrected with FDR of 0.05 and depicted on graph (*P ≤ 0.05, **P ≤ 0.01, ***P ≤ 0.005, #P ≤ 0.0005, ##P ≤ 0.0001, ###P ≤ 0.00005, +P ≤ 0.00001).
Figure 4
Figure 4. Neuropathology in frontal lobe biopsy of patient with MOGAD with paired serum effector functions.
Right frontal lobe biopsy was undertaken in a symptomatic patient with MOGAD based on MRI findings. (AC) Histology was performed and indicated active demyelinating lesions with loss of (A) MAG, (B) MOG, and (C) PLP. (D and E) Complement deposition in lesions indicated by (D) C9neo (red), with higher magnification on right (E). (F and G) CD68+ (brown) macrophage/microglia infiltration detected in lesions and (G) macrophages appear foamy and myelin-laden upon higher magnification of MOG staining. Scale bar: 500 μm (AD and F) and 50 μm (E and G). (H) The patient’s serum was collected at 4 time points: during relapse (MOG t1), 2 days thereafter (MOG t2), and twice during remission (MOG t3, t4). The serum was tested for MOG binding IgG in comparison to serum from 4 HD in a live MOG-CBA. These samples were then tested for induction of CDC and ADCP effector functions. (IL) Resultant (I) MAC formation and (J) dead MOG+ cells in CDC assay and (K) phagocytosis and (L) MOG+ out of total HEK cells in ADCP assay. Experiments shown in HL were performed in duplicate, shown as dots, with bar showing their mean.
Figure 5
Figure 5. Magnitude of effector functions is associated with MOG-binding IgG in serum.
A live MOG-CBA was used to quantify serum MOG-binding IgG and compared with CDC and ADCP induction of HI serum from patients with MOGAD (nCDC = 17, nADCP = 19), MG (nCDC = 13, nADCP = 12), and NMOSD (nCDC = 15, nADCP = 10) and HD (nCDC = 11, nADCP = 7). (A and B) MAC deposition and dead MOG+ cells upon CDC assay versus binding to MOG, fit with Gompertz model. (C) Frequency of MOG+ cells out of total HEK cells upon CDC assay versus binding to MOG, fit with linear regression model. (D and E) Phagocytosing macrophages and frequency of MOG+ cells out of total HEK cells upon ADCP assay versus binding to MOG, fit with linear regression model. Each dot represents a patient (average of duplicates). Gompertz models show 95% CI indicated by dotted lines. All models show goodness of fit, R2, on graph. Linear models show significance of nonzero slope, P value, on graph.
Figure 6
Figure 6. Effector functions better correlate with relapse than do the quantity of MOG-IgG.
Regression models were used to assess associations between proximity to relapse and magnitude of CDC, ADCP, and IgG binding to MOG per MOGAD serum sample (nCDC = 15, nADCP = 18). (A and B) MAC formation and dead MOG+ cells in CDC assay plotted against days from relapse and fit with exponential decay model (95% CI indicated by dotted lines; goodness of fit, R2, shown on graphs). (C and D) MAC formation and dead MOG+ cells in CDC assay. (E) MOG-IgG binding compared with days from relapse and fit with linear model. (F and G) Phagocytosing macrophages and percent MOG+ cells out of total HEK cells measured in the ADCP assay. (H) MOG-IgG binding plotted against days from relapse and fit with linear model. Each dot represents a patient (average of duplicates). For linear models, goodness of fit, R2, and significance of nonzero slope, P value, are shown on graph.
Figure 7
Figure 7. MOGAD patient serum induces CA on live MOG-expressing cells.
The CA assay utilizes C8-depleted NHS as the complement source to prevent MAC formation and CDC. Thus, C3d deposition can be monitored without loss of MOG+ cells. (A) Histograms depict C3d deposition on MOG+ cells in the presence of 1 μg/mL MOG mAb in comparison with AChR mAb. Each experiment was performed at least twice in duplicate. Frequencies of indicated gates depicted on plots. (B) Representative histograms depict C3d+MOG+ cells by MOGAD versus HD HI serum. (C and D) Comparative C3d deposition on (C) MOG+ and (D) MOG cells by HI serum from patients with MOGAD (nCDC = 17), MG (nCDC = 13), and NMOSD (nCDC = 15) and HD (nCDC = 11). Each dot represents a patient (average of duplicates), normalized to media-only control, and bars depict mean ± SEM. Normality test followed by 1-way ANOVA for C (P = 1.2 × 10⁻³) and D (P = 0.12). For P ≤ 0.05, multiple comparisons were corrected with FDR of 0.05 and depicted on graph (**P ≤ 0.01, ****P ≤ 0.001). (E) C3d+MOG+ cells upon CA assay versus binding to MOG, fit with Gompertz model (95% cCI indicated by dotted lines; goodness of fit, R2, shown on graph). (F and G) C3d deposition on MOG+ cells in CA assay plotted against days from relapse for MOGAD samples (nCDC = 15) and fit with (F) linear model and (G) exponential decay model (goodness of fit, R2, shown on graphs; significance of nonzero slope, P value, is shown for linear model).
Figure 8
Figure 8. MOGAD patient serum induces ADCC of live MOG-expressing cells.
The ADCC assay was performed similarly to the ADCP assay with pooled HD NK cells to mediate cytotoxicity rather than macrophages for phagocytosis. A live/dead stain was used to identify killed HEK cells. (A) Histograms depict dead MOG and MOG+ cells with 1 μg/mL MOG versus AChR mAb in the ADCC assay. Each experiment was performed at least 3 times in duplicate. Frequencies of indicated gates depicted on plots. (B) Representative histograms depict dead MOG and MOG+ cells by HI MOGAD versus HD serum. (C and D) Comparative ADCC of (C) MOG+ and (D) MOG cells by HI serum from patients with MOGAD (nADCC = 8), MG (nADCC = 4), and NMOSD (nADCC = 5) and HD (nADCC = 4). Each dot represents a patient (average of duplicates), and bars depict mean ± SEM. Normality test followed by 1-way ANOVA for C (P = 0.0075) and D (P = 0.68). For P ≤ 0.05, multiple comparisons were corrected with FDR of 0.05 and depicted on graph (*P ≤ 0.05, **P ≤ 0.01). (E) Frequency of MOG+ cells out of total HEK in the ADCC assay versus IgG binding to MOG, fit with linear regression model (goodness of fit, R2, and significance of nonzero slope, P value, shown on graph). Flow cytometry was then used to identify the presence of NK cells (CD56+CD3CD19CD14 lymphocytes) in the CSF of 3 relapsing patients with MOGAD. (F and G) Representative gating of NK cells out of lymphocytes in (F) CSF and (G) blood from 1 patient. (H) Frequency of NK cells out of lymphocytes in CSF versus blood in patients with MOGAD.

References

    1. Banwell B, et al. Diagnosis of myelin oligodendrocyte glycoprotein antibody-associated disease: international MOGAD panel proposed criteria. Lancet Neurol. 2023;22(3):268–282. doi: 10.1016/S1474-4422(22)00431-8. - DOI - PubMed
    1. Narayan R, et al. MOG antibody disease: a review of MOG antibody seropositive neuromyelitis optica spectrum disorder. Mult Scler Relat Disord. 2018;25:66–72. doi: 10.1016/j.msard.2018.07.025. - DOI - PubMed
    1. Reindl M, Waters P. Myelin oligodendrocyte glycoprotein antibodies in neurological disease. Nat Rev Neurol. 2019;15(2):89–102. doi: 10.1038/s41582-018-0112-x. - DOI - PubMed
    1. O’Connor KC, et al. Self-antigen tetramers discriminate between myelin autoantibodies to native or denatured protein. Nat Med. 2007;13(2):211–217. doi: 10.1038/nm1488. - DOI - PMC - PubMed
    1. Hamid SHM, et al. What proportion of AQP4-IgG-negative NMO spectrum disorder patients are MOG-IgG positive? A cross sectional study of 132 patients. J Neurol. 2017;264(10):2088–2094. doi: 10.1007/s00415-017-8596-7. - DOI - PMC - PubMed

Publication types