Myopia Control Dose Delivered to Treated Eyes by a Dual-focus Myopia-control Contact Lens
- PMID: 37097975
- PMCID: PMC10317304
- DOI: 10.1097/OPX.0000000000002021
Myopia Control Dose Delivered to Treated Eyes by a Dual-focus Myopia-control Contact Lens
Abstract
Purpose: This study examined the optical impact of a DF contact lens during near viewing in a sample of habitual DF lens wearing children.
Methods: Seventeen myopic children aged 14 to 18 years who had completed 3 or 6 years of treatment with a DF contact lens (MiSight 1 Day; CooperVision, Inc., San Ramon, CA) were recruited and fit bilaterally with the DF and a single-vision (Proclear 1 Day; CooperVision, Inc.) contact lens. Right eye wavefronts were measured using a pyramidal aberrometer (Osiris; CSO, Florence, Italy) while children accommodated binocularly to high-contrast letter stimuli at five target vergences. Wavefront error data were used to compute pupil maps of refractive state.
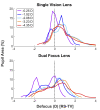
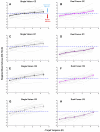
Results: During near viewing, children wearing single-vision lenses accommodated on average to achieve approximate focus in the pupil center but, because of combined accommodative lag and negative spherical aberration, experienced up to 2.00 D of hyperopic defocus in the pupil margins. With DF lenses, children accommodated similarly achieving approximate focus in the pupil center. When viewing three near distances (0.48, 0.31, and 0.23 m), the added +2.00 D within the DF lens treatment optics shifted the mean defocus from +0.75 to -1.00 D. The DF lens reduced the percentage of hyperopic defocus (≥+0.75 D) in the retinal image from 52 to 25% over these target distances, leading to an increase in myopic defocus (≤-0.50 D) from 17 to 42%.
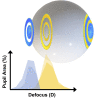
Conclusions: The DF contact lens did not alter the accommodative behavior of children. The treatment optics introduced myopic defocus and decreased the amount of hyperopically defocused light in the retinal image.
Copyright © 2023 The Author(s). Published by Wolters Kluwer Health, Inc. on behalf of the American Academy of Optometry.
Conflict of interest statement
Conflict of Interest Disclosure: NSL and PSK received financial support from CooperVision. MR is a consultant to CooperVision. PC, BA, and AB are employees of CooperVision. The sponsor participated in study design, analysis, and interpretation. All authors were responsible for the preparation of this article and the decision to submit this article for publication. The investigators at Aston University (NSL, SJ) had full access to the study data; the Indiana University investigators (VR, DM, MJ, MR, PSK) had partial access to the study data and take full responsibility for their presentation in this article. The lead author affirms that the article is an honest, accurate, and transparent account of the study being reported and that no important aspects of the study have been omitted. All investigators take responsibility for the integrity of the data and have critically reviewed the article for important intellectual content.
Figures


Similar articles
-
Accommodative behaviour and retinal defocus of children during prolonged viewing of electronic devices while wearing dual-focus myopia control soft contact lenses.Ophthalmic Physiol Opt. 2025 Sep;45(6):1456-1467. doi: 10.1111/opo.13533. Epub 2025 May 28. Ophthalmic Physiol Opt. 2025. PMID: 40437791 Free PMC article.
-
Accommodative behaviour and retinal defocus in highly myopic eyes fitted with a dual focus myopia control contact lens.Ophthalmic Physiol Opt. 2025 Jan;45(1):189-199. doi: 10.1111/opo.13420. Epub 2024 Nov 21. Ophthalmic Physiol Opt. 2025. PMID: 39569764 Free PMC article.
-
Accommodative Behavior of Young Eyes Wearing Multifocal Contact Lenses.Optom Vis Sci. 2018 May;95(5):416-427. doi: 10.1097/OPX.0000000000001214. Optom Vis Sci. 2018. PMID: 29683985
-
Temporal integration of visual signals in lens compensation (a review).Exp Eye Res. 2013 Sep;114:69-76. doi: 10.1016/j.exer.2013.02.014. Epub 2013 Mar 5. Exp Eye Res. 2013. PMID: 23470505 Free PMC article. Review.
-
Optical causes of experimental myopia.Ciba Found Symp. 1990;155:160-72; discussion 172-7. doi: 10.1002/9780470514023.ch10. Ciba Found Symp. 1990. PMID: 2088675 Review.
Cited by
-
Intraocular Straylight and Multifocal Soft Contact Lens Fit With a Myopia Control Approach.Eye Contact Lens. 2024 Apr 1;50(4):171-176. doi: 10.1097/ICL.0000000000001069. Epub 2024 Feb 6. Eye Contact Lens. 2024. PMID: 38345090 Free PMC article.
-
IMI-Instrumentation for Myopia Management.Invest Ophthalmol Vis Sci. 2025 Jul 1;66(9):7. doi: 10.1167/iovs.66.9.7. Invest Ophthalmol Vis Sci. 2025. PMID: 40600762 Free PMC article. Review.
-
Accommodative behaviour and retinal defocus of children during prolonged viewing of electronic devices while wearing dual-focus myopia control soft contact lenses.Ophthalmic Physiol Opt. 2025 Sep;45(6):1456-1467. doi: 10.1111/opo.13533. Epub 2025 May 28. Ophthalmic Physiol Opt. 2025. PMID: 40437791 Free PMC article.
-
Accommodative behaviour and retinal defocus in highly myopic eyes fitted with a dual focus myopia control contact lens.Ophthalmic Physiol Opt. 2025 Jan;45(1):189-199. doi: 10.1111/opo.13420. Epub 2024 Nov 21. Ophthalmic Physiol Opt. 2025. PMID: 39569764 Free PMC article.
-
Childhood Myopia Part II: Treatment Mechanisms, Emerging Options, and Considerations.Invest Ophthalmol Vis Sci. 2025 Jun 5;66(7):7. doi: 10.1167/iovs.66.7.7. Invest Ophthalmol Vis Sci. 2025. PMID: 40471569 Free PMC article. Review.
References
-
- Holden BA Fricke TR Wilson DA, et al. . Global Prevalence of Myopia and High Myopia and Temporal Trends from 2000 through 2050. Ophthalmology 2016;123:1036–42. - PubMed
-
- Ding BY Shih YF Lin LL, et al. . Myopia among Schoolchildren in East Asia and Singapore. Surv Ophthalmol 2017;62:677–97. - PubMed
-
- Jung SK Lee JH Kakizaki H, et al. . Prevalence of Myopia and Its Association with Body Stature and Educational Level in 19-year-old Male Conscripts in Seoul, South Korea. Invest Ophthalmol Vis Sci 2012;53:5579–83. - PubMed
-
- Wildsoet CF Chia A Cho P, et al. . IMI — Interventions Myopia Institute: Interventions for Controlling Myopia Onset and Progression Report. Invest Ophthalmol Vis Sci 2019;60:M106–31. - PubMed
MeSH terms
LinkOut - more resources
Full Text Sources
Medical
Miscellaneous

