. 2023 May 2;120(18):e2209731120.
doi: 10.1073/pnas.2209731120. Epub 2023 Apr 25.

Conditional bribery: Insights from incentivized experiments across 18 nations

Affiliations

Conditional bribery: Insights from incentivized experiments across 18 nations

Angela Rachael Dorrough et al. Proc Natl Acad Sci U S A. .

Abstract

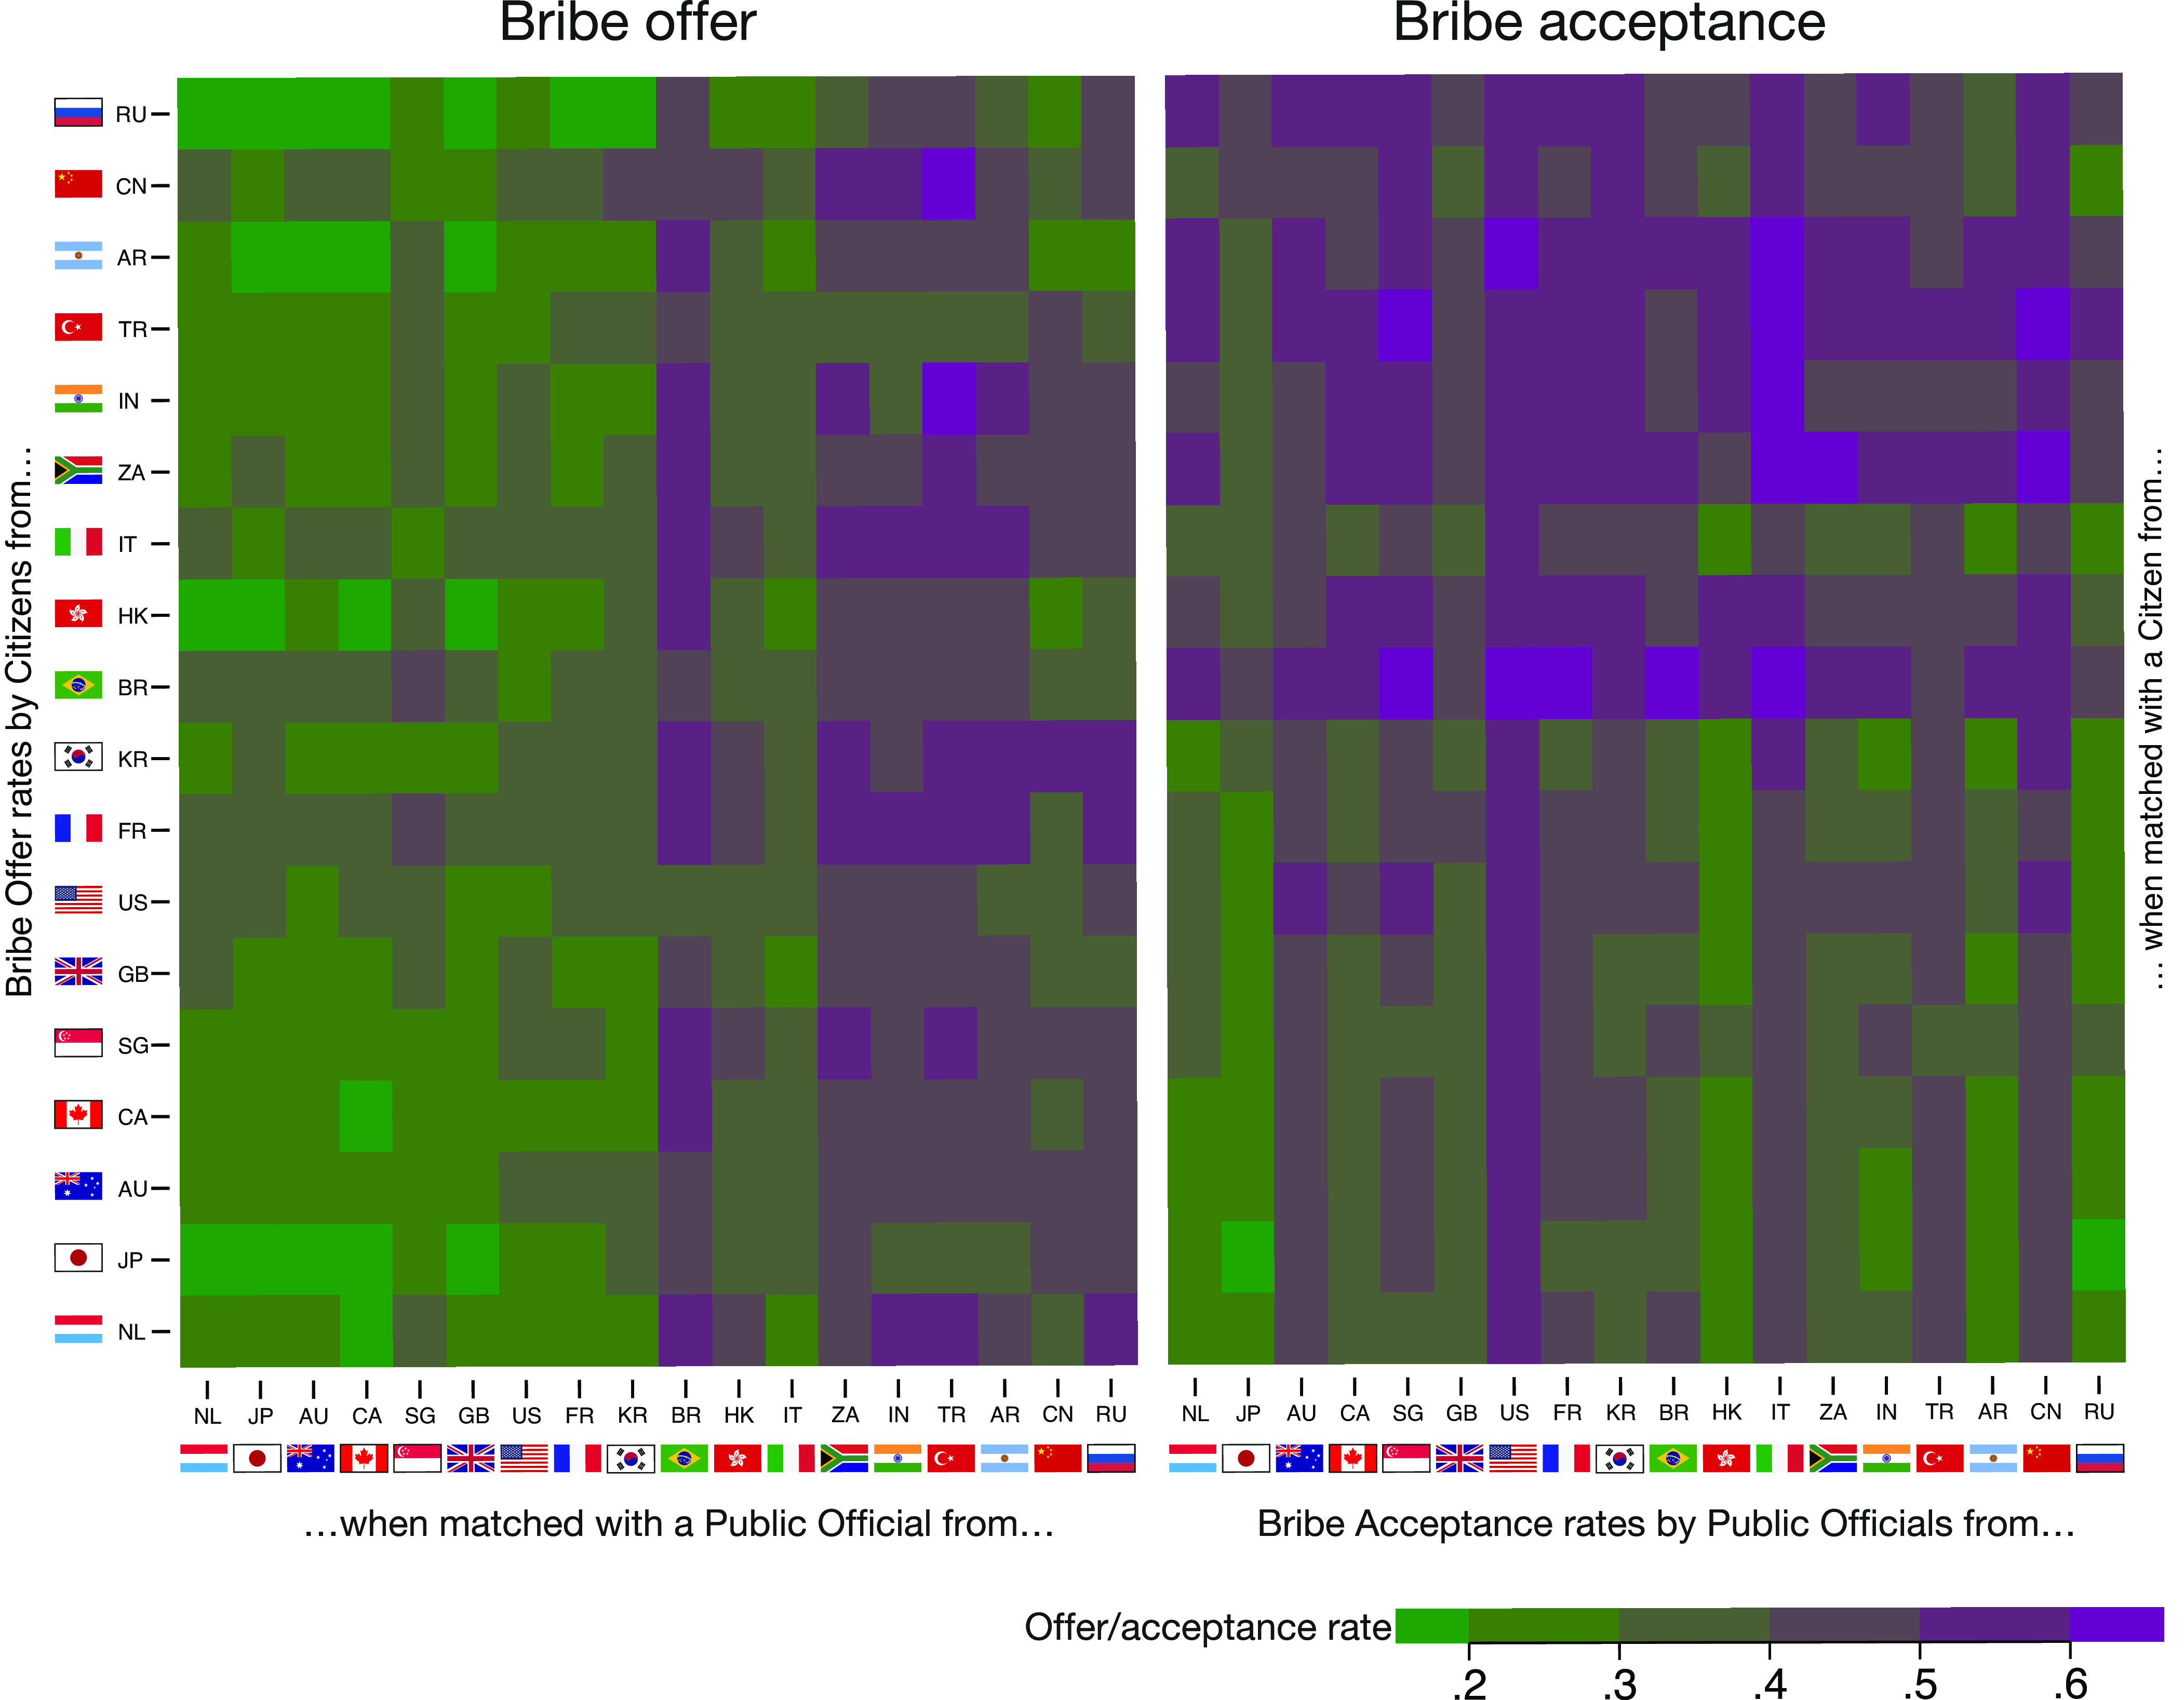
Bribery, a grand global challenge, often occurs across national jurisdictions. Behavioral research studying bribery to inform anticorruption interventions, however, has merely examined bribery within single nations. Here, we report online experiments and provide insights into crossnational bribery. We ran a pilot study (across three nations) and a large, incentivized experiment using a bribery game played across 18 nations (N = 5,582, total number of incentivized decisions = 346,084). The results show that people offer disproportionally more bribes to interaction partners from nations with a high (vs. low) reputation for foreign bribery, measured by macrolevel indicators of corruption perceptions. People widely share nation-specific expectations about a nation's bribery acceptance levels. However, these nation-specific expectations negatively correlate with actual bribe acceptance levels, suggesting shared yet inaccurate stereotypes about bribery tendencies. Moreover, the interaction partner's national background (more than one's own national background) drives people's decision to offer or accept a bribe-a finding we label conditional bribery.

Keywords: behavioral science; bribery; corruption; crosscultural; social norms.


Conflict of interest statement

The authors declare no competing interest.

Figures

Fig. 1.
Fig. 1.
Outline of the illustrated game tree of the bribery game. Participants took part in the game as both citizen players and public official players for their respective nations.
Fig. 2.
Fig. 2.
Heatmap showing overall bribery levels across all 18 nation matchings, with the nations ordered in ascending order according to Transparency International’s Bribe Payers Index. Color coding ranges from green (<10% bribery) to purple (=60% bribery). Left pane: The decisions to offer bribes as citizens for participants from the nations depicted on the Y axis when matched with the public officials from the nations depicted on the X axis. Right pane: The decision to accept bribes as public officials by participants from nations depicted on the X axis when matched with citizens from nations depicted on the Y axis. Nation abbreviations: NL = Netherlands; JP = Japan; AU = Australia; CA = Canada; SG = Singapore; GB = Great Britain; US = United States of America; FR = France; KR = South Korea; BR = Brazil; HK = Hong Kong; IT = Italy; ZA = South Africa; IN = India; TR = Turkey; AR = Argentina; CN = China; RU = Russia.
Fig. 3.
Fig. 3.
Offered bribes across nations showing that bribe offers correspond with national reputations for bribery. Bribe offers for all combinations of citizens’ and public officials’ nations. The Y axis depicts the mean-sorted citizens’ nations (i.e., the one making the bribe offer). The symbols and labels represent public officials’ nations (i.e., the one receiving the bribe offer). The public officials’ nations (see legend) are sorted by their rank in Transparency International’s Bribe Payers Index, with RU being the nation with the lowest rank (i.e., dark red; highest corruption) and NL being the nation with the highest rank (i.e., dark green; lowest perceived bribery). Nation codes: RU = Russia; CN = China; AR = Argentina; IN = India; TR = Turkey; ZA = South Africa; HK = Hong Kong; IT = Italy; BR = Brazil; KR = South Korea; FR = France; US = United States of America; GB = Great Britain; SG = Singapore; CA = Canada; AU = Australia; JP = Japan; NL = Netherlands. Symbol explanation: diamonds depict Asian nations, circles represent European nations, and squares depict other nations.
Fig. 4.
Fig. 4.
Cleveland dot plot depicting people’s miscalibration between the average expected and actual acceptance rates of bribery. The vertical red line represents when nation-specific expectations about bribe acceptance for a nation correspond with average bribe acceptance rates for that nation. The y-axis displays the nation that (is expected to) accept/s the offer. The lines connecting the dots and the vertical red line represent the inaccuracy of expectations—i.e., the deviation from the accurate expectation. Actual acceptance rates represent the percentage of participants in a nation who accepts a bribe offer. Positive values (right side from red vertical line) indicate an overestimation of bribe acceptance in percentage points, and negative values (left side from the red vertical line) indicate an underestimation. The nations are depicted in colors representing their rank in Transparency International’s Bribe Payers Index, with RU being the lowest rank (i.e., dark red; highest corruption) and NL being the nation with the highest rank (i.e., dark green; lowest perceived bribery). Nation codes: RU = Russia; CN = China; AR = Argentina; IN = India; TR = Turkey; ZA = South Africa; HK = Hong Kong; IT = Italy; BR = Brazil; KR = South Korea; FR = France; US = United States of America; GB = Great Britain; SG = Singapore; CA = Canada; AU = Australia; JP = Japan; NL = Netherlands. Symbol explanation: diamonds depict Asian nations, circles represent European nations, and squares depict other nations.

References

    1. United Nations, “The Sustainable Development Goals Report 2019” (United Nations, 2019).
    1. Rothstein B., Varraich A., Making Sense of Corruption (Cambridge University Press, 2017).
    1. Ambraseys N., Bilham R., Corruption kills. Nature 469, 153–155 (2011). - PubMed
    1. Smith R. J., Muir R. D. J., Walpole M. J., Balmford A., Leader-Williams N., Governance and the loss of biodiversity. Nature 426, 67–70 (2003). - PubMed
    1. Povitkina M., The limits of democracy in tackling climate change. Env. Polit. 27, 411–432 (2018).

LinkOut - more resources