. 2023 May 2;120(18):e2207537120.
doi: 10.1073/pnas.2207537120. Epub 2023 Apr 25.

Multiple models for outbreak decision support in the face of uncertainty

Katriona Shea  1   2 Rebecca K Borchering  1   2 William J M Probert  3 Emily Howerton  1   2 Tiffany L Bogich  1   2 Shou-Li Li  4 Willem G van Panhuis  5 Cecile Viboud  6 Ricardo Aguás  3 Artur A Belov  7 Sanjana H Bhargava  8 Sean M Cavany  9 Joshua C Chang  10   11 Cynthia Chen  12 Jinghui Chen  13 Shi Chen  14   15 YangQuan Chen  16 Lauren M Childs  17 Carson C Chow  18 Isabel Crooker  19 Sara Y Del Valle  19 Guido España  9 Geoffrey Fairchild  19 Richard C Gerkin  20 Timothy C Germann  19 Quanquan Gu  13 Xiangyang Guan  12 Lihong Guo  21 Gregory R Hart  22 Thomas J Hladish  8   23 Nathaniel Hupert  24 Daniel Janies  25 Cliff C Kerr  22 Daniel J Klein  22 Eili Y Klein  26   27 Gary Lin  26   27 Carrie Manore  19 Lauren Ancel Meyers  28 John E Mittler  29 Kunpeng Mu  30 Rafael C Núñez  22 Rachel J Oidtman  9 Remy Pasco  31 Ana Pastore Y Piontti  30 Rajib Paul  14 Carl A B Pearson  32   33   34 Dianela R Perdomo  8 T Alex Perkins  9 Kelly Pierce  35 Alexander N Pillai  8 Rosalyn Cherie Rael  19 Katherine Rosenfeld  22 Chrysm Watson Ross  19 Julie A Spencer  19 Arlin B Stoltzfus  36 Kok Ben Toh  37 Shashaank Vattikuti  18 Alessandro Vespignani  30 Lingxiao Wang  13 Lisa J White  3 Pan Xu  13 Yupeng Yang  27 Osman N Yogurtcu  7 Weitong Zhang  13 Yanting Zhao  38 Difan Zou  13 Matthew J Ferrari  1   2 David Pannell  39 Michael J Tildesley  40 Jack Seifarth  1   2 Elyse Johnson  1   2 Matthew Biggerstaff  41 Michael A Johansson  41 Rachel B Slayton  41 John D Levander  42 Jeff Stazer  42 Jessica Kerr  42 Michael C Runge  43
Affiliations

Multiple models for outbreak decision support in the face of uncertainty

Katriona Shea et al. Proc Natl Acad Sci U S A. .

Abstract

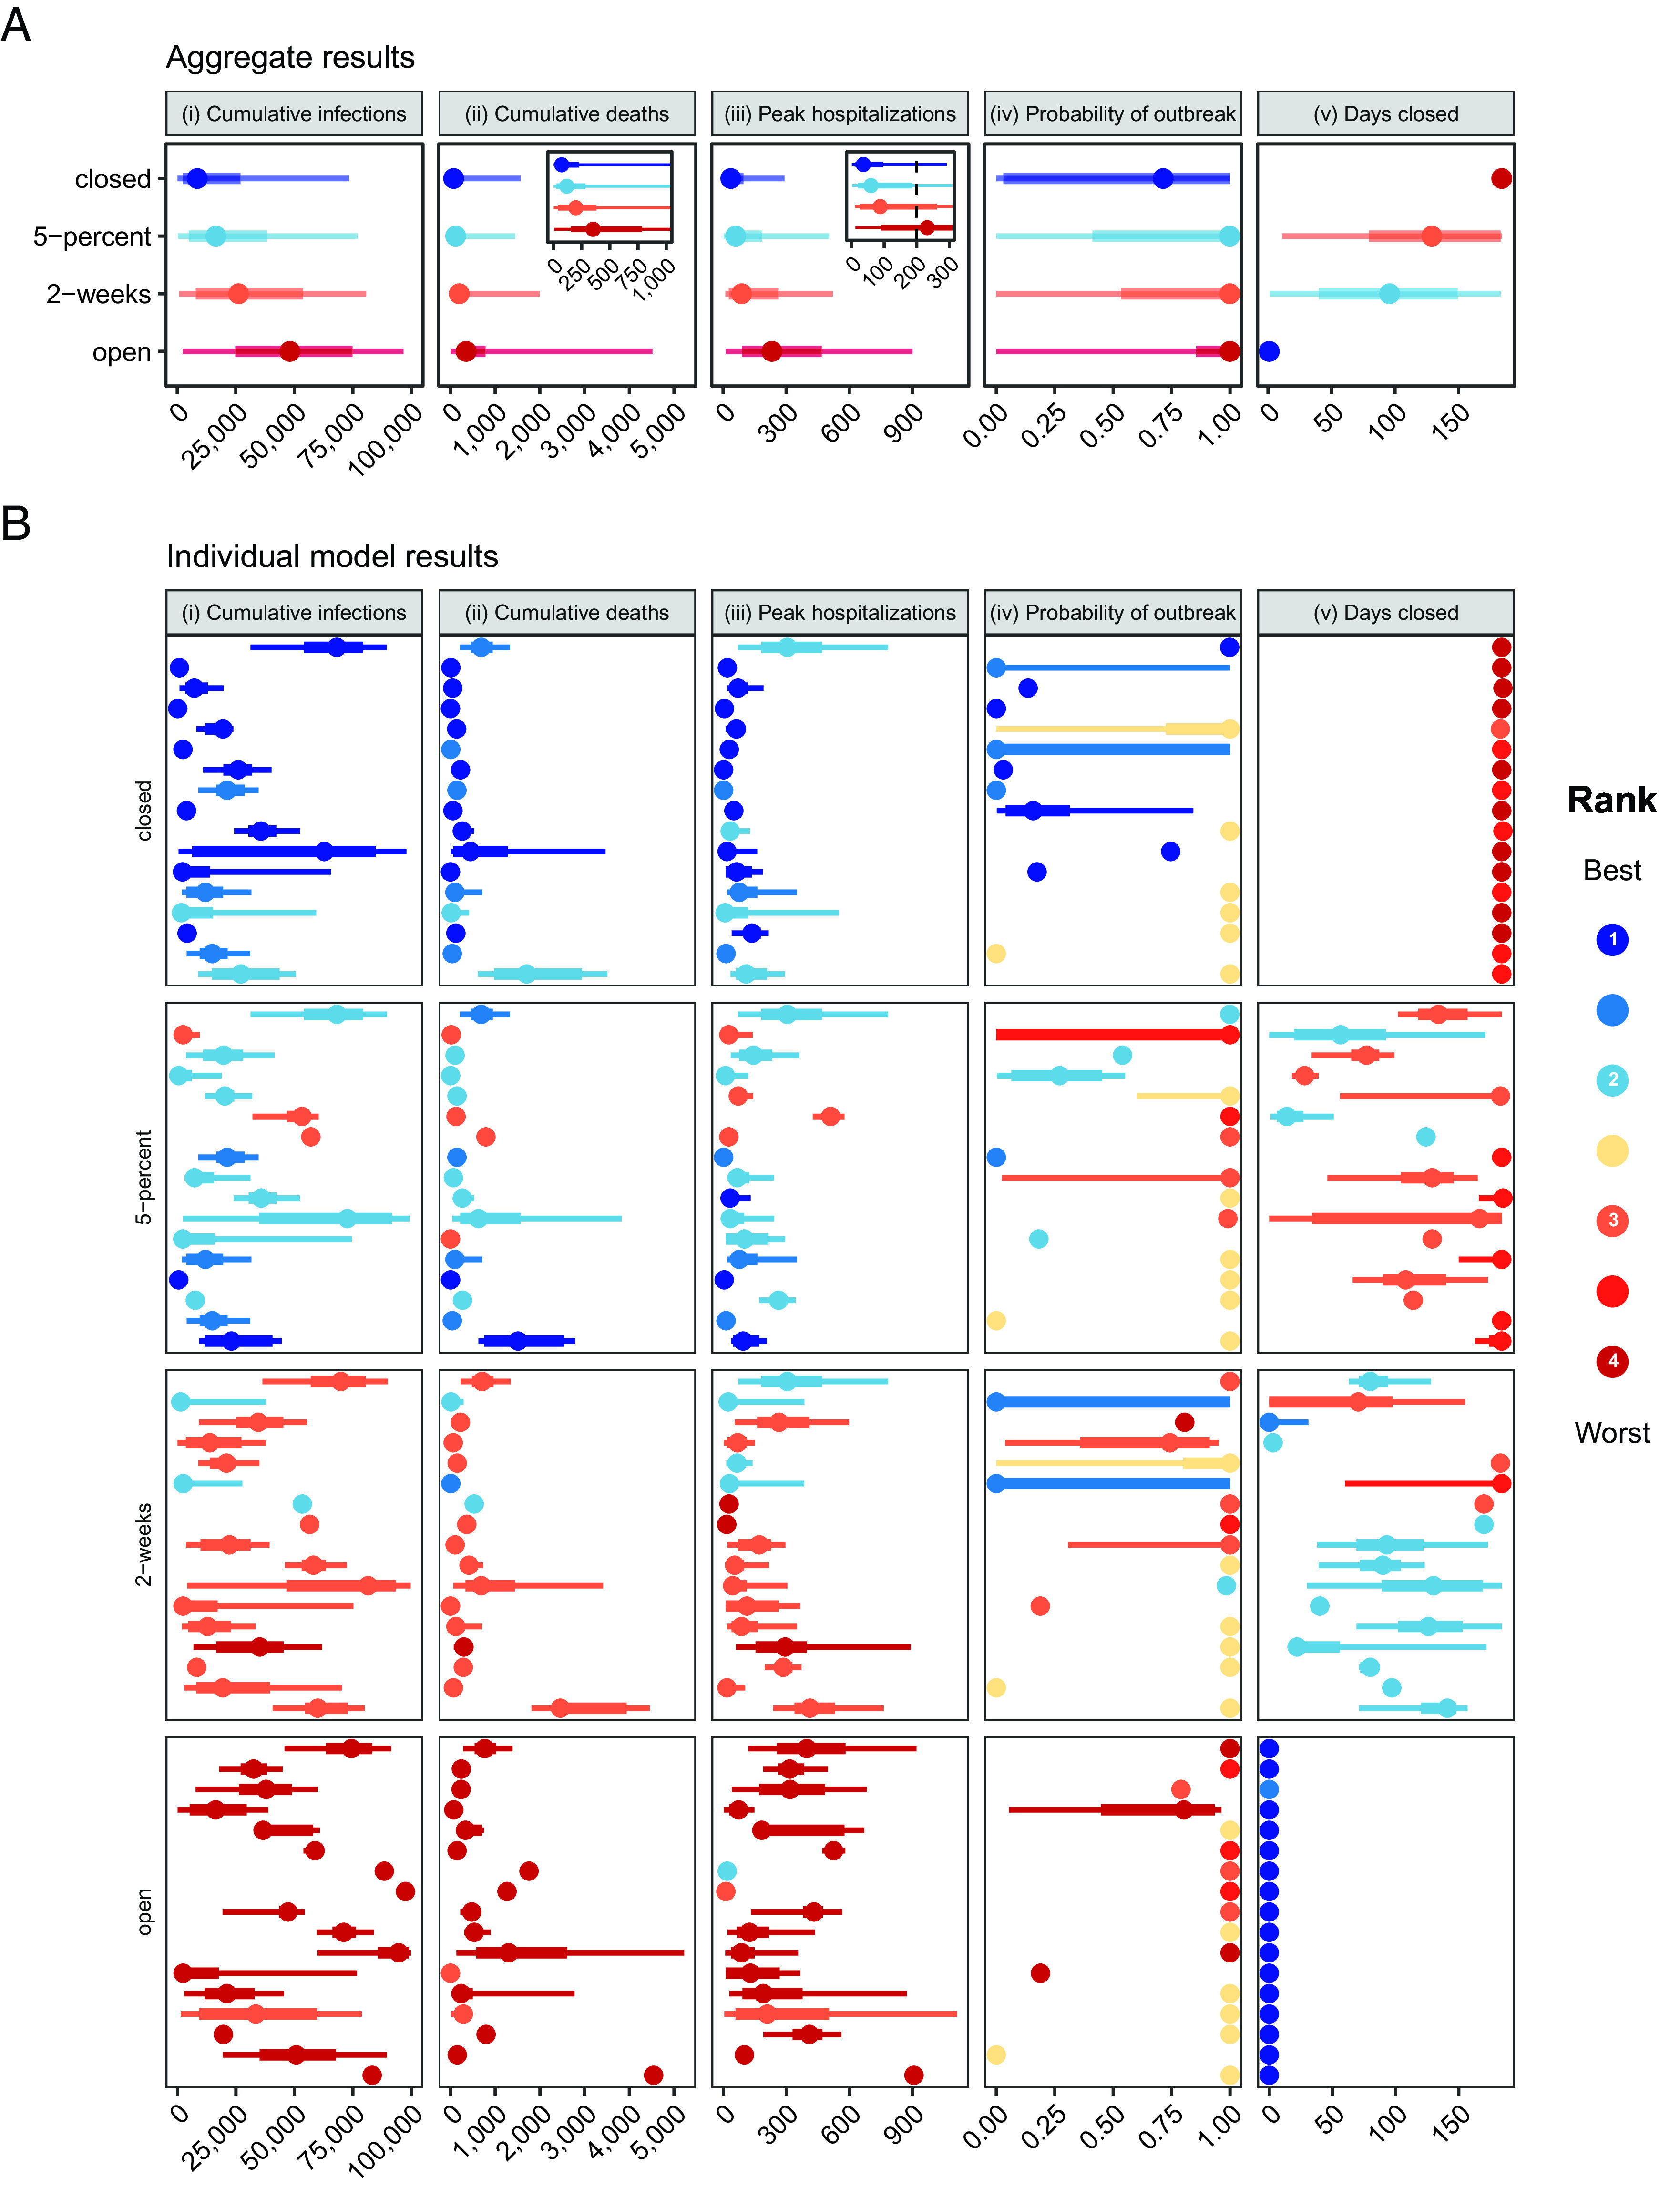
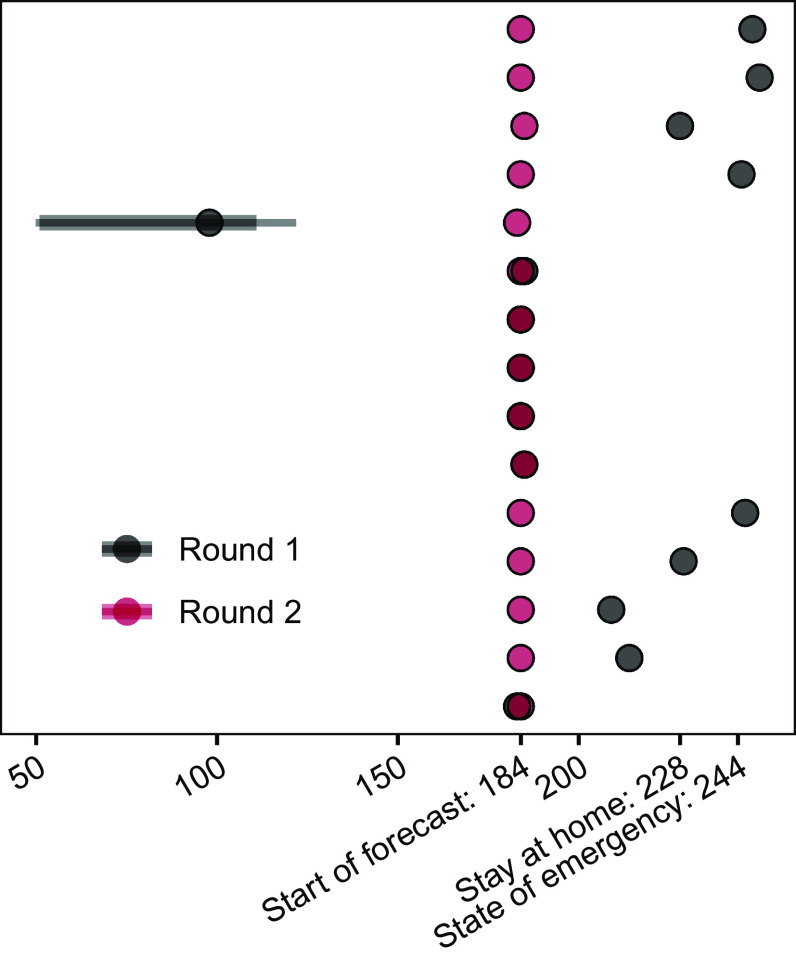
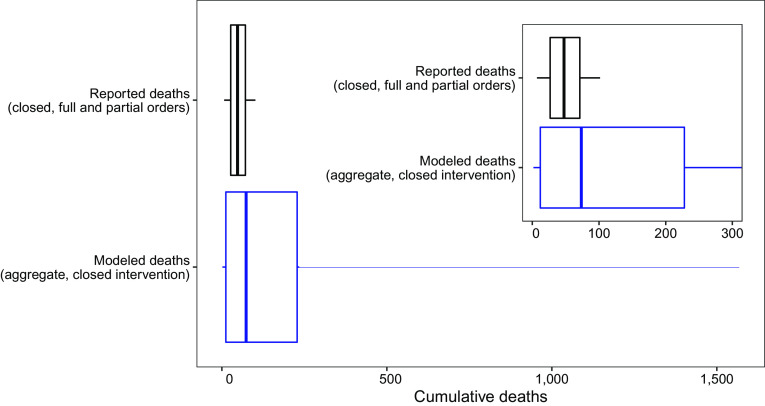
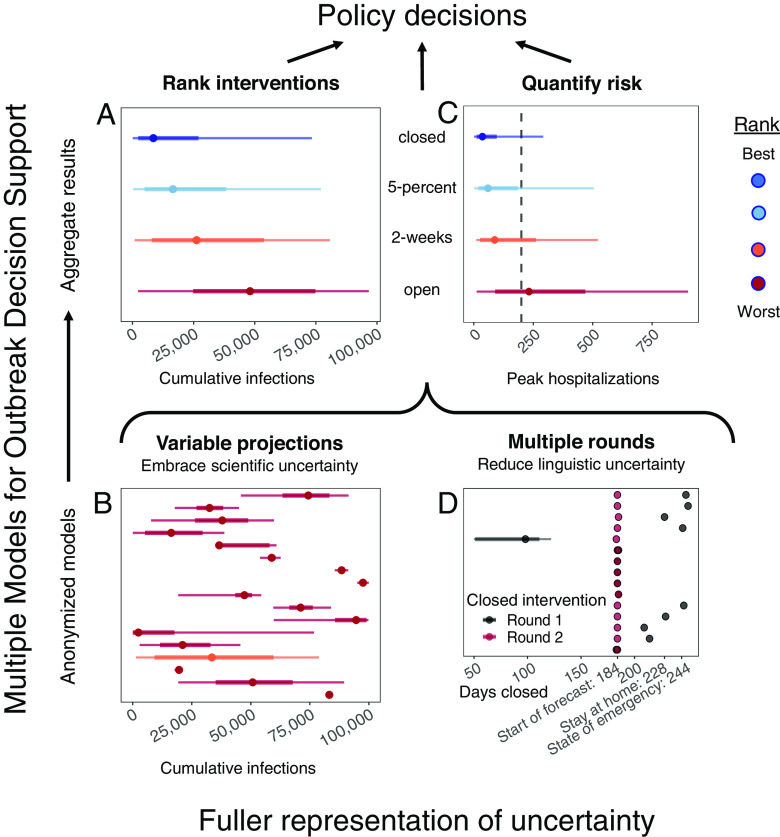
Policymakers must make management decisions despite incomplete knowledge and conflicting model projections. Little guidance exists for the rapid, representative, and unbiased collection of policy-relevant scientific input from independent modeling teams. Integrating approaches from decision analysis, expert judgment, and model aggregation, we convened multiple modeling teams to evaluate COVID-19 reopening strategies for a mid-sized United States county early in the pandemic. Projections from seventeen distinct models were inconsistent in magnitude but highly consistent in ranking interventions. The 6-mo-ahead aggregate projections were well in line with observed outbreaks in mid-sized US counties. The aggregate results showed that up to half the population could be infected with full workplace reopening, while workplace restrictions reduced median cumulative infections by 82%. Rankings of interventions were consistent across public health objectives, but there was a strong trade-off between public health outcomes and duration of workplace closures, and no win-win intermediate reopening strategies were identified. Between-model variation was high; the aggregate results thus provide valuable risk quantification for decision making. This approach can be applied to the evaluation of management interventions in any setting where models are used to inform decision making. This case study demonstrated the utility of our approach and was one of several multimodel efforts that laid the groundwork for the COVID-19 Scenario Modeling Hub, which has provided multiple rounds of real-time scenario projections for situational awareness and decision making to the Centers for Disease Control and Prevention since December 2020.

Keywords: cognitive biases; decision theory; multi-model aggregation.


Conflict of interest statement

The authors declare no competing interest.

Figures

Fig. 1.
Fig. 1.
Aggregate and 17 individual model results for target objective and intervention scenario pairs. Medians, 50% prediction intervals (PIs, the range of values within which we project future outcomes will fall with 50% probability), and 90% PIs are indicated as points, thick lines, and thin lines, respectively. Colors denote ranking of each intervention for a single objective, where dark blue signifies the lowest value (best performance) and dark red signifies the highest value (worst performance). Ties in ranks are colored as intermediate values. Ties between ranks 1 and 2 and ranks 3 and 4 are shown as an intermediate blue and red, respectively; yellow indicates a tie in ranks across all interventions. The five panels show the results for: i) cumulative SARS-CoV-2 infections (rather than reported cases) between May 15 and November 15, 2020; ii) cumulative deaths due to COVID-19 over the same period, with an inset displaying the results for a smaller range of values, beginning with zero and containing the 50% prediction intervals; iii) the peak number of hospitalizations over the same period, with the inset showing a smaller range of values, and the hospital capacity of 200 beds with a vertical dotted line; iv) the probability of an outbreak of greater than 10 new cases per day after May 15; and v) the number of days that nonessential workplaces are closed between May 15 and November 15. The interventions include “closed”, workplace closure throughout the 6-mo period; “5-percent”, nonessential workplace reopening when cases decline below 5% of the peak caseload; “2-wk”, nonessential workplace reopening 2 wk after the peak; and “open”, immediate reopening of all workplaces on May 15. The setting is a generic US county of 100,000 people that had experienced 180 reported cases and 6 deaths as of May 15, 2020; all schools are assumed to be closed throughout the projection period. (A) Aggregate distributions for each objective and intervention scenario pair. The aggregate distributions were calculated as the unweighted average of the individual cumulative distribution functions across the 16 modeling groups. (B) Individual model results for each objective and intervention scenario pair. Results are presented here essentially as they were shown to modeling teams during the between-round discussion (except each projection was labeled with a letter that was only shared with the team that generated that projection); projections were intentionally presented anonymously to avoid groupthink and authority bias.
Fig. 2.
Fig. 2.
Resolution of linguistic uncertainty in the discussion following round 1 of modeling about the number of days nonessential workplaces are closed. Direct comparison of round 1 and 2 results for days closed for the fully closed intervention. In round 1, groups used a variety of start dates (start of the forecast, first day of stay at home orders, or state of emergency declarations) and one group implemented a weighting for essential and nonessential business closures and associated compliance issues explicitly.
Fig. 3.
Fig. 3.
Comparison of aggregate reported county death data to modeled deaths for the closed intervention. Boxplot of cumulative reported deaths from 84 US counties with full or partial stay at home orders in place from May 15 to November 15, 2020 (median deaths: 48; 50% IQR: 27, 71) and model results for cumulative deaths from May 15 to November 15, 2020 under the closed intervention (median deaths: 73; 50% IQR: 12, 228). Vertical line shows median value, box shows IQR (25th to 75th quantiles), and whiskers extend to the 5th and 95th quantiles. Inset shows overlap of box area for the plots.
Fig. 4.
Fig. 4.
Overview of the MMODS approach: Embracing uncertainty to inform COVID-19 nonessential workplace reopening decisions using multiple models for outbreak decision support. Aggregate results ranked interventions consistently for specific objectives (e.g., minimizing cumulative infections) (A) even though the model-specific magnitude of projections varied greatly (B). Ensemble aggregate distributions quantify risk for decision makers and enable them to inform decisions in the context of resource limitations, such as the availability of hospital beds denoted by the vertical dotted line (C). An intermediate discussion between two rounds of independent model projections resolved inconsistencies in interpretation of intervention implementation as well as objective specification (D).

Update of

  • COVID-19 reopening strategies at the county level in the face of uncertainty: Multiple Models for Outbreak Decision Support.
    Shea K, Borchering RK, Probert WJM, Howerton E, Bogich TL, Li S, van Panhuis WG, Viboud C, Aguás R, Belov A, Bhargava SH, Cavany S, Chang JC, Chen C, Chen J, Chen S, Chen Y, Childs LM, Chow CC, Crooker I, Valle SYD, España G, Fairchild G, Gerkin RC, Germann TC, Gu Q, Guan X, Guo L, Hart GR, Hladish TJ, Hupert N, Janies D, Kerr CC, Klein DJ, Klein E, Lin G, Manore C, Meyers LA, Mittler J, Mu K, Núñez RC, Oidtman R, Pasco R, Piontti APY, Paul R, Pearson CAB, Perdomo DR, Perkins TA, Pierce K, Pillai AN, Rael RC, Rosenfeld K, Ross CW, Spencer JA, Stoltzfus AB, Toh KB, Vattikuti S, Vespignani A, Wang L, White L, Xu P, Yang Y, Yogurtcu ON, Zhang W, Zhao Y, Zou D, Ferrari M, Pannell D, Tildesley M, Seifarth J, Johnson E, Biggerstaff M, Johansson M, Slayton RB, Levander J, Stazer J, Salerno J, Runge MC. Shea K, et al. medRxiv [Preprint]. 2020 Nov 5:2020.11.03.20225409. doi: 10.1101/2020.11.03.20225409. medRxiv. 2020. Update in: Proc Natl Acad Sci U S A. 2023 May 2;120(18):e2207537120. doi: 10.1073/pnas.2207537120. PMID: 33173914 Free PMC article. Updated. Preprint.

References

    1. Berger L., et al. , Rational policymaking during a pandemic. Proc. Natl. Acad. Sci. U.S.A. 118, e2012704118 (2021). - PMC - PubMed
    1. Shea K., et al. , Harnessing multiple models for outbreak management. Science 368, 577–579 (2020). - PubMed
    1. Biggerstaff M., Slayton R. B., Johansson M. A., Butler J. C., Improving pandemic response: Employing mathematical modeling to confront Coronavirus Disease 2019. Clin. Infect. Dis. 74, 913–917 (2022). - PMC - PubMed
    1. Thomson M. C., et al. , Malaria early warnings based on seasonal climate forecasts from multi-model ensembles. Nature 439, 576–579 (2006). - PubMed
    1. Li S.-L., et al. , Essential information: Uncertainty and optimal control of Ebola outbreaks. Proc. Natl. Acad. Sci. U.S.A. 114, 5659–5664 (2017). - PMC - PubMed

Publication types