. 2023 May 2;120(18):e2221040120.
doi: 10.1073/pnas.2221040120. Epub 2023 Apr 25.

Geometry-mediated bridging drives nonadhesive stripe wound healing

Affiliations

Geometry-mediated bridging drives nonadhesive stripe wound healing

Hongmei Xu et al. Proc Natl Acad Sci U S A. .

Abstract

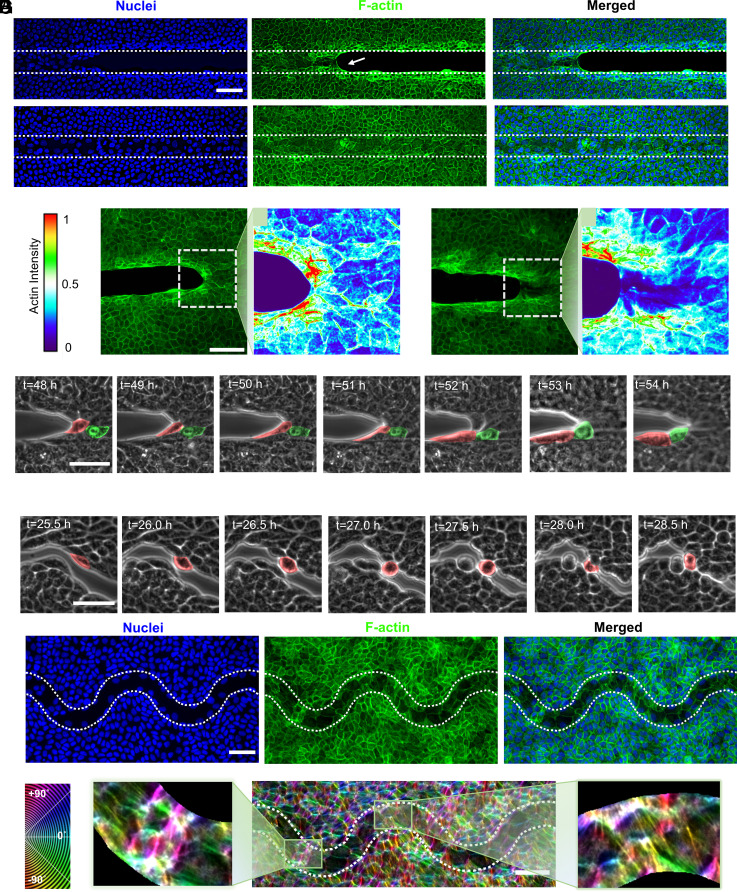
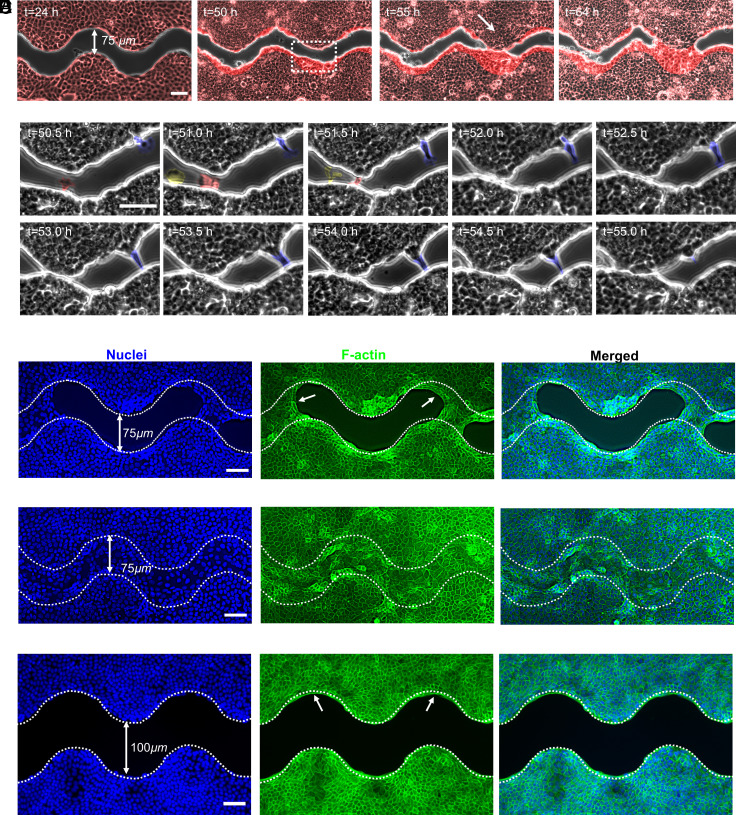
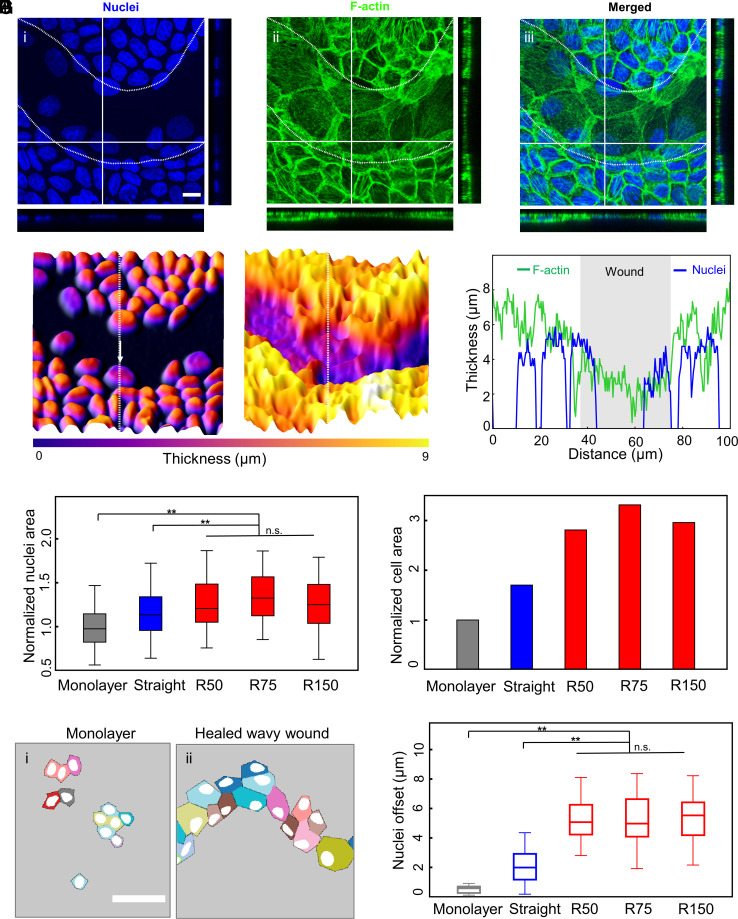
Wound healing through reepithelialization of gaps is of profound importance to the medical community. One critical mechanism identified by researchers for closing non-cell-adhesive gaps is the accumulation of actin cables around concave edges and the resulting purse-string constriction. However, the studies to date have not separated the gap-edge curvature effect from the gap size effect. Here, we fabricate micropatterned hydrogel substrates with long, straight, and wavy non-cell-adhesive stripes of different gap widths to investigate the stripe edge curvature and stripe width effects on the reepithelialization of Madin-Darby canine kidney (MDCK) cells. Our results show that MDCK cell reepithelization is closely regulated by the gap geometry and may occur through different pathways. In addition to purse-string contraction, we identify gap bridging either via cell protrusion or by lamellipodium extension as critical cellular and molecular mechanisms for wavy gap closure. Cell migration in the direction perpendicular to wound front, sufficiently small gap size to allow bridging, and sufficiently high negative curvature at cell bridges for actin cable constriction are necessary/sufficient conditions for gap closure. Our experiments demonstrate that straight stripes rarely induce cell migration perpendicular to wound front, but wavy stripes do; cell protrusion and lamellipodia extension can help establish bridges over gaps of about five times the cell size, but not significantly beyond. Such discoveries deepen our understanding of mechanobiology of cell responses to curvature and help guide development of biophysical strategies for tissue repair, plastic surgery, and better wound management.

Keywords: actin cable; cell protrusion; collective cell migration; gap closure; lamellipodia extension.


Conflict of interest statement

The authors declare no competing interest.

Figures

Fig. 1.
Fig. 1.
Schematics of nonadhesive wound-healing assays with different geometries. (A) Fibronectin-coated substrate with a simple circular gap. (B and C) Monolayers with negatively and positively curved adhesive edges, respectively. (D and E) Monolayers with semi-infinitely long straight or wavy nonadhesive stripes, respectively. W and R represent the width and the radius of curvature of the gap region, respectively.
Fig. 2.
Fig. 2.
Different gap closure pathways and wound-healing speeds for straight and wavy stripes. (A) Time-lapse phase-contrast images showing different wound-healing stages over non-cell-adhesive regions in straight (W30-R∞) and wavy (W30-R75) stripes. MDCK cells at both ends of straight stripes (white arrows) continuously advance to heal the wound, while MDCK cells around wavy gaps form bridges (white arrows) to heal the wound. The fibronectin pattern is shown in dark red, and MDCK spread into the nonadhesive substrate is highlighted in bright red. (Scale bars: 50 µm.) (B) Time-lapse montage of region of interest in W30-R∞ (dashed box in A, Left, t = 42 h) showing the progression of MDCK cells on the nonadhesive substrate. The dashed white line shows the advancing movement of the leading cells. The interval between each frame is 30 min. The recording started at t = 34.5 h and ended at t = 64 h. (C) The ratio of the healed area over the whole nonadhesive gap area as a function of time. Observation starts from the formation of confluent epithelial monolayer 24 h after seeding the cells. (D) Average healing speed for straight and wavy stripes. Healing speed of W30-R∞ is calculated using data throughout the recorded period; W30-R75 is calculated using data before it is fully healed. (E) Time needed for the first bridge to form and for the gap to be fully healed for different wavy stripes (W = 30 µm, R = 50, 75, 150 µm). (F) Bridge density, i.e., number of bridges, per wound length for different wavy stripes. In CF, each datapoint for each bar of the plot was obtained from three samples of the same geometry. Error bars show 1 SD, and **P-value < 0.01. There is no significant difference (P-value ≥ 0.05) among the W30-R50, W30-R75, and W30-R150 in the first bridge formation and fully healed time.
Fig. 3.
Fig. 3.
Healing of straight stripes driven by actin-cable constriction, and of narrow wavy stripes by protruded cell-enabled bridge formation. (A and B) Fluorescence images of half-healed and fully healed straight stripes. White arrow in Aii indicates the formation of actin cable structure. White dotted lines mark the edges of fibronectin pattern. (C) Projection of confocal z-stacks of F-actin and color-coded F-actin intensity. (i and iii) represent accumulated and relaxed actin-cable structure, respectively. (D) Time series of phase-contrast images showing a cell (in red false color) at the tip of straight gap (W30-R∞) merging into the edge side, while the cell right behind moving to the wound tip. (E) A cell being protruded (false colored in red) to form a bridge over the wavy wound (W30-R75). (F) Fluorescence images of fully healed wavy stripe (W30-R75). (G) Color-coded F-actin orientation distribution map in F (ii). The zoomed-in images highlight the location where the F-actin orientation inside of the healed wound is perpendicular to the edges, indicating the location of cellular bridges. (Scale bars: 50 µm.)
Fig. 4.
Fig. 4.
Bridge formation mechanism over wide wavy stripes. (A) Time-lapse phase-contrast images show the bridge formation process (white arrow) in wavy stripes of 75 µm in width (W75-R75). The fibronectin pattern is shown in dark red, and MDCK spread into the nonadhesive substrate is highlighted in bright red. (B) Enlarged views of the time-lapse images (white dotted box in A, t = 50 h). Lamellipodia superimposed with red and yellow false colors demonstrated an example of successful bridge formation. The exploration of the lamellipodium in blue false color failed to establish junctions with cells on the other side and retracted from the nonadhesive substrate. (C and D) Fluorescence images of half-healed and fully healed W75-R75 wavy gaps. Actin-cable structures were evident as indicated by white arrows. (E) Lamellipodia failed to bridge over the wavy stripes of 100 µm in width (W100-R75). Thick multicellular F-actin bundles formed at the edge of negative curvature as marked by white arrows but failed to form suspended actin structure over the nonadhesive substrate. (Scale bars: 50 µm.)
Fig. 5.
Fig. 5.
Velocimetry analysis of cell motion during gap closure. (A and B) Cell velocity magnitude heatmaps, phase-contrast images superposed with velocity vector maps, and the zoom-in PIV results of velocity vectors of (A) W30-R∞, and (B) W30-R75, stripes. The gray region in and B, i represents the nonadhesive gap. The color of velocity vectors indicates the velocity magnitude, consistent with the scale in the heatmaps. Horizontal cell movement dominated along the edges of the W30-R∞ gap. Cell movement behind the positively curved regions of the W30-R75 gap displayed vortex-like patterns. (Scale bar: 50 µm.) (C) Trajectories of selected cells on W30-R∞ (Top) and W30-R75 (Bottom) samples traced for 30 h after reaching confluence. The white area indicates the wound region. (D) Comparison of the average magnitude of vertical velocity v of cells in different layers near the gap edges. Thirty, 60, and 90 denote three successive 30-µm-wide bands in MDCK monolayer (SI Appendix, Fig. S13). Each boxplot contains the magnitude of vertical velocity from around 120 consecutive frames (10 min per frame, 20 h in total before the W30-R75 is fully healed) of three stripes. Each frame contains several hundred cells and around 6,000 vectors. n.s. denotes P-value ≥ 0.05, *P-value < 0.05, and **P-value < 0.01.
Fig. 6.
Fig. 6.
Cell and nuclear morphologies over the closed gaps. (A) Orthogonal views of confocal z-stacks of a W30-R75 sample. The white dotted lines mark the initial gap edge. Nuclei in the nonadhesive substrate appeared biased toward the adhesive substrate. (Scale bar: 10 µm.) (B) 3D heatmap of nuclei (i) and F-actin (ii) thickness, corresponding to the confocal images in A. (C) The thickness profile of F-actin (green) and nuclei (blue) along the while dotted line in (B) (the direction is indicated by an arrow in (B). The gray zone represents the nonadhesive gap. Nuclei and F-actin were apparently thinner within the healed gap than outside the gap. (D) Normalized in-plane nuclear area of MDCK cells in monolayer, healed straight gap, healed wavy gaps with R of 50 µm, 75 µm, and 150 µm, respectively (the gap width was maintained as 30 µm). A total of 24,500 cells in monolayer were analyzed as control group, and more than 70 cells in the gap region were analyzed in other groups. (E) Normalized projected cell area. The cell area is defined as the total area of a representative region divided by the number of identified nuclei within the region. The calculated cell area in the healed gap region was normalized by the average cell area in the monolayer far away from the gap on the same sample. (F) Relative positions of the nuclei with the selected cells in the monolayer and in the healed wavy gap region, demonstrating nuclei offset over gap regions. The nuclei shape was colored in white, while the parent cells were assigned random colors. (Scale bar: 50 µm.) (G) Measured nuclei offset of the same samples used for D. n.s. denotes P-value ≥ 0.05, *P-value < 0.05, and **P-value < 0.01.

References

    1. Langer K., On the anatomy and physiology of the skin: I. The cleavability of the cutis. Br. J. Plast. Surg. 31, 3–8 (1978). - PubMed
    1. Azmat C. E., Council M., Wound Closure Techniques (StatPearls Publishing, 2022) (July 17, 2022). - PubMed
    1. Saiko G., “The impact of the wound shape on wound healing dynamics: Is it time to revisit wound healing measures?” in Proceedings of the 14th International Joint Conference on Biomedical Engineering Systems and Technologies, Lorenz R., Fred A., Gamboa H., Eds. (SCITEPRESS - Science and Technology Publications, 2021), pp. 182–187.
    1. Borges A. F., Zigzag incisions for improved exposure and scarring. Clin. Orthop. 145, 202–207 (1979). - PubMed
    1. Nguyen D. T., Orgill D. P., Murphy G. F., “The pathophysiologic basis for wound healing and cutaneous regeneration” in Biomaterials for Treating Skin Loss, Orgill D., Blanco C., Eds. (Woodhead Publishing, Woodhead Publishing Series in Biomaterials, 2009), pp. 25–57.

Publication types

LinkOut - more resources