. 2023 May 4;83(9):1412-1428.e7.
doi: 10.1016/j.molcel.2023.04.001. Epub 2023 Apr 24.

NSD1 deposits histone H3 lysine 36 dimethylation to pattern non-CG DNA methylation in neurons

Affiliations

NSD1 deposits histone H3 lysine 36 dimethylation to pattern non-CG DNA methylation in neurons

Nicole Hamagami et al. Mol Cell. .

Abstract

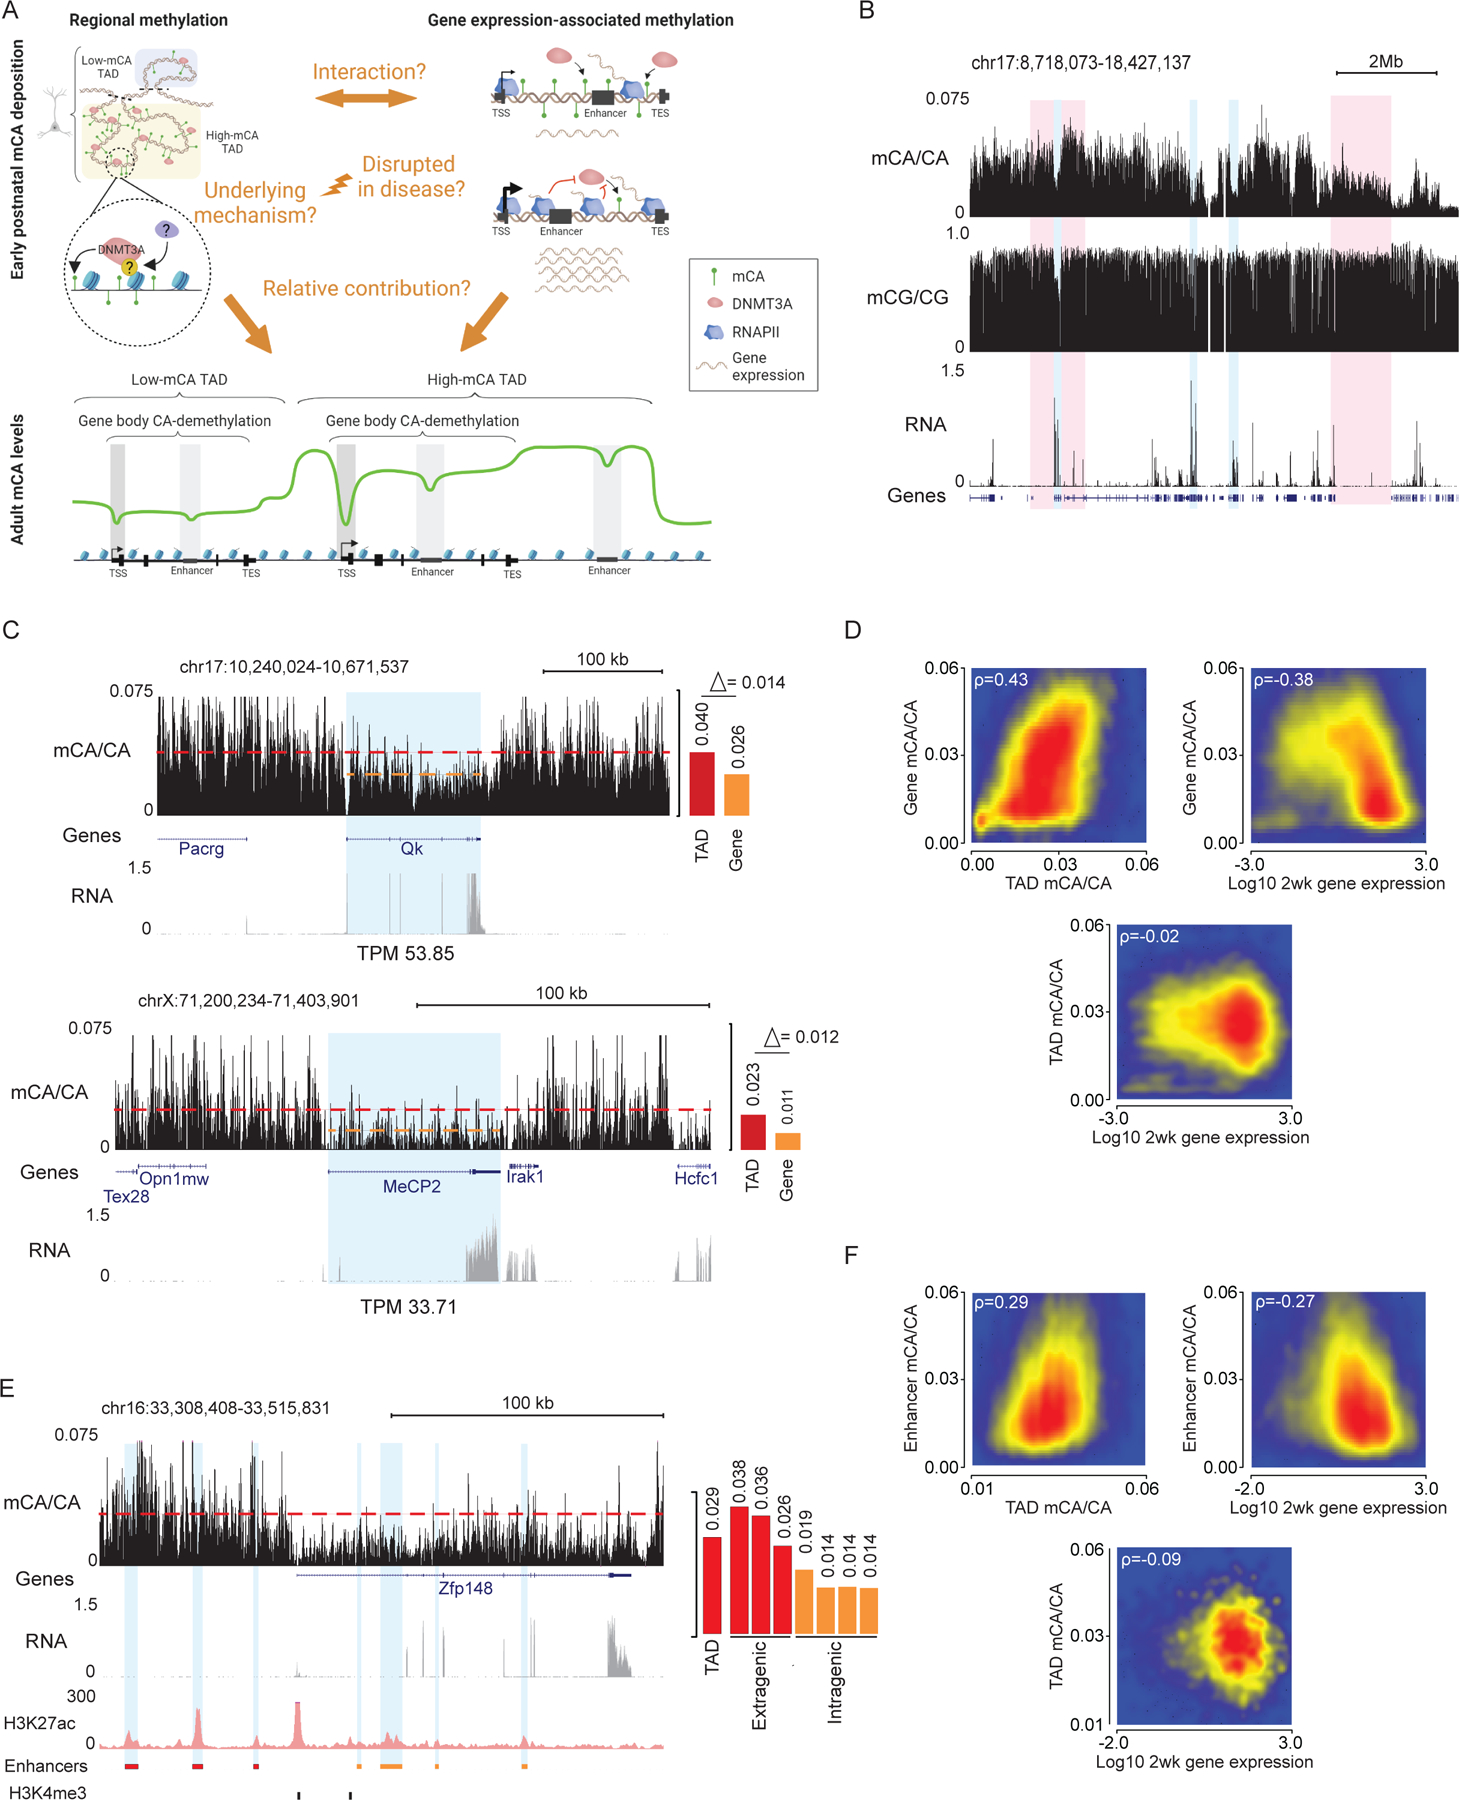
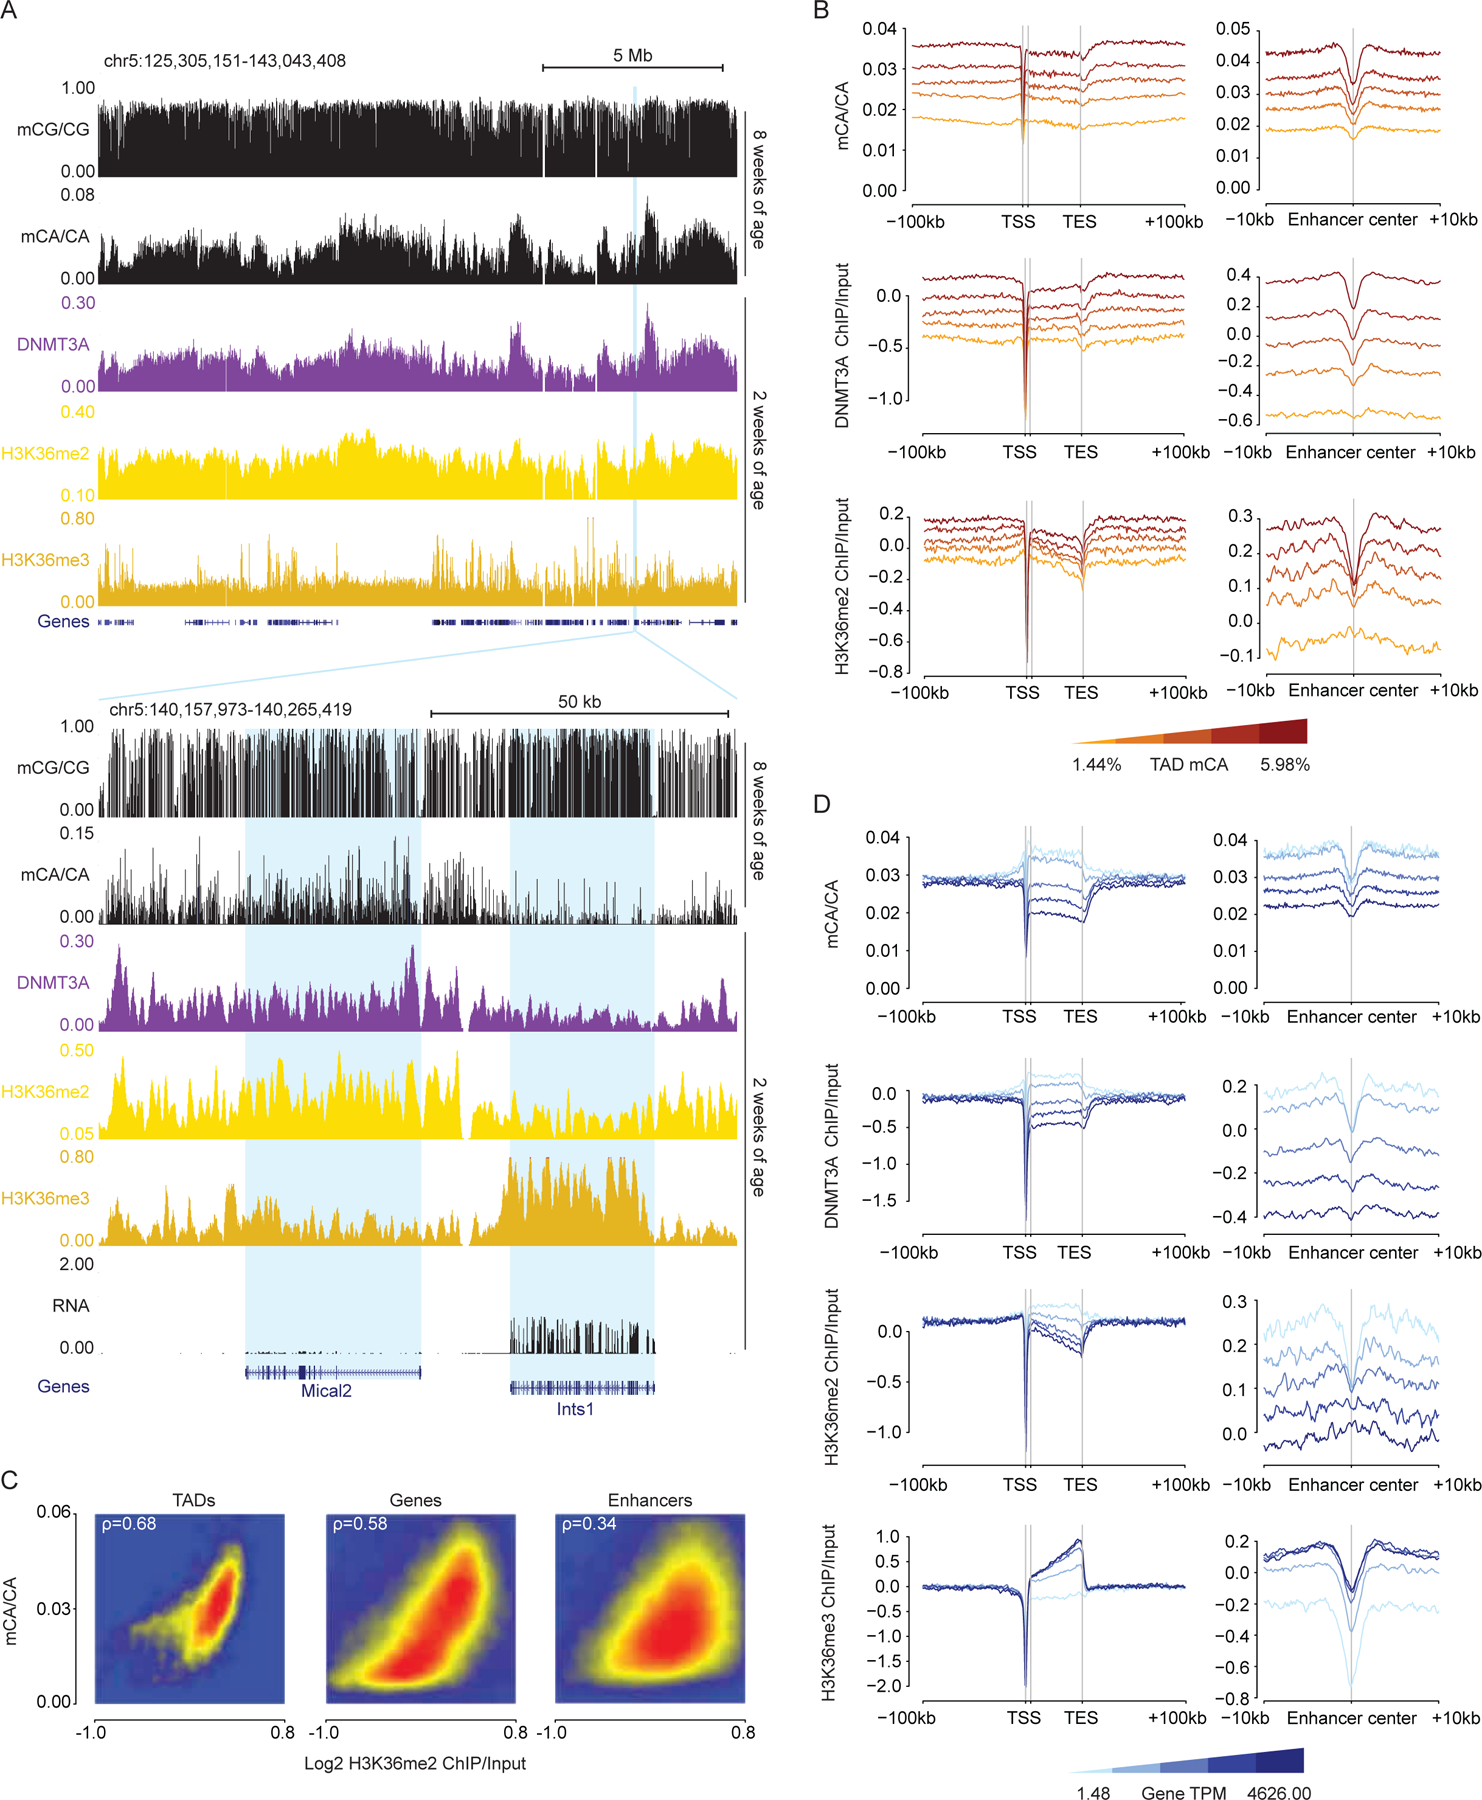
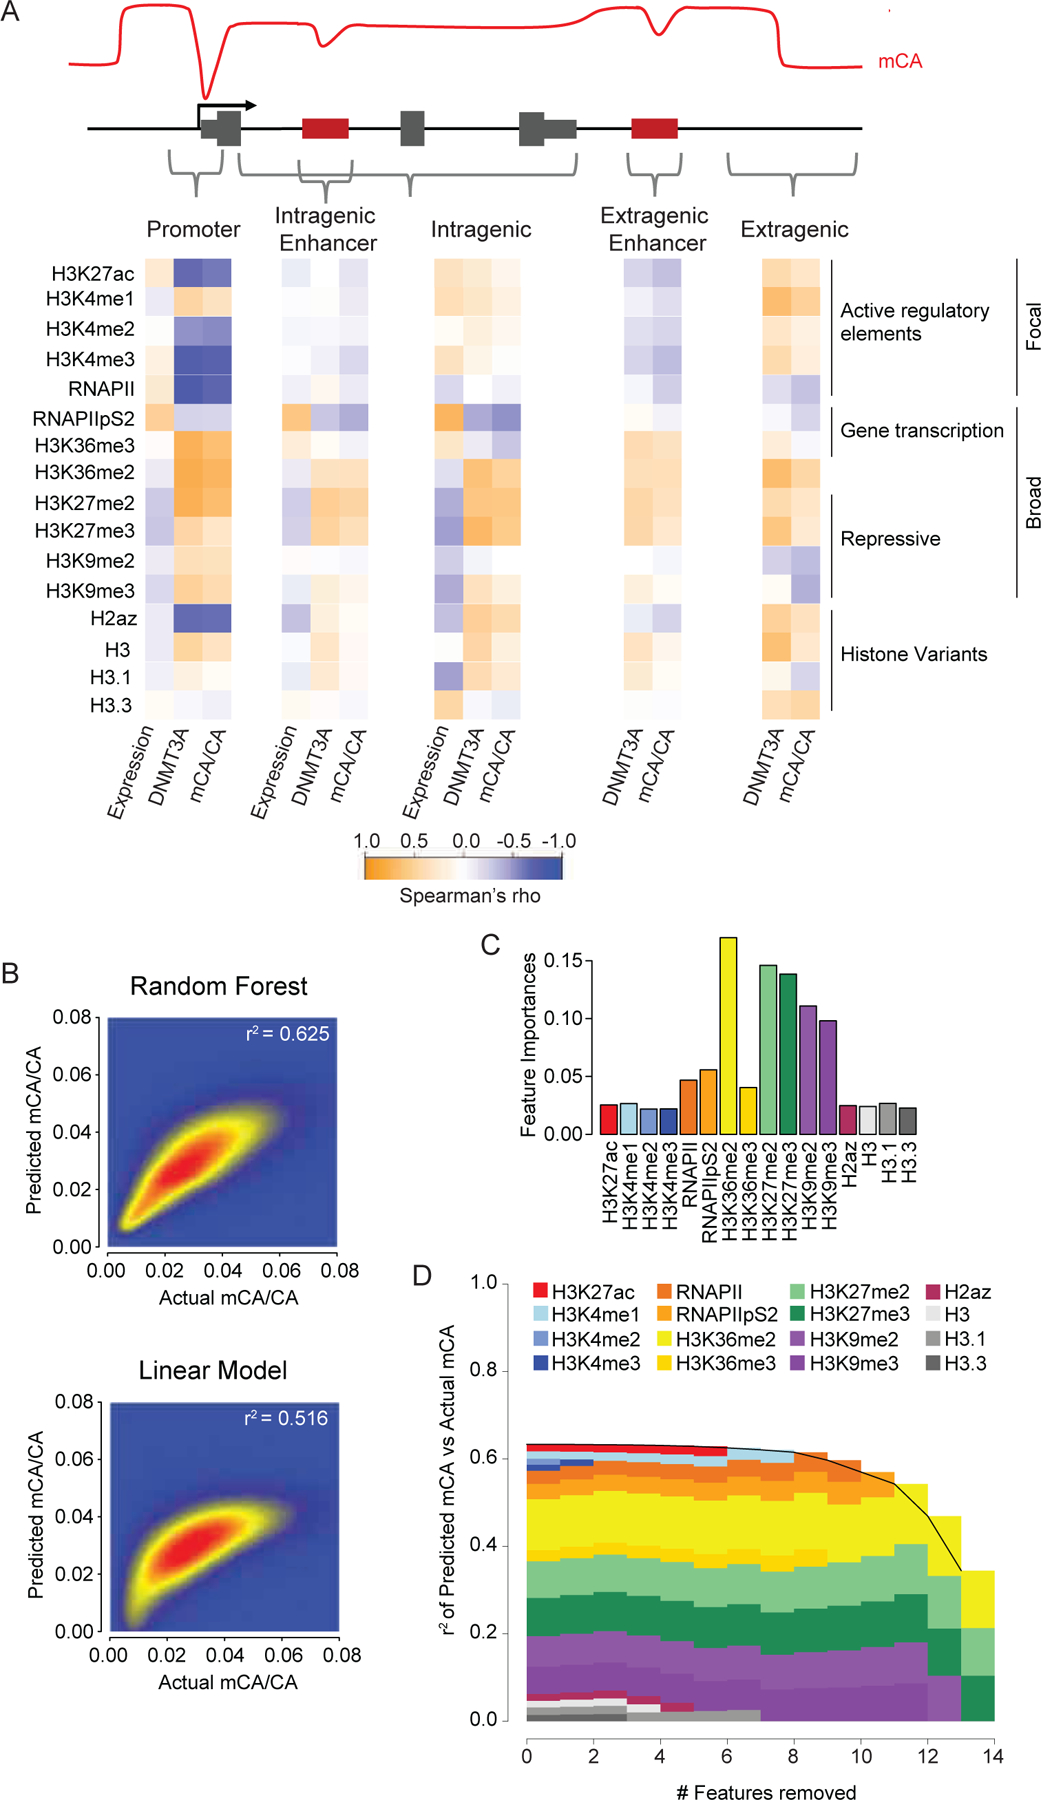
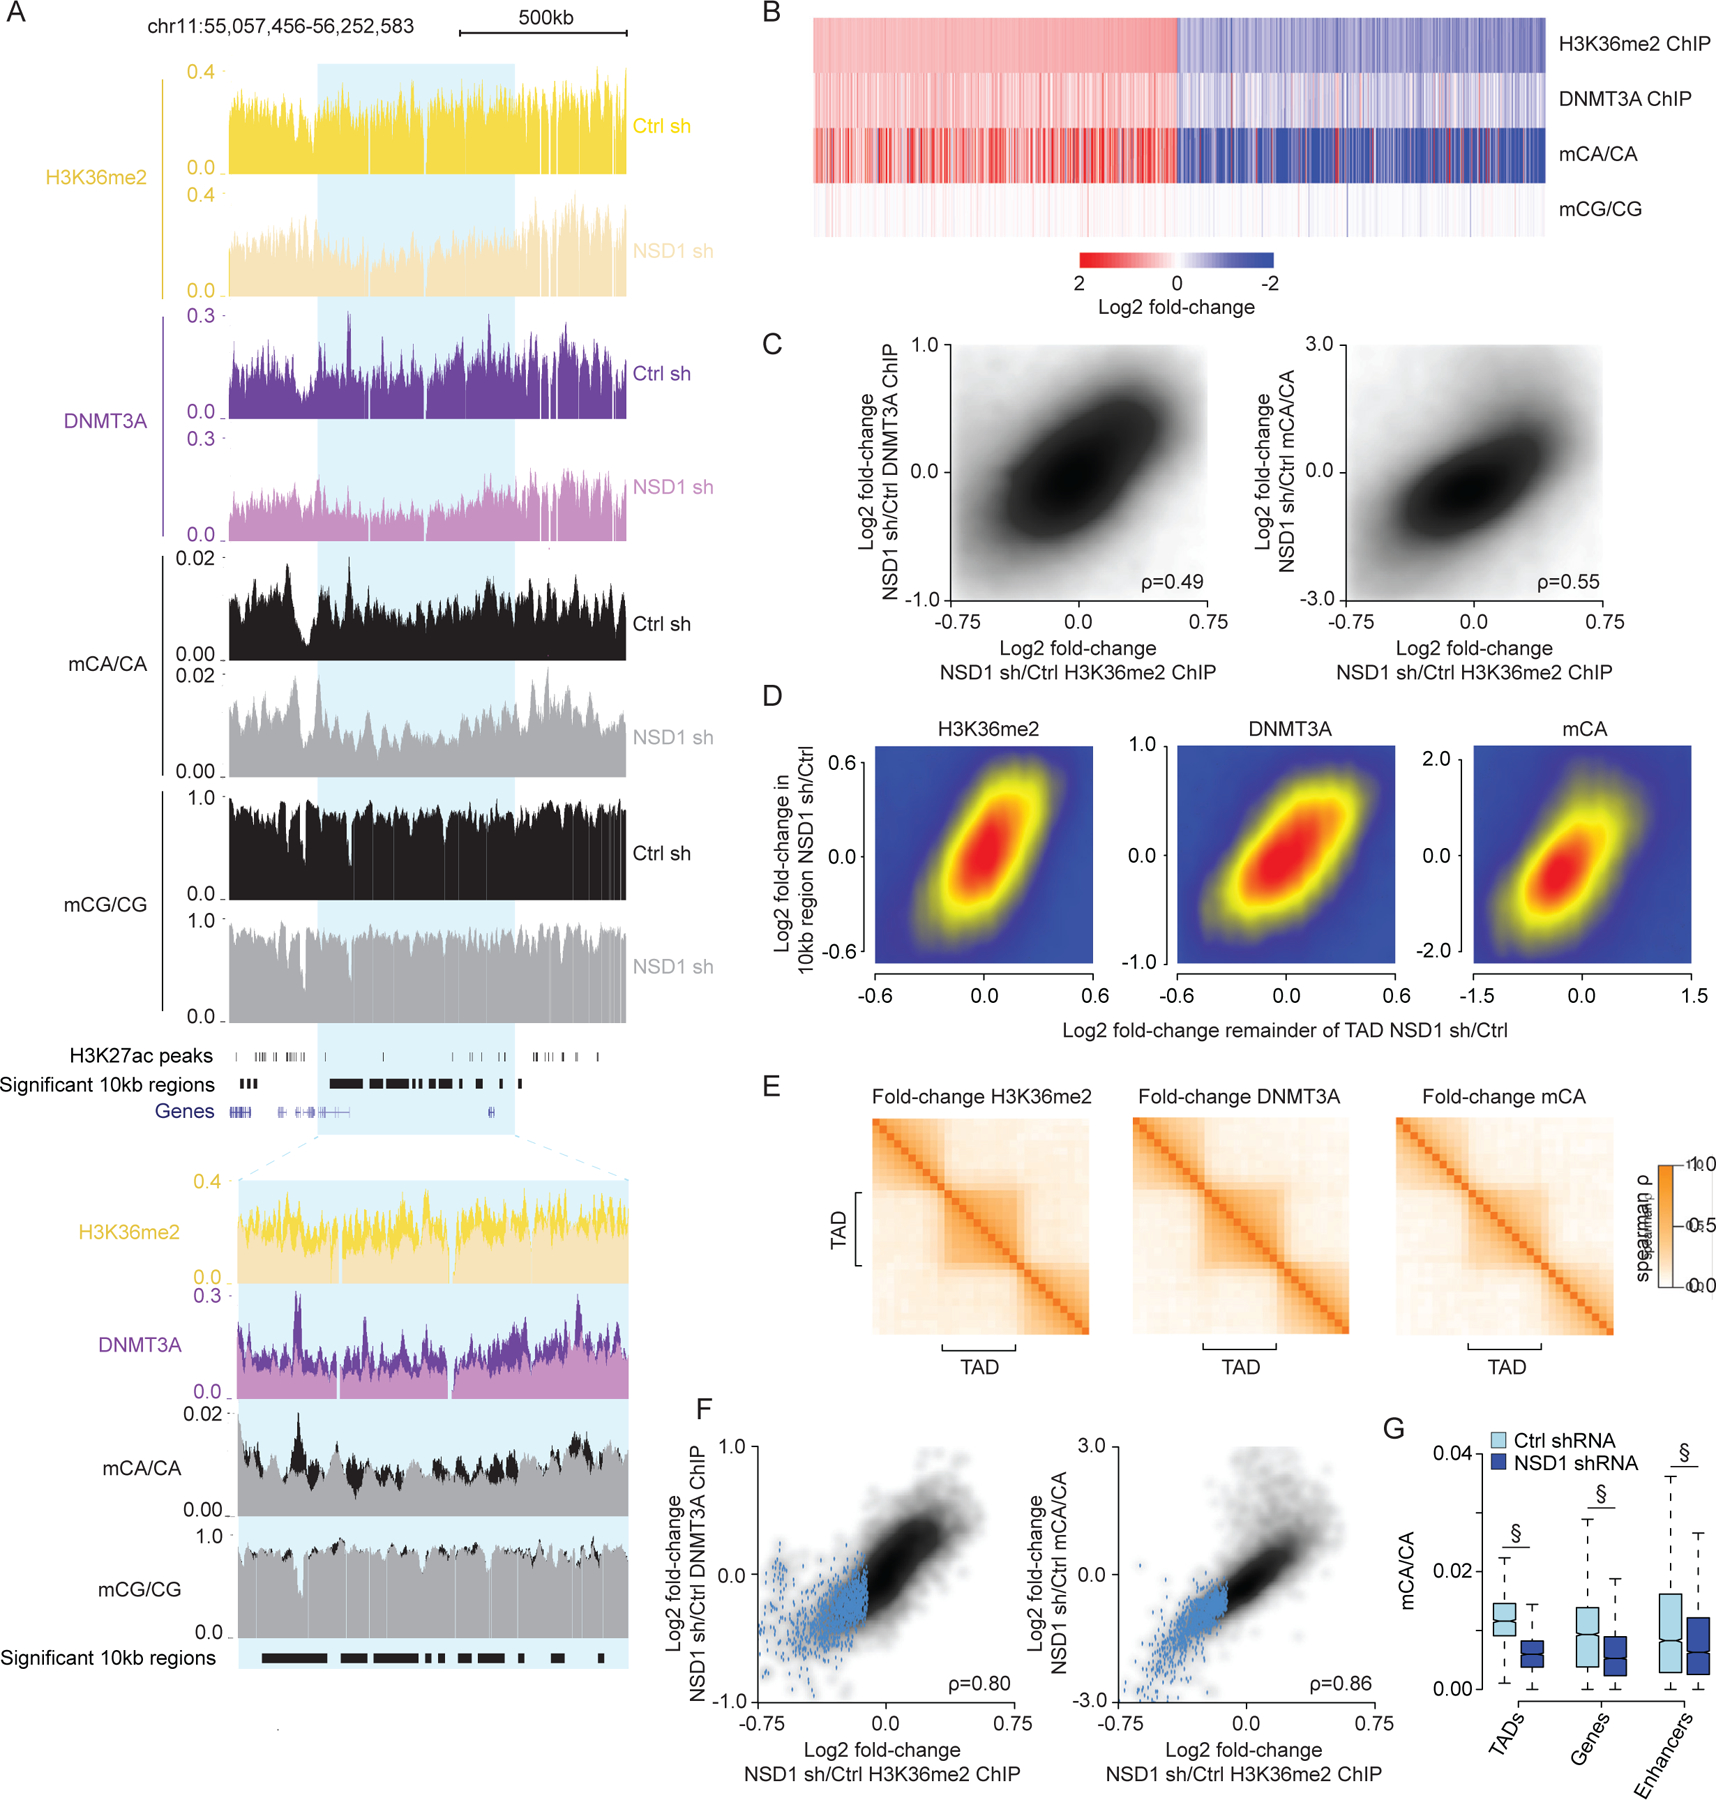
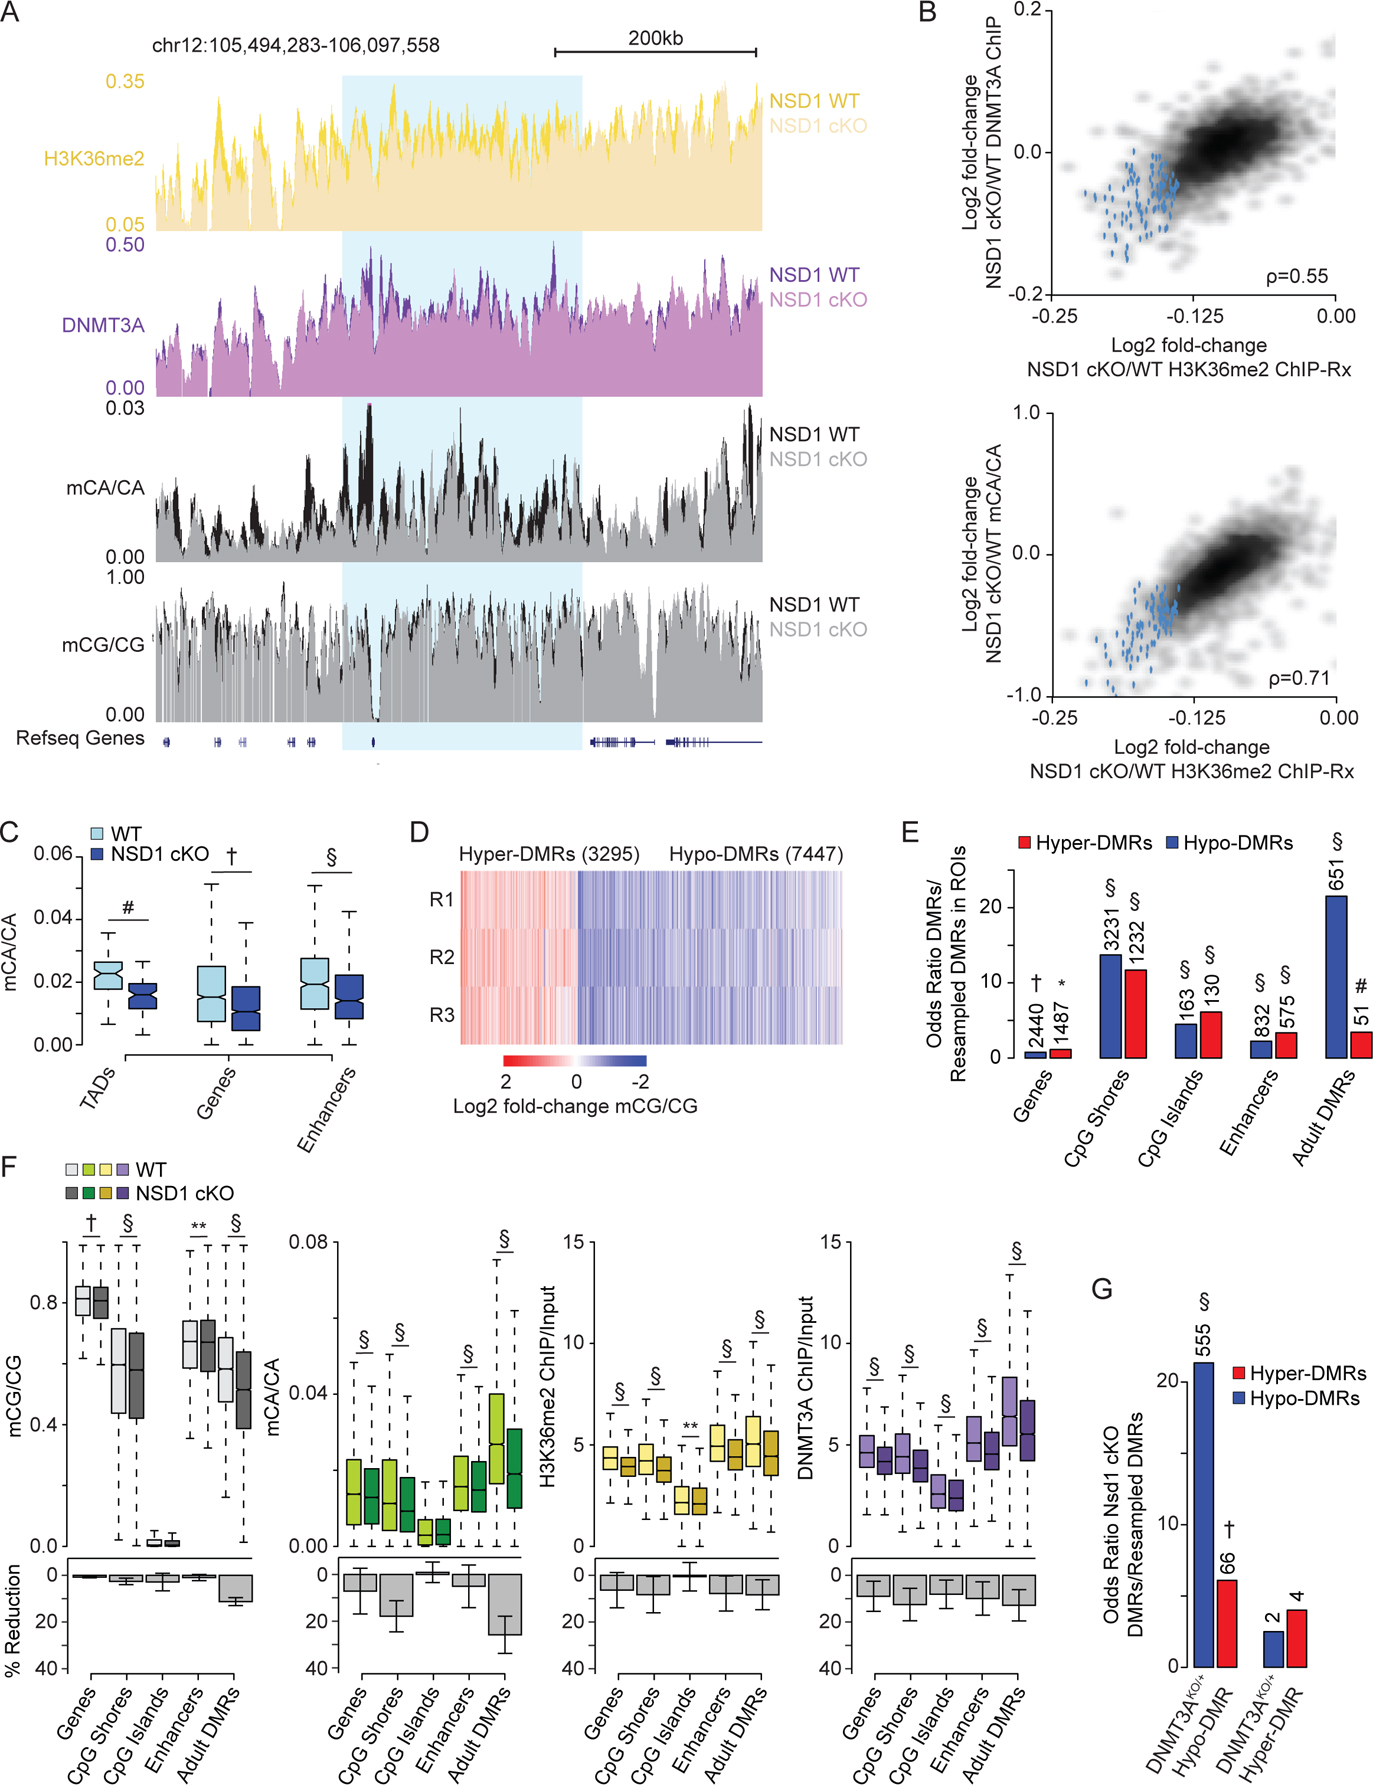
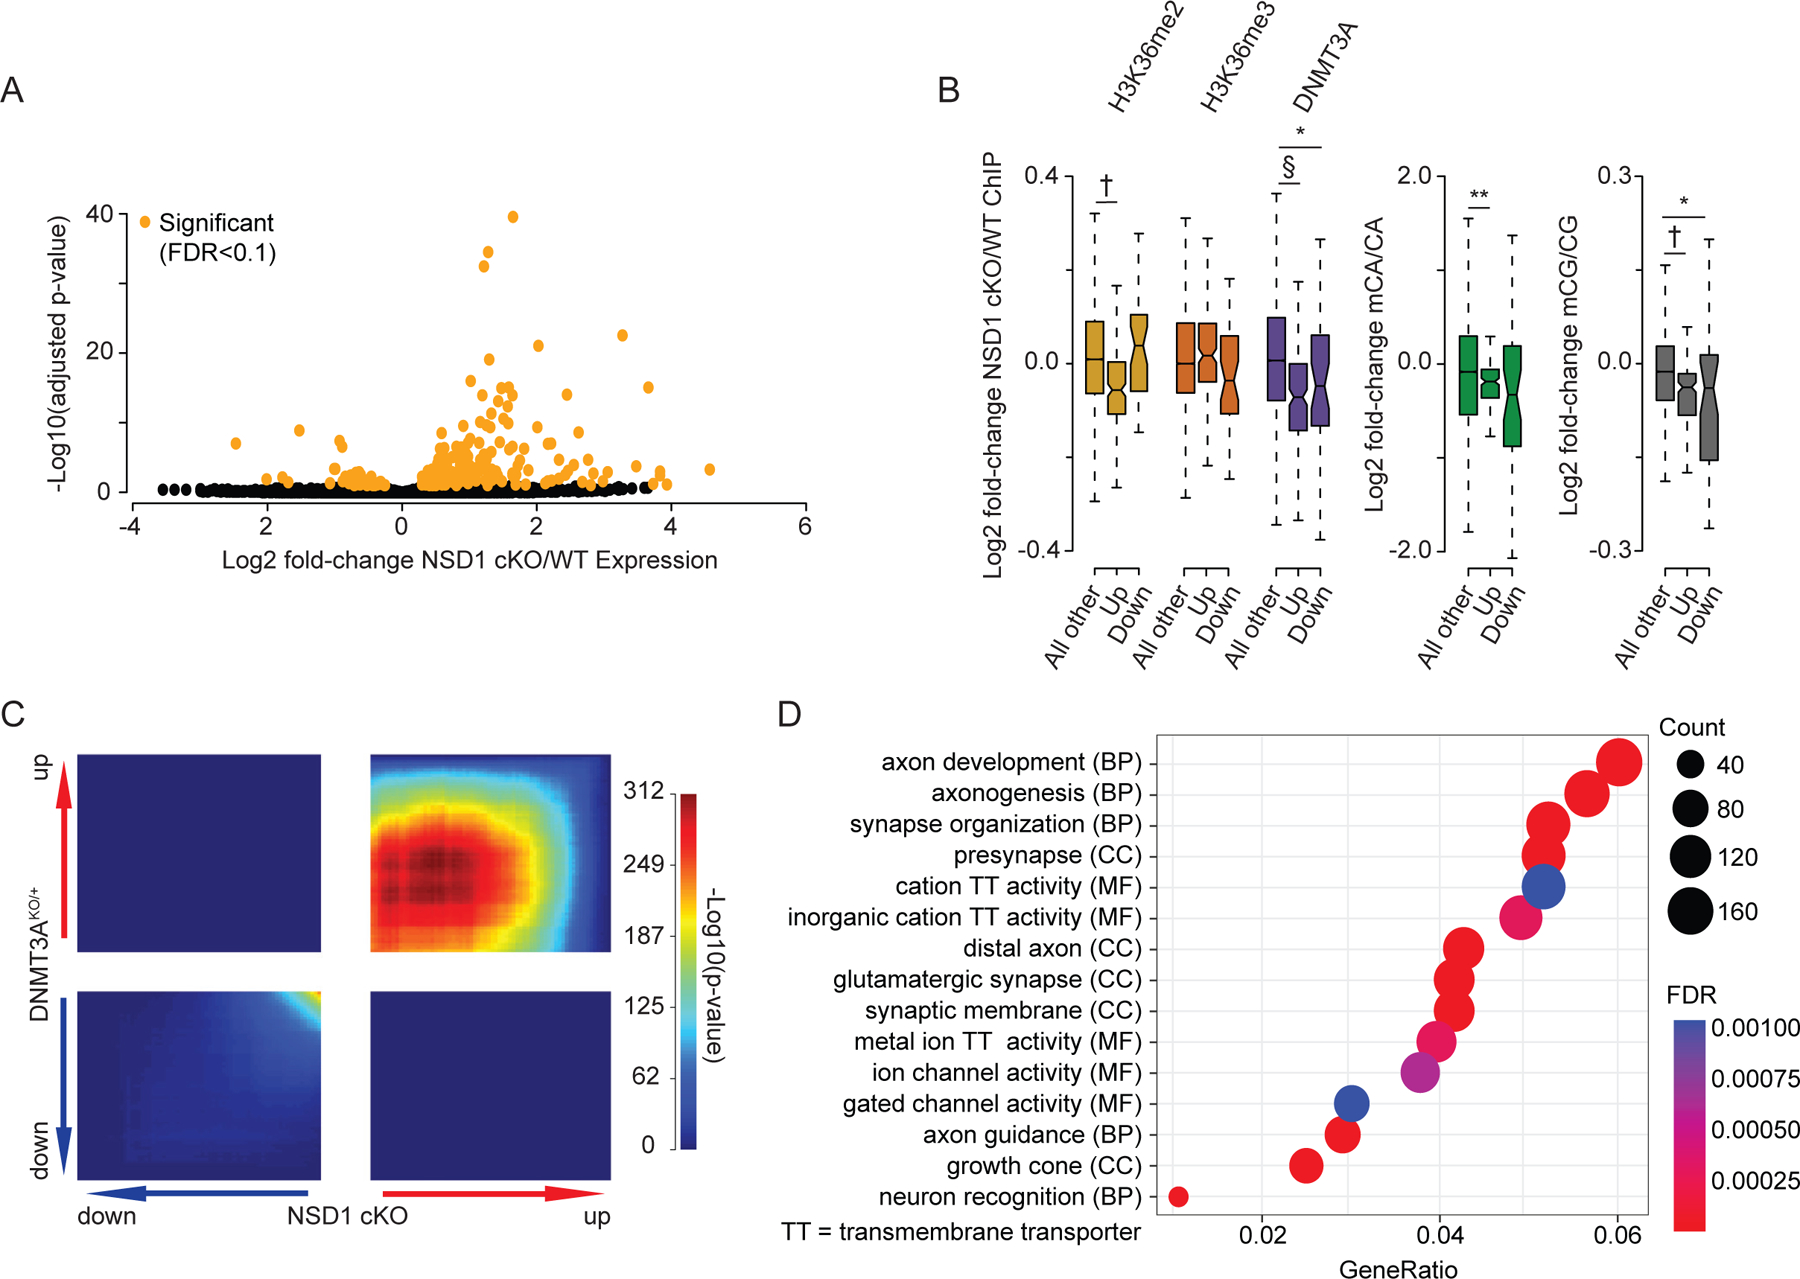
During postnatal development, the DNA methyltransferase DNMT3A deposits high levels of non-CG cytosine methylation in neurons. This methylation is critical for transcriptional regulation, and loss of this mark is implicated in DNMT3A-associated neurodevelopmental disorders (NDDs). Here, we show in mice that genome topology and gene expression converge to shape histone H3 lysine 36 dimethylation (H3K36me2) profiles, which in turn recruit DNMT3A and pattern neuronal non-CG methylation. We show that NSD1, an H3K36 methyltransferase mutated in NDD, is required for the patterning of megabase-scale H3K36me2 and non-CG methylation in neurons. We find that brain-specific deletion of NSD1 causes altered DNA methylation that overlaps with DNMT3A disorder models to drive convergent dysregulation of key neuronal genes that may underlie shared phenotypes in NSD1- and DNMT3A-associated NDDs. Our findings indicate that H3K36me2 deposited by NSD1 is important for neuronal non-CG DNA methylation and suggest that the H3K36me2-DNMT3A-non-CG-methylation pathway is likely disrupted in NSD1-associated NDDs.

Keywords: DNA methylation; DNMT3A; NSD1; Sotos syndrome; genome topology; histone methylation; neurodevelopmental disease; non-CG methylation.


Conflict of interest statement

Declaration of interests The authors declare no competing interests.

Figures

Figure 1.
Figure 1.
Regional mCA set-points and postnatal gene expression converge to regulate neuronal mCA levels at genes and enhancers. (A) Left, model of DNMT3A-mediated regional mCA deposition in neurons. Mechanisms guiding DNMT3A to deposit TAD-scale mCA and whether this process is disrupted in disease are not known. Right, postnatal gene expression antagonizes DNMT3A-mediated mCA deposition within gene bodies. The degree to which these phenomena interact and how much each contributes to mCA patterning is not known. (B) Genome browser view of total RNA-seq and DNA methylation from 2- and 8-week wildtype cerebral cortex, respectively. Red: broad genomic regions with high and low mCA levels. Blue: genes displaying expression-associated mCA depletion. In contrast to mCA, mCG shows little variation on a megabase-scale (see also, Figure S1). (C) Left, browser view of mCA and RNA-seq from wildtype cerebral cortex at Qk and MeCP2, two genes with similar expression levels but differing TAD mCA setpoints. Right, quantification shows different gene body mCA levels in the two genes despite similar magnitude of gene body depletion relative to mCA levels in the surrounding TAD. (D) Scatterplots showing correlation between TAD mCA level, gene body mCA, and postnatal gene expression. (E) Left, browser showing mCA, RNA-seq, and H3K27ac ChIP-seq from wildtype cerebral cortex at the Zfp148 gene. Putative active enhancers (blue) were defined as peaks that contain H3K27ac and do not overlap with promoter H3K4me3 peaks. Right, quantification of TAD mCA level, and extragenic and intragenic enhancer mCA levels. Enhancer mCA depletion relative to the TAD mCA level occurs at intragenic enhancers in this highly expressed gene. (F) Scatterplots showing correlation between TAD mCA level, intragenic enhancer mCA level, and gene expression. Data are wild-type 2-week cortex RNA-seq. 8-week cortex DNA methylation and H3K27ac ChIP-seq.
Figure 2.
Figure 2.
H3K36me2 profiles predict neuronal mCA in the postnatal cerebral cortex. (A) Top, genome browser view of DNA methylation, ChIP-seq, and RNA-seq from wildtype cerebral cortex illustrating megabase-scale fluctuations in H3K36me2, DNMT3A binding, and mCA accumulation. Bottom, browser view of two differentially expressed genes showing distinct H3K36me2 and H3K36me3 signals corresponding to differences in DNMT3A binding and mCA. (B) Aggregate mCA, DNMT3A, and H3K36me2 levels at genes and enhancers across quintiles of TADs sorted by regional mCA levels. (C) Comparison of H3K36me2 and mCA/CA at TADs, enhancers, and genes, showing genome-wide correlations for these signals. (D) Aggregate mCA, DNMT3A, H3K36me2, H3K36me3 levels at genes and intragenic enhancers across genes sorted by RNA expression quintiles. Data are from wildtype cerebral cortex; n = 2–3 bioreplicates for 2-week H3K36me2 and DNMT3A ChIP-seq. 2-week RNA-seq data. 2-week H3K36me3 and 8-week DNA methylation data.
Figure 3.
Figure 3.
Comparative analysis of chromatin states, DNMT3A binding, and mCA deposition across the neuronal genome. (A) Correlation of histone and RNA polymerase II modification states with DNMT3A binding, mCA, and gene expression across kilobase-scale genomic regions. (B) Smoothscatter showing predictive accuracy of ChIP signals for mCA using a Random Forest algorithm (top) or linear model (bottom) in all 5kb windows genome-wide. (C) Feature importance analysis (see methods) showing relative contribution of chromatin signatures to random forest classifier’s mCA prediction accuracy. (D) Feature elimination analysis (see methods) shows key marks required for accurate random forest classifier mCA prediction. Data are n = 2–3 bioreplicates for 2-week H3K36me2, H3K4me1, H3K4me2, and DNMT3A ChIP-seq from this study. 2-week RNA-seq. 2-week ChIP-seq for all other chromatin marks and 8-week DNA methylation data.
Figure 4.
Figure 4.
NSD1-mediated H3K36me2 is required for TAD-scale DNMT3A targeting and mCA deposition in postmitotic neurons. (A) Genome browser view of DIV 12 ChIP-seq and DIV 18 DNA methylation from primary cortical neurons (PCN). Representative TAD with significantly reduced H3K36me2 upon NSD1 knockdown in blue. Overlap of multiple 10kb bins with significantly reduced H3K36me2 in this significantly altered TAD illustrates concordance of changed signals within TADs. (B) Fold-changes of H3K36me2, DNMT3A, and DNA methylation in shNSD1 transduced PCNs at all 10kb regions identified by edgeR (FDR<0.1) as significantly altered for H3K36me2. (C) Comparison of changes in H3K36me2 to changes in DNMT3A (left) or mCA (right) for 10kb regions genome-wide. (D) Comparison of changes in H3K36me2, DNMT3A, or mCA between 10kb genomic regions and the TAD in which they reside. (E) Cross-correlation analysis of fold-changes in H3K36me2, DNMT3A, and mCA upon NSD1 knockdown for regions inside and outside of TADs across the genome (see methods). Higher correlation of regions found within the same TAD compared to regions across TAD boundaries indicates regions within the same TAD are concordantly affected upon NSD1 loss. (F) Comparison of changes in H3K36me2 to changes in DNMT3A or mCA for each TAD in the genome. TADs with significantly reduced H3K36me2 by edgeR (FDR<0.1) in blue. (G) Boxplots of mCA levels in shCtrl and shNSD1 PCNs at TADs with significantly reduced H3K36me2 (edgeR, FDR <0.1) and kilobase-scale genomic elements that reside within these TADs. (§p < 10−15, Wilcoxon test). Data are from PCNs transduced with shCtrl or shNSD1 on DIV 1 and collected at DIV 12 and DIV 18 for ChIP-seq and WGBS, respectively. Per time point: n = 2–4 bioreplicates for H3K36me2, DNMT3A ChIP, and DNA methylation. TADs are from Hi-C analysis of cortical neurons.
Figure 5.
Figure 5.
Brain-specific loss of NSD1 in vivo leads to epigenetic dysregulation that overlap DNMT3A mutants. (A) Genome browser view of 2-week ChIP-Rx and 8-week DNA methylation from NSD1 cKO and wildtype cerebral cortex. A representative TAD with significantly reduced H3K36me2 in blue. (B) Comparison of changes in H3K36me2 to changes in DNMT3A or mCA for each TAD. TADs with significantly reduced H3K36me2 by edgeR (FDR<0.1) in blue. (C) Boxplots showing mCA levels at TADs with significantly reduced H3K36me2 (edgeR, FDR <0.1) and kilobase-scale genomic elements that reside within these TADs for NSD1 cKO and wildtype cortex. (Wilcoxon test). (D) Fold-change of mCG in three independent replicate pairs at CG-DMRs called in the NSD1 cKO cortex. (E) Odds ratio of overlap of NSD1 cKO CG-DMRs with kilobase-scale genomic regions. Observed number of overlapping regions denoted above (Fisher’s exact test, observed versus resampled DMRs, see methods). (F) Top, DNA methylation, H3K36me2 levels, and DNMT3A binding in NSD1 cKO versus wildtype cortex across kilobase-scale genomic regions. Bottom, mean and SEM percent reduction. (Wilcoxon test). (G) Odds ratio of overlap of NSD1 cKO CG-DMRs with DNMT3AKO/+ CG-DMRs. Observed number of overlapping DMRs denoted above (Fisher’s exact test, observed versus resampled DMRs, see methods). Data are from NSD1 cKO and wildtype cortex. n = 5 for H3K36me2, H3K36me3, DNMT3A ChIP-Rx at 2-weeks. n = 3 for DNA methylation, n = 6 for total RNA-seq at 8-weeks. TADs derived from Hi-C analysis of cortex., *p < 0.05, **p < 0.01, #p < 10−5, †p < 10−10, §p < 10−15.
Figure 6.
Figure 6.
Brain-specific loss of NSD1 in vivo leads to transcriptional changes that overlap DNMT3A mutants. (A) Volcano plot of fold-changes in gene expression of NSD1 cKO versus wildtype cortex RNA-seq. Significant genes by DESeq2 (FDR <0.1) in orange. (B) Fold-changes of H3K36me2, H3K36me3, DNMT3A, and DNA methylation at genes significantly dysregulated (DESeq2, FDR <0.1) in NSD1 cKO RNA-seq. (Wilcoxon test). (C) Rank-rank hypergeometric overlap (RRHO), of transcriptome-wide gene expression changes in the cortex of NSD1 cKO versus DNMT3AKO/+ mice. (D) Top five Gene Ontology terms from “Biological Process”, “Molecular Function”, and “Cellular Components” from RRHO-determined “uu” (upregulated-upregulated) genes from NSD1 cKO and DNMT3AKO/+ mouse cortex using clusterProfiler., Data are from NSD1 cKO and wildtype cortex: 2-weeks, n = 5 for H3K36me2, H3K36me3, DNMT3A ChIP-Rx. 8-weeks, n = 3 for DNA methylation, n = 6 for total RNA-seq. TADs derived from Hi-C analysis of cortex., *p < 0.05, **p < 0.01, #p < 10−5, †p < 10−10, §p < 10−15.

Update of

References

    1. Lister R, Mukamel EA, Nery JR, Urich M, Puddifoot CA, Johnson ND, Lucero J, Huang Y, Dwork AJ, Schultz MD, et al. (2013). Global Epigenomic Reconfiguration During Mammalian Brain Development. Science 341, 1237905. 10.1126/science.1237905. - DOI - PMC - PubMed
    1. Gowher H, and Jeltsch A (2001). Enzymatic properties of recombinant Dnmt3a DNA methyltransferase from mouse: the enzyme modifies DNA in a non-processive manner and also methylates non-CpA sites1 1Edited by J. Karn. J Mol Biol 309, 1201–1208. 10.1006/jmbi.2001.4710. - DOI - PubMed
    1. Gabel HW, Kinde B, Stroud H, Gilbert CS, Harmin DA, Kastan NR, Hemberg M, Ebert DH, and Greenberg ME (2015). Disruption of DNA-methylation-dependent long gene repression in Rett syndrome. Nature 522, 89–93. 10.1038/nature14319. - DOI - PMC - PubMed
    1. Lagger S, Connelly JC, Schweikert G, Webb S, Selfridge J, Ramsahoye BH, Yu M, He C, Sanguinetti G, Sowers LC, et al. (2017). MeCP2 recognizes cytosine methylated tri-nucleotide and di-nucleotide sequences to tune transcription in the mammalian brain. Plos Genet 13, e1006793. 10.1371/journal.pgen.1006793. - DOI - PMC - PubMed
    1. Clemens AW, Wu DY, Moore JR, Christian DL, Zhao G, and Gabel HW (2019). MeCP2 Represses Enhancers through Chromosome Topology-Associated DNA Methylation. Mol Cell 77, 279–293.e8. 10.1016/j.molcel.2019.10.033. - DOI - PMC - PubMed

Publication types