. 2023 Jul 1:164:317-331.
doi: 10.1016/j.actbio.2023.04.029. Epub 2023 Apr 23.

Imaging crossing fibers in mouse, pig, monkey, and human brain using small-angle X-ray scattering

Affiliations

Imaging crossing fibers in mouse, pig, monkey, and human brain using small-angle X-ray scattering

Marios Georgiadis et al. Acta Biomater. .

Abstract

Myelinated axons (nerve fibers) efficiently transmit signals throughout the brain via action potentials. Multiple methods that are sensitive to axon orientations, from microscopy to magnetic resonance imaging, aim to reconstruct the brain's structural connectome. As billions of nerve fibers traverse the brain with various possible geometries at each point, resolving fiber crossings is necessary to generate accurate structural connectivity maps. However, doing so with specificity is a challenging task because signals originating from oriented fibers can be influenced by brain (micro)structures unrelated to myelinated axons. X-ray scattering can specifically probe myelinated axons due to the periodicity of the myelin sheath, which yields distinct peaks in the scattering pattern. Here, we show that small-angle X-ray scattering (SAXS) can be used to detect myelinated, axon-specific fiber crossings. We first demonstrate the capability using strips of human corpus callosum to create artificial double- and triple-crossing fiber geometries, and we then apply the method in mouse, pig, vervet monkey, and human brains. We compare results to polarized light imaging (3D-PLI), tracer experiments, and to outputs from diffusion MRI that sometimes fails to detect crossings. Given its specificity, capability of 3-dimensional sampling and high resolution, SAXS could serve as a ground truth for validating fiber orientations derived using diffusion MRI as well as microscopy-based methods. STATEMENT OF SIGNIFICANCE: To study how the nerve fibers in our brain are interconnected, scientists need to visualize their trajectories, which often cross one another. Here, we show the unique capacity of small-angle X-ray scattering (SAXS) to study these fiber crossings without use of labeling, taking advantage of SAXS's specificity to myelin - the insulating sheath that is wrapped around nerve fibers. We use SAXS to detect double and triple crossing fibers and unveil intricate crossings in mouse, pig, vervet monkey, and human brains. This non-destructive method can uncover complex fiber trajectories and validate other less specific imaging methods (e.g., MRI or microscopy), towards accurate mapping of neuronal connectivity in the animal and human brain.

Keywords: Animal and human brain; Crossing fibers; Diffusion MRI; Fiber orientation mapping; Human hippocampus; Imaging myelinated axons; Mouse/pig/vervet monkey brain; Scanning small-angle X-ray scattering (SAXS).


Conflict of interest statement

Declaration of Competing Interest The authors declare that they have no known competing financial interests or personal relationships that could have appeared to influence the work reported in this paper.

Figures

Fig. 1.
Fig. 1.. Detecting myelinated axon orientations using X-ray scattering.
(A) Schematic of experimental setup in the synchrotron beamline. The monochromatic X-ray beam impinges the thin section and photons are scattered at small angles according to their interactions with the sample’s nanostructure and captured by an area detector. (B) Principle of detecting (crossing) orientations: schematics (left side) and real data (right side) for single (upper panel) and crossing fibers (lower panel). The X-ray photons interact with the periodic myelin layers (left) and produce peaks in the resulting scattering pattern (middle). The radial position (distance from the pattern center, q) of the peak depends on the myelin layer periodicity d (q = 2π/d), while the azimuthal position depends on the axonal orientations (with photons being scattered at a plane perpendicular to the axon orientation, cf. Georgiadis et al. [22]). To extract exact axonal orientation, the azimuthal profile of the myelin signal across a ring (circumscribed by red dotted lines in the upper scattering pattern sketch) is plotted on the right. The peaks are subsequently identified using the SLIX software (Reuter and Menzel [32]). The position of the peaks in the x-axis (which are always 180° apart due to the center-symmetry of the pattern) reflects the fiber orientation angle. In the scattering patterns, the center area (where the direct, non-scattered beam lands on the detector) is covered by a beamstop that usually includes a photodiode. In addition, the real scattering patterns (middle right panels) have dark stripes (here in the up-down direction) corresponding to detector gaps that accommodate detector electronics. Moreover, the real scattering patterns include multiple orders of the myelin peak, with higher orders at lower intensities, as expected by Bragg’s law combined with the form factor of the myelin layer.
Fig. 2.
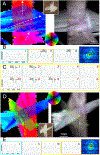
Fig. 2.. Scanning SAXS imaging of fiber orientations in a sample containing artificial 2x and 3x crossings prepared using strips of human corpus callosum.
(A) Crossing of two fiber bundles. Left panel: fiber orientations for each pixel encoded by the pixel’s color, with 4 quadrants per pixel encoding possible multiple orientations as explained in Section 2.3. Right panel: fiber orientations for each pixel are overlaid as colored bars on the azimuthally integrated intensity image, with possible multiple orientations resulting in overlaying bars. Orientation is color-encoded according to the color wheel. Inset: Photo of the fiber strips within the coverslips, with scanned area in red rectangle. (B) Azimuthal intensity profiles (azimuthal scattering intensity across the myelin peak, cf. Fig. 1) for pixels i, ii, and iii, indicated by circles in the right panel of (A). Plot outline colors correspond to the colors of the circles in (A). (C) Azimuthal profiles of 10 subsequent scan points highlighted by yellow rectangle in (A). Profiles show transition from two clearly separate peaks (points 1-2) to one merged peak (points 3-7) and back to two distinct peaks (points 8-10). Data indicate a minimal angle at which SAXS fiber crossings can be identified by the SLIX software of the order of 25-30°. (D) Crossing of three fiber bundles. Left Panel: fiber orientations for each pixel encoded in its color. Right panel: fiber orientations plotted as colored bars. Orientation is encoded by pixel color (left) or bar color (right) according to the color wheel. Inset: Photo of the fiber strips within the coverslips, with scanned area indicated by red rectangle. (E) Azimuthal profiles from select points in (D), with one (cyan), two (magenta), and three (orange & yellow) crossing fibers. As explained in the Methods section, in the colored fiber orientation maps (A), (D) each pixel is split into 4 quadrants, to accommodate 4 possible SLIX-derived fiber orientation colors. For pixels characterized by a single fiber orientation, all 4 quadrants have the same color. For pixels with two crossing fibers, the color of the diagonal quadrants indicates the respective fiber orientations. For pixels with three crossing fibers, 3 quadrants are colorized indicating the respective fiber orientation, while the 4th quadrant is black.
Fig. 3.
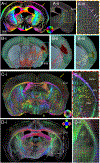
Fig. 3.. Fiber orientations in the mouse brain.
(A) SAXS-based fiber orientation map of a 25 μm-thick section where the fiber orientation is color-encoded according to the color wheel with 4 quadrants per pixel as described in Section 2.3 (A-i), or with orientation-encoded colored bars (A-ii). To facilitate viewing of the image (A-ii), fiber orientations from each 5×5 pixel set are averaged. (A-iii) Expanded view of orange boxed region in (A-ii), where fibers spreading from the internal capsule through the caudoputamen cross the corpus callosum and external capsule (white arrows) to extend radially into the cortex. In addition, cortical radial fibers reach the outermost molecular layer of the cortex and cross with the circumferential myelinated fibers along the brain surface (yellow arrow in A-i). (B) Visualization of the Allen Mouse Brain Connectivity Atlas experiments 297945448-SSs (B-i) and 520728084-SSs (B-ii) (https://connectivity.brain-map.org/projection/experiment/297945448 and https://connectivity.brain-map.org/projection/experiment/520728084), which included injections in the supplemental somatosensory area, showing axons in red and yellow colors respectively from a C57BL/6J mouse tagged with green fluorescent protein. (B-i) Posterior view of the two experiments. (B-ii/B-iii) Enlarged view of the cyan box in (B-i), with the corpus callosum 3D rendered in semi-transparent gray color to enable visualization of the crossing cortical-caudoputamen fibers. Images generated using the Atlas’ 3D viewer (https://connectivity.brain-map.org/3d-viewer). (C) 3D-PLI image showing fiber orientations in a 60 μm-thick mouse brain section, at a plane ~300 μm anterior compared to the section in (A). C-ii is an enlarged view of the red-boxed area in C-i. Yellow arrow points to molecular layer of cortex. (D) Diffusion MRI-derived fiber orientation maps from same mouse and same virtual section as in (A). Fiber orientation distributions are represented by a set of spherical harmonics, allowing multiple fibers per voxel, and are color-encoded according to arrows in top right of (D-i). (D-ii) Enlarged view of white box in D-i, showing no distinguishable corpus callosum crossings. cc: corpus callosum, ic: internal capsule, ec: external capsule, CPu: caudoputamen, SSs: supplemental somatosensory area.
Fig. 4.
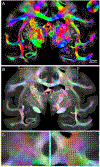
Fig. 4.. SAXS-based fiber orientation analysis in a 100 μm-thick coronal brain section of a female 10-week-old micro-Yucatan minipig containing part of the corona radiata.
(A) Fiber orientation map with color-encoded fiber orientations according to the color wheel (using 4 quadrants per pixel as described in Section 2.3). Oval inset: enlarged view of the encircled corona radiata region of crossing fibers, with the colors appearing in a checkerboard pattern, due to multiple orientations per pixel displayed in the quadrants. (B) Fiber orientations represented by orientation-encoded colored bars for each 2×2 pixel set. Inset: picture of the pig hemisphere section mounted between the two coverslips, with the red rectangle indicating the region scanned. (C) Subregions of the pig section, enlarged from panel (B), containing areas of two and three fiber crossings, with tracts highlighted with white arrows. cc: corpus callosum, ic: internal capsule, ec: external capsule.
Fig. 5.
Fig. 5.. SAXS-based fiber orientation analysis in a 60 μm-thick transverse section of a vervet monkey brain.
(A) Fiber orientation map, with fiber orientations color-encoded according to the color wheel (using 4 quadrants per pixel as explained previously, so crossing fiber areas macroscopically appear gray, but individual colors can be resolved upon closer inspection). (B) Fiber orientations for the same section, represented by orientation-encoded colored bars for each 2×2 pixel set. (C-D) Enlarged views of the left and right corona radiata from the colored bar fiber orientation map in (B). cc: corpus callosum, cr: corona radiata, fx: fornix, cn: caudate nucleus, th: thalamus, ic: internal capsule, cp: cerebral peduncle, ot: optic tract, pt: putamen, ec: external capsule, xc: extreme capsule, hp: hippocampus.
Fig. 6.
Fig. 6.. SAXS-based analysis of crossing fibers in mouse cerebral cortex.
(A-B) Fiber orientation maps of 50 μm-thick section, located ~200 μm anterior to section shown in Fig. 3 (section with scanned region in red rectangle shown in inset). (A) is color-encoded map (using 4 quadrants per pixel as explained in Section 2.3), with (B) being the corresponding color-coded bars representing fiber orientations overlaid on the scattering intensity map. C) Zoom-in of orange-red boxed region in (B), showing white matter fibers radiating from the internal capsule through the caudoputamen and crossing the external capsule fibers (in regions of white arrows) towards the lateral cortex. D) Enlarged view of yellow boxed region in (B), including part of the cortex, the corpus callosum and the cingulum. Fibers radiating out of each region of the corpus callosum towards the cortex, are depicted by the blue, cyan and green arrows. Orientation bars are shown in each pixel in C and D with the nominal image resolution (pixel dimension 50 μm). (E) Diffusion MRI zoomed-in fiber orientation map of the same region as (C), showing mainly the radial fibers (green). Some tangential fibers can also be identified (highlighted by the red ellipse).
Fig. 7.
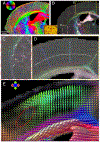
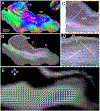
Fig. 7.. Fiber orientation analysis in the human hippocampus.
(A) SAXS fiber orientation map of a 75 μm section, with fiber orientations color-encoded according to the color wheel. (B) The same fiber orientations represented by orientation-encoded colored bars for each 2×2 pixel set. Only main orientation is depicted by adjusting the peak finding parameters (see text here and in Methods Section 2.3). (C) Zoomed-in image of the orange box in (B), showing forniceal tract (fo) fibers running through subiculum. (D) Zoomed-in image of the blue box in (B), depicting both primary and secondary fiber bundles in each pixel. (E) Diffusion MRI fiber orientations of region similar to (D), only showing orientations in white matter, without visible crossing perforant pathway fibers. p: perforant pathway, phg: parahipocampal gyral white matter, se: superficial entorhinal pathway, sub: subiculum, fo: forniceal path, srlm: stratum radiatum lacunosum and moleculare, ef: endfolial pathway, fi: fimbria.

Similar articles

Cited by

References

    1. Morell P, Myelin, 2nd ed., Springer Science+Business Media, New York, 1984, doi:10.1007/978-1-4757-1830-0. - DOI
    1. Sporns O, Tononi G, Kötter R, The human connectome: a structural description of the human brain, PLoS Comput Biol 1 (4) (2005) e42, doi:10.1371/journal.pcbi.0010042. - DOI - PMC - PubMed
    1. Hagmann P, From diffusion MRI to brain connectomics, EPFL (2005).
    1. Azevedo FAC, Carvalho LRB, Grinberg LT, Farfel JM, Ferretti REL, Leite REP, Filho WJ, Lent R, Herculano-Houzel S, Equal numbers of neuronal and nonneuronal cells make the human brain an isometrically scaled-up primate brain, J. Comp. Neurol 513 (5) (2009) 532–541, doi:10.1002/cne.21974. - DOI - PubMed
    1. Tang Y, Nyengaard JR, A stereological method for estimating the total length and size of myelin fibers in human brain white matter, J. Neurosci. Methods 73 (2) (1997) 193–200, doi:10.1016/S0165-0270(97)02228-0. - DOI - PubMed

Publication types