. 2023 Apr 25;21(1):278.
doi: 10.1186/s12967-023-04112-8.

Comprehensive single-cell transcriptomic and proteomic analysis reveals NK cell exhaustion and unique tumor cell evolutionary trajectory in non-keratinizing nasopharyngeal carcinoma

Affiliations

Comprehensive single-cell transcriptomic and proteomic analysis reveals NK cell exhaustion and unique tumor cell evolutionary trajectory in non-keratinizing nasopharyngeal carcinoma

Cuimin Chen et al. J Transl Med. .

Abstract

Background: Nonkeratinizing nasopharyngeal carcinoma (NK-NPC) has a strong association with Epstein-Barr virus (EBV) infection. The role of NK cells and the tumor cell evolutionary trajectory in NK-NPC remain unclear. In this study, we aim to investigate the function of NK cell and the evolutionary trajectory of tumor cells in NK-NPC by single-cell transcriptomic analysis, proteomics and immunohistochemistry.

Methods: NK-NPC (n = 3) and normal nasopharyngeal mucosa cases (n = 3) were collected for proteomic analysis. Single-cell transcriptomic data of NK-NPC (n = 10) and nasopharyngeal lymphatic hyperplasia (NLH, n = 3) were obtained from Gene Expression Omnibus (GSE162025 and GSE150825). Quality control, dimension reduction and clustering were based on Seurat software (v4.0.2) process and batch effects were removed by harmony (v0.1.1) software. Normal cells of nasopharyngeal mucosa and tumor cells of NK-NPC were identified using copykat software (v1.0.8). Cell-cell interactions were explored using CellChat software (v1.4.0). Tumor cell evolutionary trajectory analysis was performed using SCORPIUS software (v1.0.8). Protein and gene function enrichment analyses were performed using clusterProfiler software (v4.2.2).

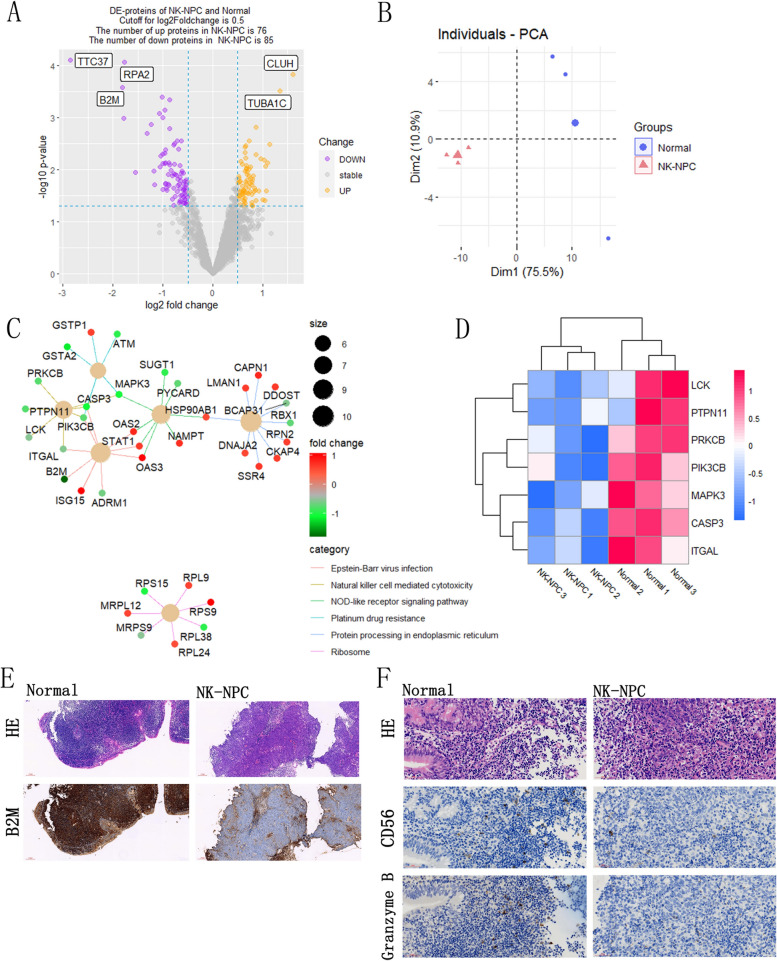
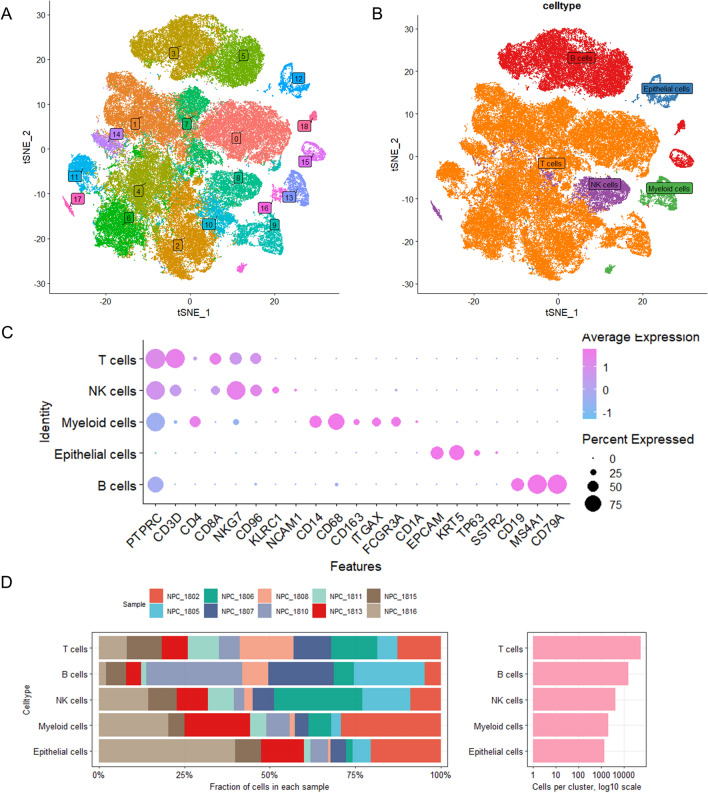
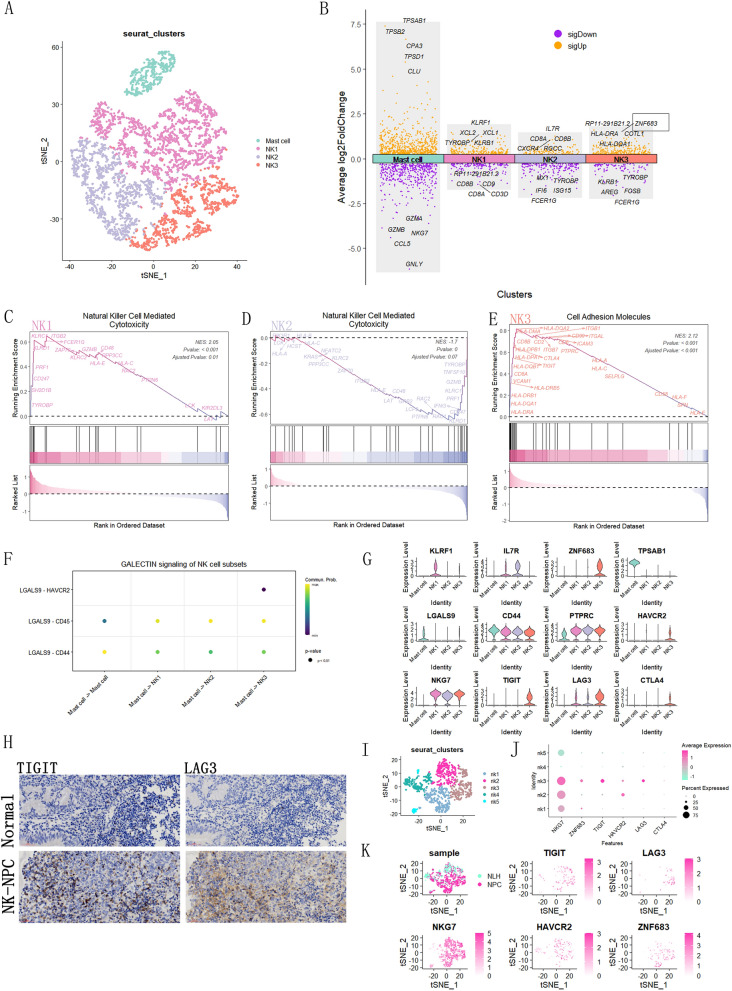
Results: A total of 161 differentially expressed proteins were obtained between NK-NPC (n = 3) and normal nasopharyngeal mucosa (n = 3) by proteomics (log2 fold change > 0.5 and P value < 0.05). Most of proteins associated with the nature killer cell mediated cytotoxicity pathway were downregulated in the NK-NPC group. In single cell transcriptomics, we identified three NK cell subsets (NK1-3), among which NK cell exhaustion was identified in the NK3 subset with high ZNF683 expression (a signature of tissue-resident NK cell) in NK-NPC. We demonstrated the presence of this ZNF683 + NK cell subset in NK-NPC but not in NLH. We also performed immunohistochemical experiments with TIGIT and LAG3 to confirm NK cell exhaustion in NK-NPC. Moreover, the trajectory analysis revealed that the evolutionary trajectory of NK-NPC tumor cells was associated with the status of EBV infection (active or latent). The analysis of cell-cell interactions uncovered a complex network of cellular interactions in NK-NPC.

Conclusions: This study revealed that the NK cell exhaustion might be induced by upregulation of inhibitory receptors on the surface of NK cells in NK-NPC. Treatments for the reversal of NK cell exhaustion may be a promising strategy for NK-NPC. Meanwhile, we identified a unique evolutionary trajectory of tumor cells with active status of EBV-infection in NK-NPC for the first time. Our study may provide new immunotherapeutic targets and new sight of evolutionary trajectory involving tumor genesis, development and metastasis in NK-NPC.

Keywords: EBV; Evolutionary trajectory; NK cell exhaustion; NK-NPC; Proteomics; single-cell RNA sequencing.


Conflict of interest statement

The authors declare that they have no competing interests.

Figures

Fig. 1
Fig. 1
NK-NPC proteomics results. A Volcano plot of differentially expressed proteins (DE-proteins). There are 76 proteins upregulated and 85 proteins downregulated in the NK-NPC group compared to the normal group, where proteins with fold change of log2foldchange > 0.5 and P value < 0.05 were defined as differentially expressed proteins. B The differentially expressed proteins between the 3 NK-NPC and 3 normal nasopharyngeal tissues were well distinguished using Principal Component Analysis (PCA). C KEGG enrichment analysis was performed on 161 differentially expressed proteins. D Protein heatmap showed that the DE-proteins enriched in the nature killer cell mediated cytotoxicity pathway were significantly downregulated in the NK-NPC group, including PRKCB, PTPN11, LCK, ITGAL, PIK3CB, CASP3 and MAPK3. E Representative images of immunohistochemical staining of B2M protein in the normal group and the NK-NPC group. F Representative images of immunohistochemical staining of CD56 and granzyme B in the normal group and the NK-NPC group
Fig. 2
Fig. 2
NK-NPC single cell atlas. A 19 clusters were obtained by dimension reduction and clustering 79,000 cells. B The 19 clusters are identified by their respective marker genes as different types of cells: Epithelial cells, T cells, NK cells, Myeloid cells and B cells. C Marker genes of different types of cells. D A bar graph of the proportion of cell types in each of the 10 samples
Fig. 3
Fig. 3
NK cell subtype analysis and exhaustion landscape. A NK1-3 cell subsets were obtained by dimension reduction and clustering of NK cells. B Marker genes of NK1-3 subsets, sigDown: downregulated genes, sigUp: upregulated genes; The upregulated top5 genes in NK3 subset includes ZNF683. C GSEA results showed that nature killer cell-mediated cytotoxicity was activated in the NK1 subset; NES > 0, activated; NES < 0, inhibited. D GSEA results showed that nature killer cell- mediated cytotoxicity was inhibited in the NK2 subset. E GSEA results showed that cell adhesion molecules was activated in the NK3 subset. F Cell-cell interactions between mast cells and NK1-3 subsets. G Expression of cell exhaustion markers: HAVCR2, TIGIT, LAG3 and CTLA4 in NK1-3 subsets, with NK3 showing the highest expression of TIGIT and LAG3, and partial expression of HAVCR2 and CTLA4. Besides, NK3 showed the highest expression of ZNF683. H Representative images of immunohistochemical staining of TIGIT and LAG3 in the normal nasopharyngeal mucosa tissue and NK-NPC tissue. I NK cells in the GSE150825 dataset were downscaled and clustered into five cell subsets, nk1-5. J The expression of NKG7, ZNF683, TIGIT, HAVCR2, LAG3 and CTLA4 in the nk1-5 subsets, in which a relatively high expression of ZNF683, TIGIT and LAG3 was observed in the nk3 subset in NK-NPC. K The expression of TIGIT, LAG3, NKG7, HAVCR2 and ZNF683 were mapped to nk1-5 subsets, and TIGIT, LAG3 and ZNF683 were mainly expressed in the NK-NPC group, while they were less expressed in the NLH group
Fig. 4
Fig. 4
Analysis of NK-NPC tumor cell subtypes and cellular evolutionary trajectories. A Cell-cell interactions between all cell types about GALECTIN signaling. B Epi1-7 cell subsets were obtained by reduced-dimensional and clustering of Epithelial cells. C The copykat software identifies the benign and malignant epithelial cells, with orange representing copy number increase, blue representing copy number deletion, and gray and black interspersed above representing different chromosomes; pred.aneuploid: malignant; pred.diploid: benign. D The copykat software further identifies malignant tumor cells into two subtypes, tumor subtype1 and tumor subtype2. E The two subtypes, tumor subtype1 and tumor subtype2, were mapped in the TNSE graph. F Expression of LGALS9 and MHC class I molecules in tumor subtype1 and tumor subtype2. G Expression and distribution of KRT5, SSTR2, LMP-1/BNLF2a/b and RPMS1/A73 in tumor subtype1 and tumor subtype2
Fig. 5
Fig. 5
Tumor subtype1 cell evolutionary trajectory and functional enrichment analysis. A Epi T1-4 cell subsets were obtained by dimension reduction and clustering of tumor subtype1 subsets. B The cellular evolutionary trajectory of tumor subtype1: Time from 0 to 1, epithelial cell evolutionary trajectory direction from Epi T1-Epi T4, corresponding to global gene expression changes. Red is high expression and blue is low expression. C Marker genes of Epi T1-4 subsets. sigDown, downregulated genes; sigUp, upregulated genes. D Violin plots showing the expression of KRT5, VIM, SSTR2, LMP-1/BNLF2a/b, RPS18 and RPS23 genes in Epi T1-T4 subsets and the variation changes. E–H GSEA enrichment analysis of the respective marker genes of Epi T1-T4 subsets

References

    1. Chen Y, Chan ATC, Le Q, et al. Nasopharyngeal carcinoma. Lancet. 2019;394(10192):64–80. doi: 10.1016/S0140-6736(19)30956-0. - DOI - PubMed
    1. Wang Y, Chen Y, Zhang Y, et al. Prognostic significance of tumor-infiltrating lymphocytes in nondisseminated nasopharyngeal carcinoma: a large-scale cohort study. Int J Cancer. 2018;142(12):2558–2566. doi: 10.1002/ijc.31279. - DOI - PubMed
    1. Christofides A, Strauss L, Yeo A, et al. The complex role of tumor-infiltrating macrophages. Nat Immunol. 2022;23(8):1148–1156. doi: 10.1038/s41590-022-01267-2. - DOI - PMC - PubMed
    1. Liu Y, He S, Wang XL, et al. Tumour heterogeneity and intercellular networks of nasopharyngeal carcinoma at single cell resolution. Nat Commun. 2021;12(1):741. doi: 10.1038/s41467-021-21043-4. - DOI - PMC - PubMed
    1. Zou W. Mechanistic insights into cancer immunity and immunotherapy. Cell Mol Immunol. 2018;15(5):419–420. doi: 10.1038/s41423-018-0011-5. - DOI - PMC - PubMed

Publication types

MeSH terms