A picture is worth a thousand words: advancing the use of visualization tools in implementation science through process mapping and matrix heat mapping
- PMID: 37098602
- PMCID: PMC10127322
- DOI: 10.1186/s43058-023-00424-4
A picture is worth a thousand words: advancing the use of visualization tools in implementation science through process mapping and matrix heat mapping
Abstract
Background: Identifying key determinants is crucial for improving program implementation and achieving long-term sustainment within healthcare organizations. Organizational-level complexity and heterogeneity across multiple stakeholders can complicate our understanding of program implementation. We describe two data visualization methods used to operationalize implementation success and to consolidate and select implementation factors for further analysis.
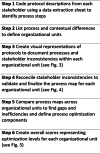
Methods: We used a combination of process mapping and matrix heat mapping to systematically synthesize and visualize qualitative data from 66 stakeholder interviews across nine healthcare organizations, to characterize universal tumor screening programs of all newly diagnosed colorectal and endometrial cancers and understand the influence of contextual factors on implementation. We constructed visual representations of protocols to compare processes and score process optimization components. We also used color-coded matrices to systematically code, summarize, and consolidate contextual data using factors from the Consolidated Framework for Implementation Research (CFIR). Combined scores were visualized in a final data matrix heat map.
Results: Nineteen process maps were created to visually represent each protocol. Process maps identified the following gaps and inefficiencies: inconsistent execution of the protocol, no routine reflex testing, inconsistent referrals after a positive screen, no evidence of data tracking, and a lack of quality assurance measures. These barriers in patient care helped us define five process optimization components and used these to quantify program optimization on a scale from 0 (no program) to 5 (optimized), representing the degree to which a program is implemented and optimally maintained. Combined scores within the final data matrix heat map revealed patterns of contextual factors across optimized programs, non-optimized programs, and organizations with no program.
Conclusions: Process mapping provided an efficient method to visually compare processes including patient flow, provider interactions, and process gaps and inefficiencies across sites, thereby measuring implementation success via optimization scores. Matrix heat mapping proved useful for data visualization and consolidation, resulting in a summary matrix for cross-site comparisons and selection of relevant CFIR factors. Combining these tools enabled a systematic and transparent approach to understanding complex organizational heterogeneity prior to formal coincidence analysis, introducing a stepwise approach to data consolidation and factor selection.
Keywords: Cancer; Consolidated Framework for Implementation Research (CFIR); Data visualization; Implementation; Lynch syndrome; Matrix heat mapping; Optimization; Process mapping; Tumor screening.
© 2023. The Author(s).
Conflict of interest statement
The authors declare that they have no competing interests.
Figures


References
Grants and funding
LinkOut - more resources
Full Text Sources

