. 2023 Jul 7;13(7):1678-1695.
doi: 10.1158/2159-8290.CD-22-1013.

Splicing Factor SRSF1 Promotes Pancreatitis and KRASG12D-Mediated Pancreatic Cancer

Affiliations

Splicing Factor SRSF1 Promotes Pancreatitis and KRASG12D-Mediated Pancreatic Cancer

Ledong Wan et al. Cancer Discov. .

Abstract

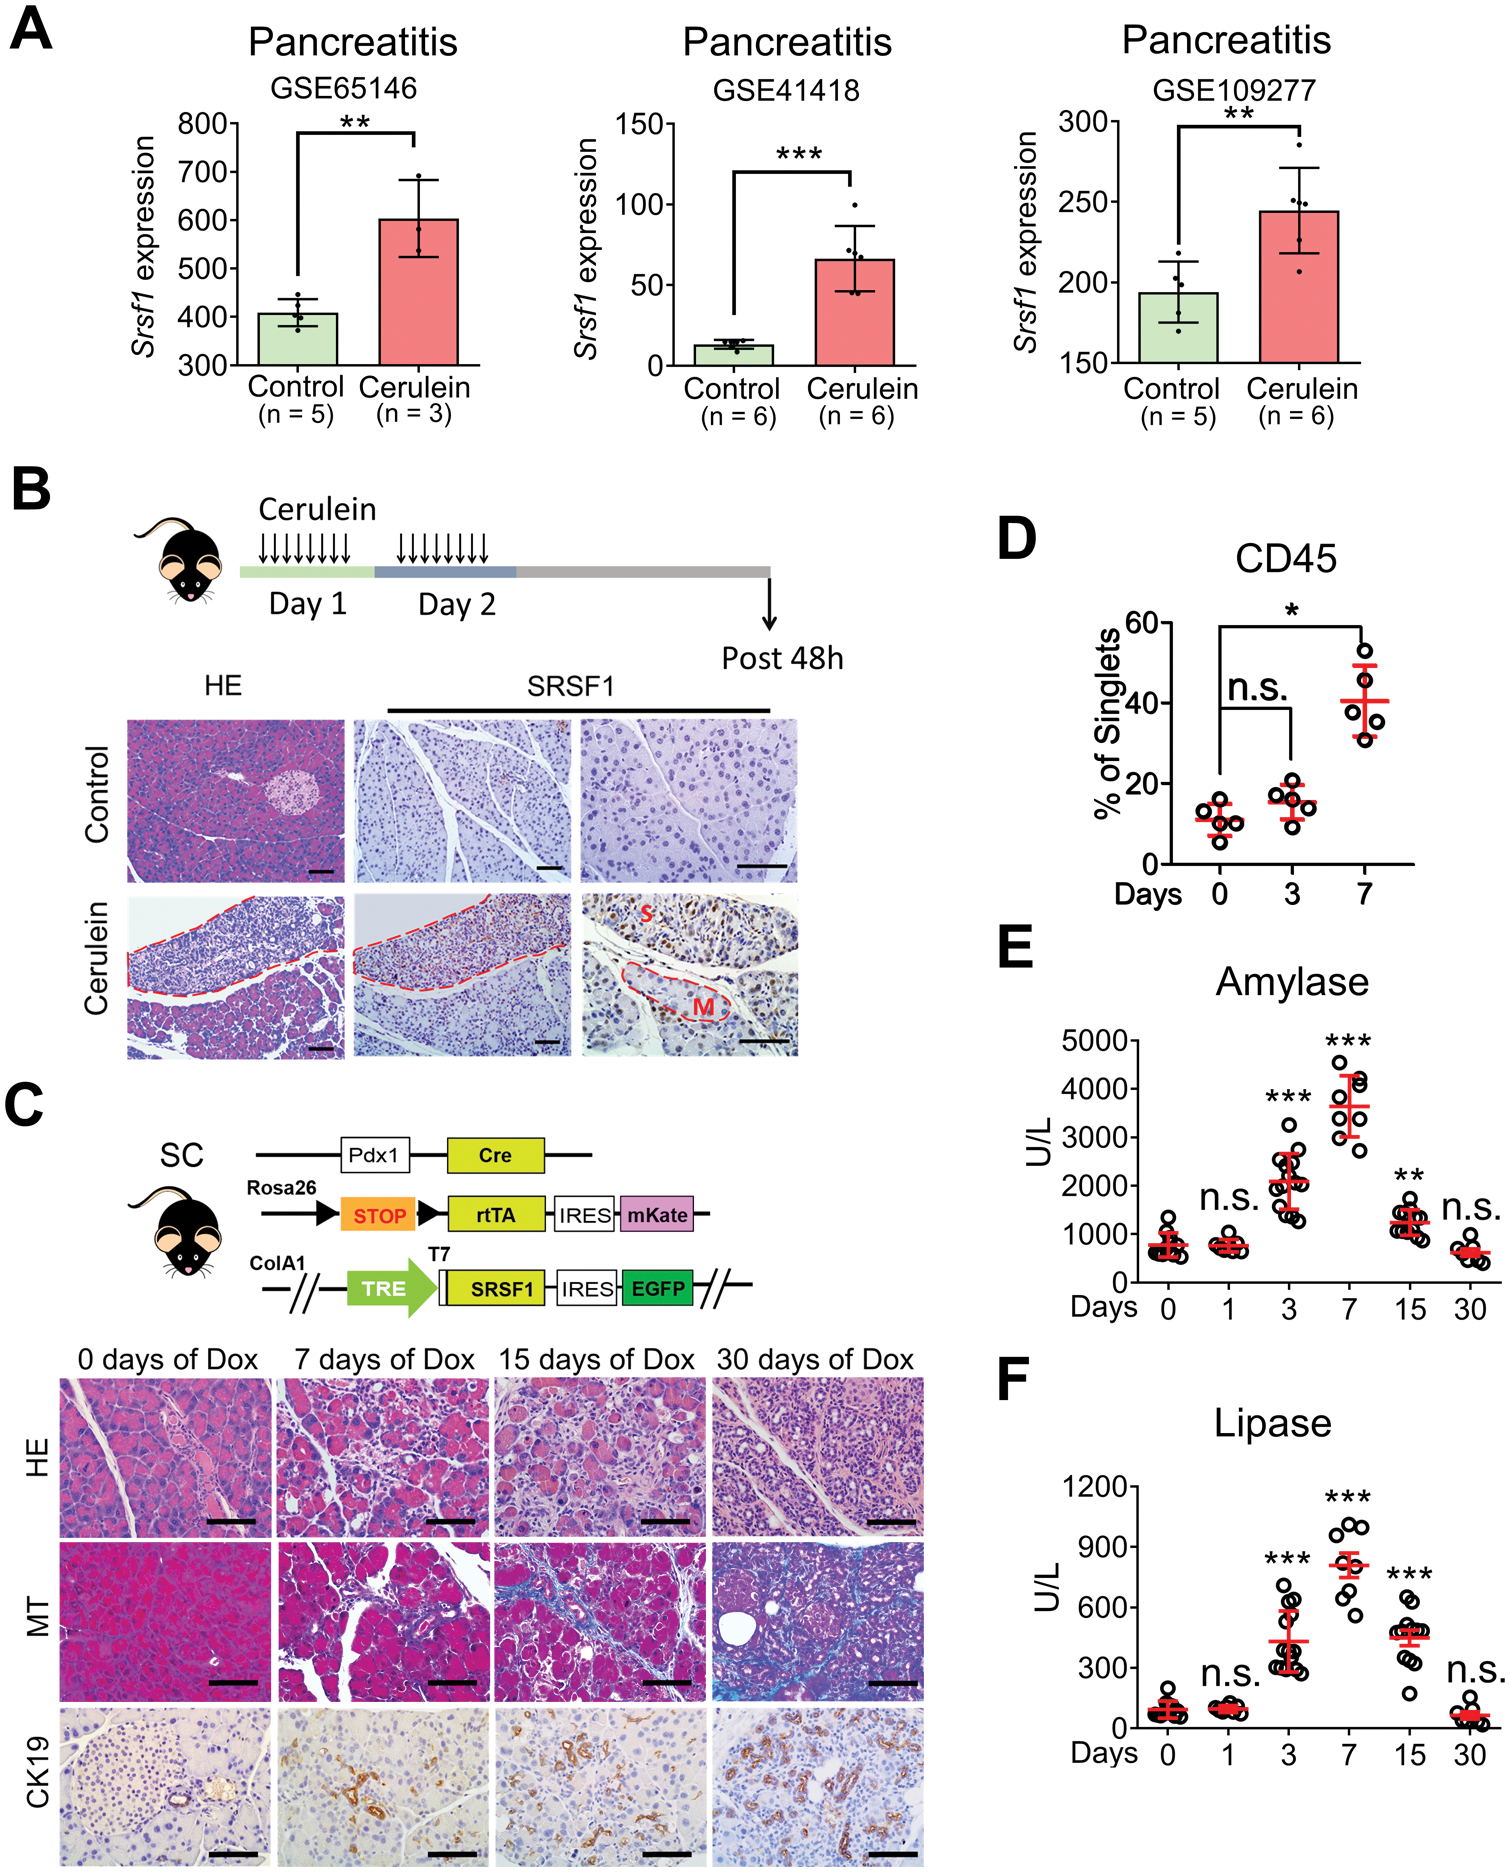
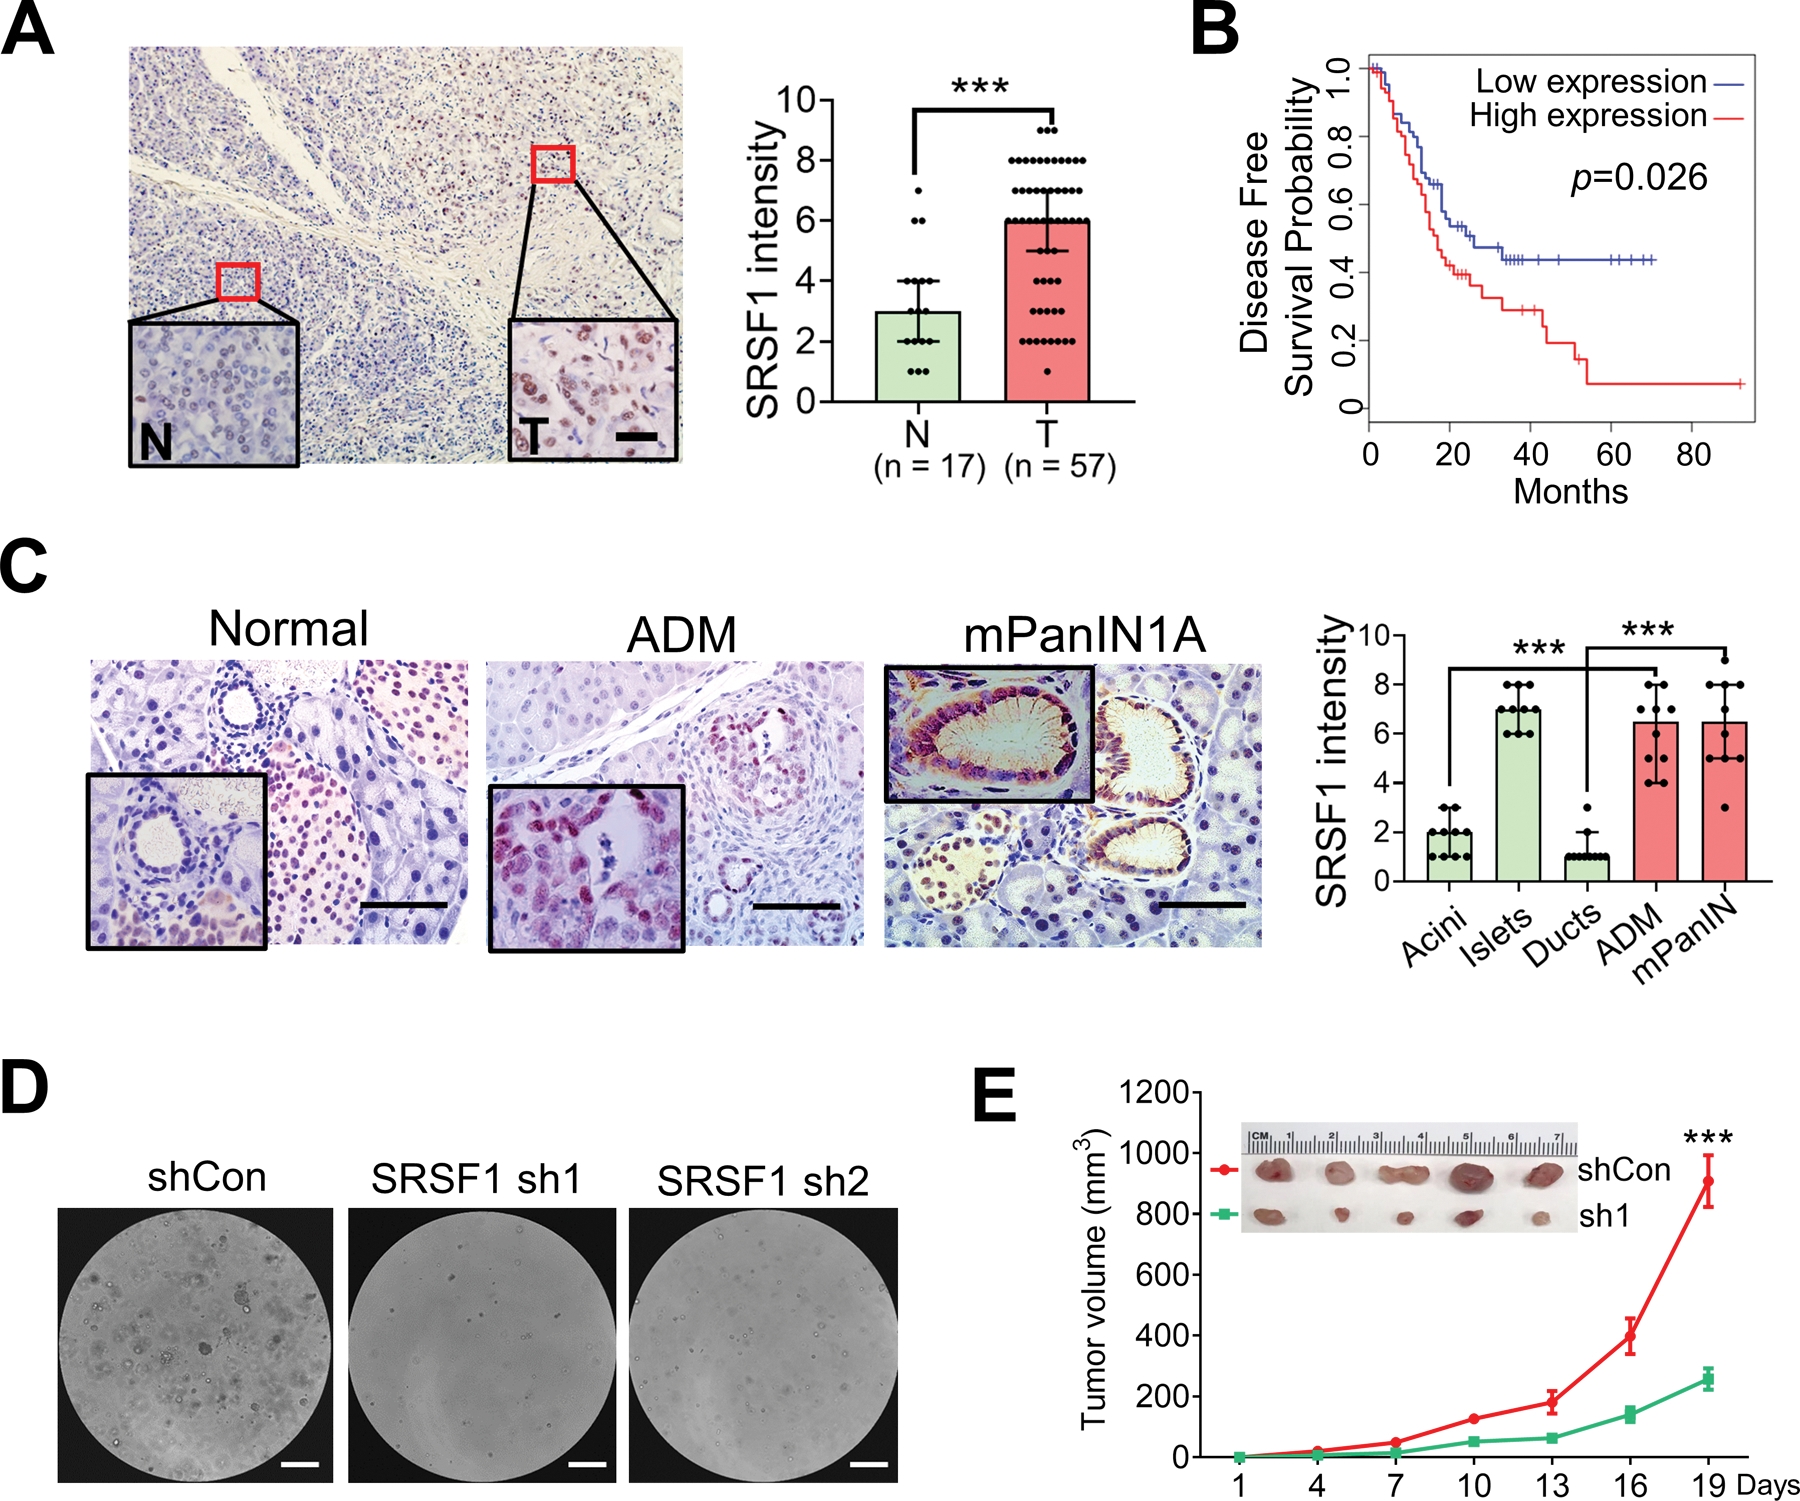
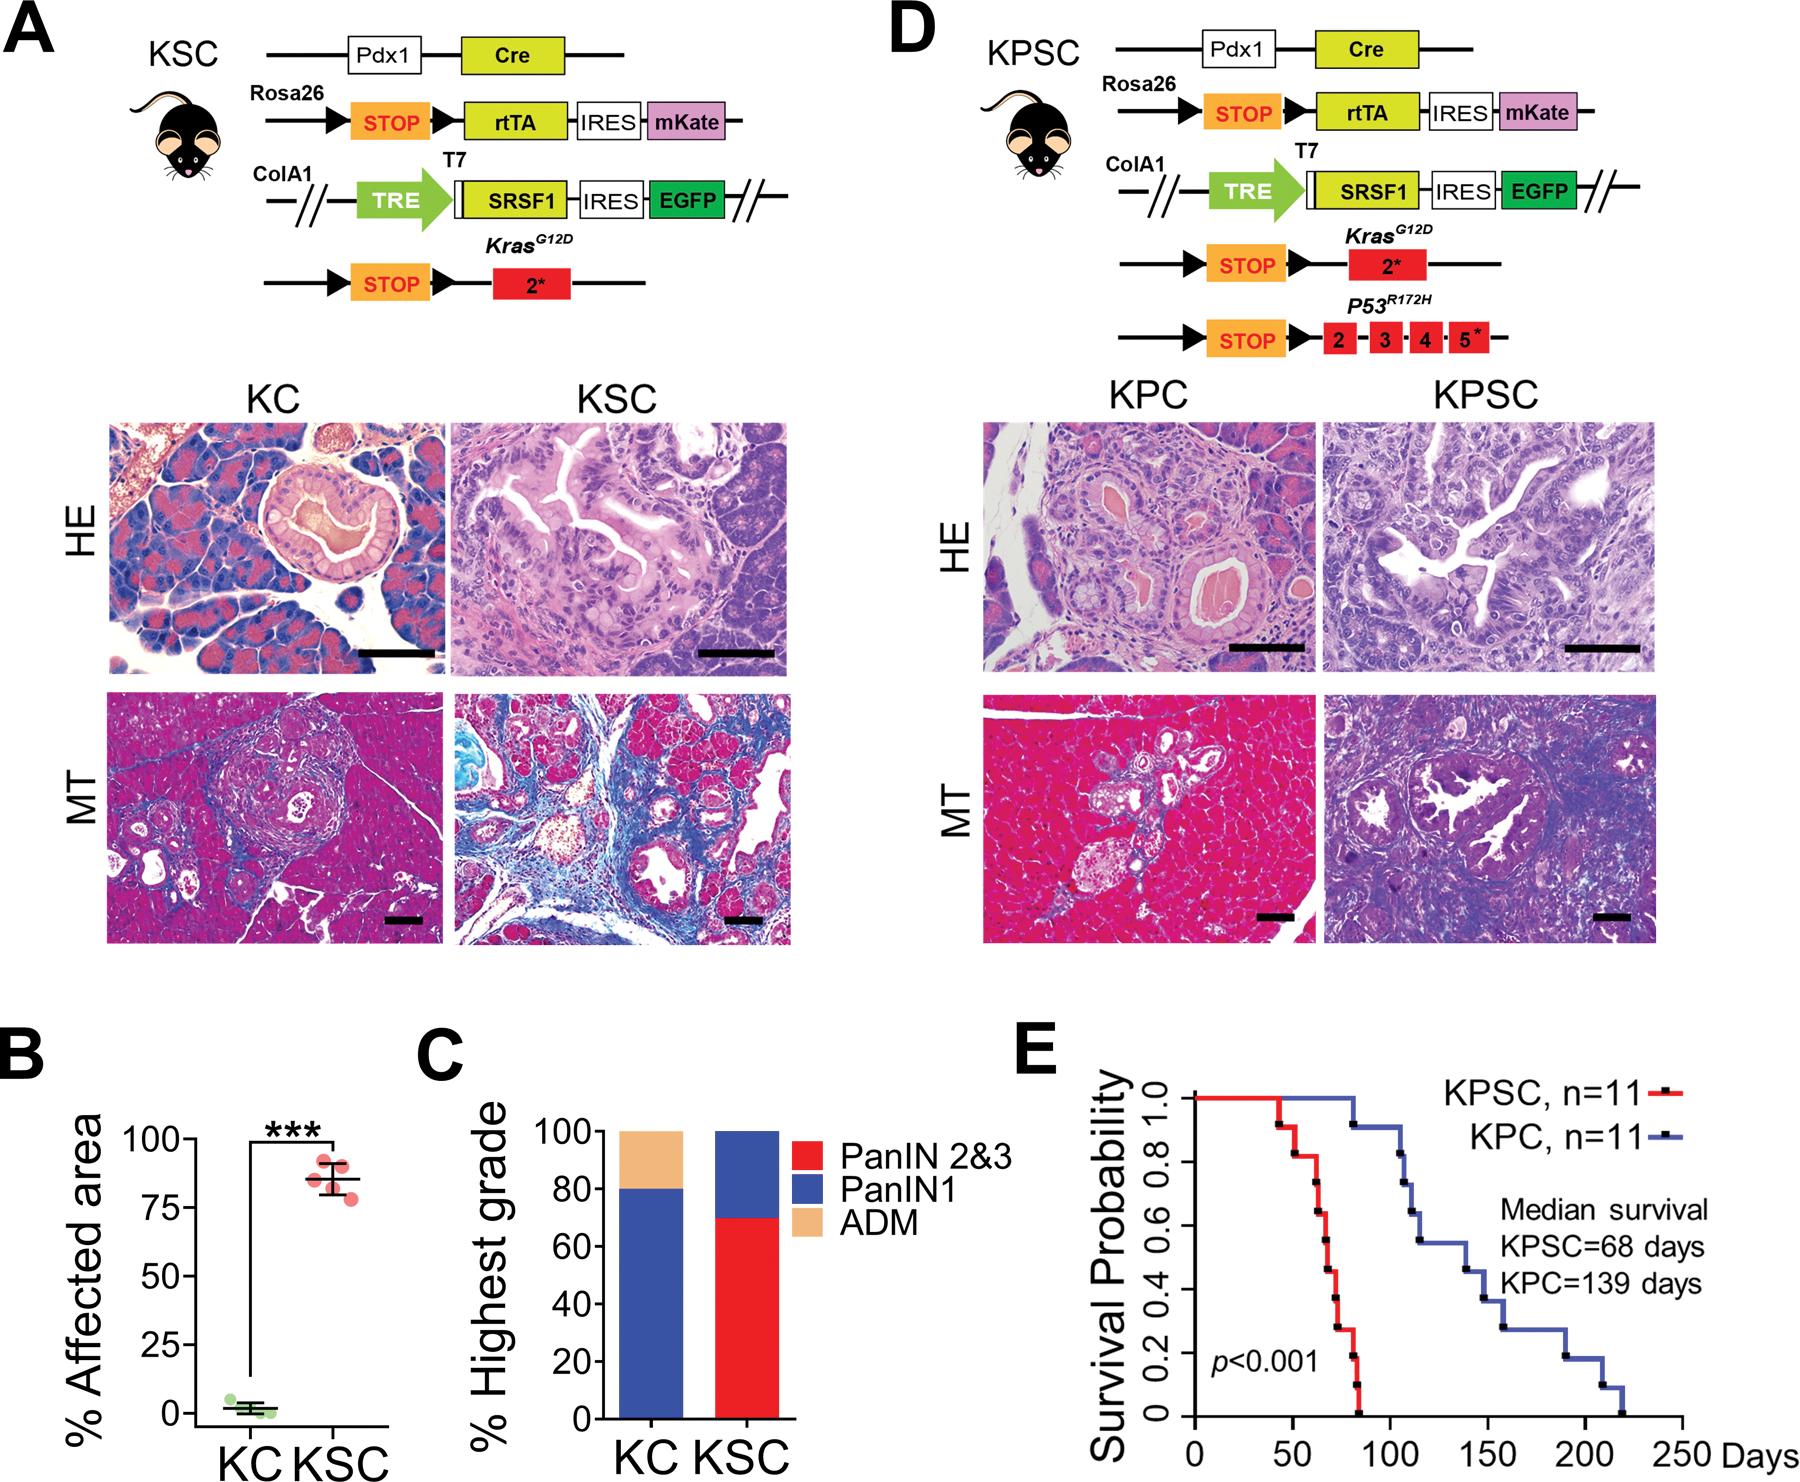
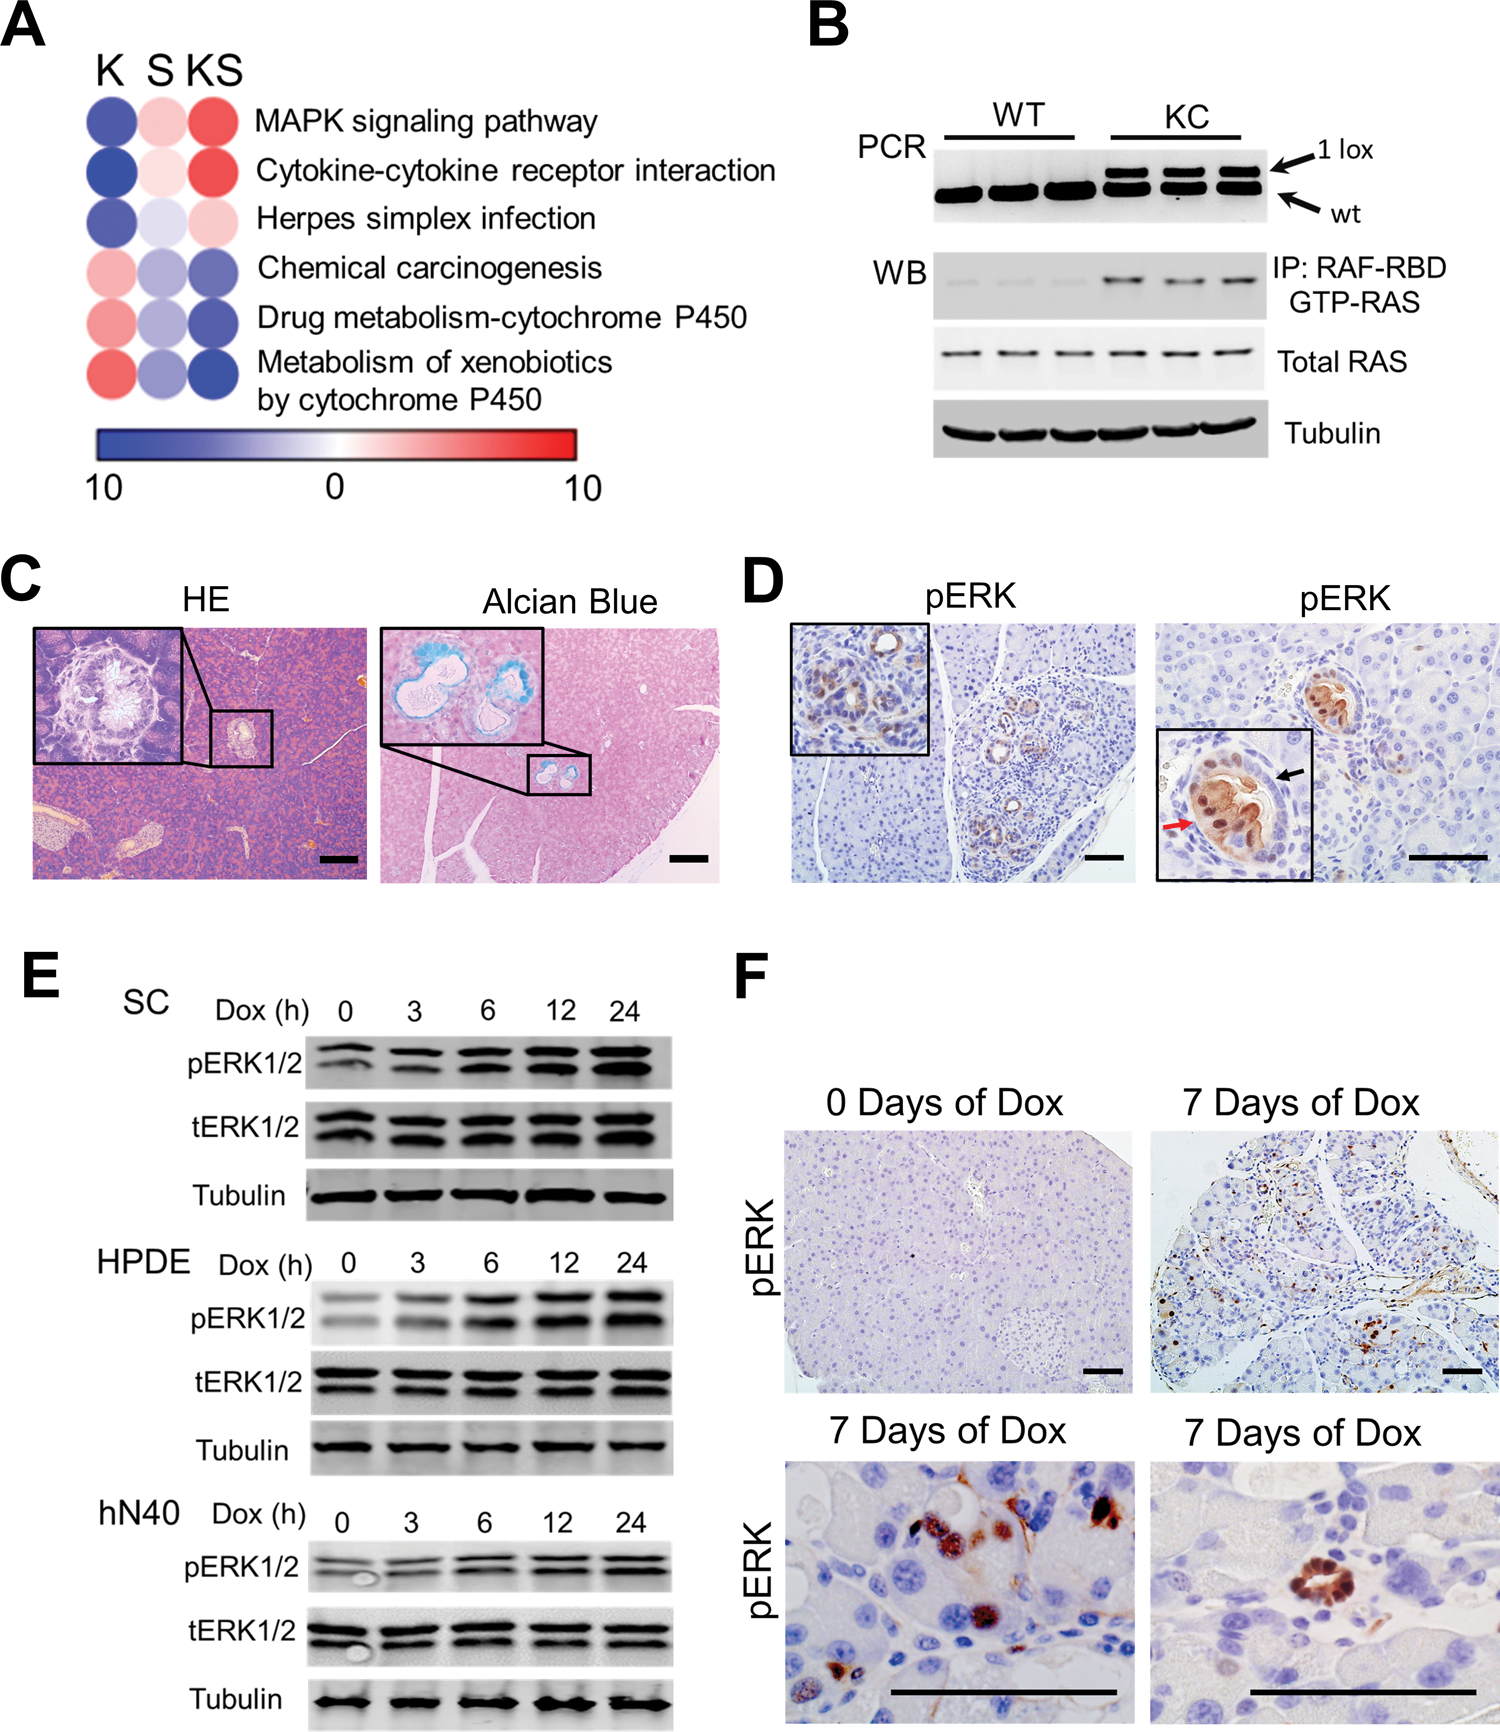
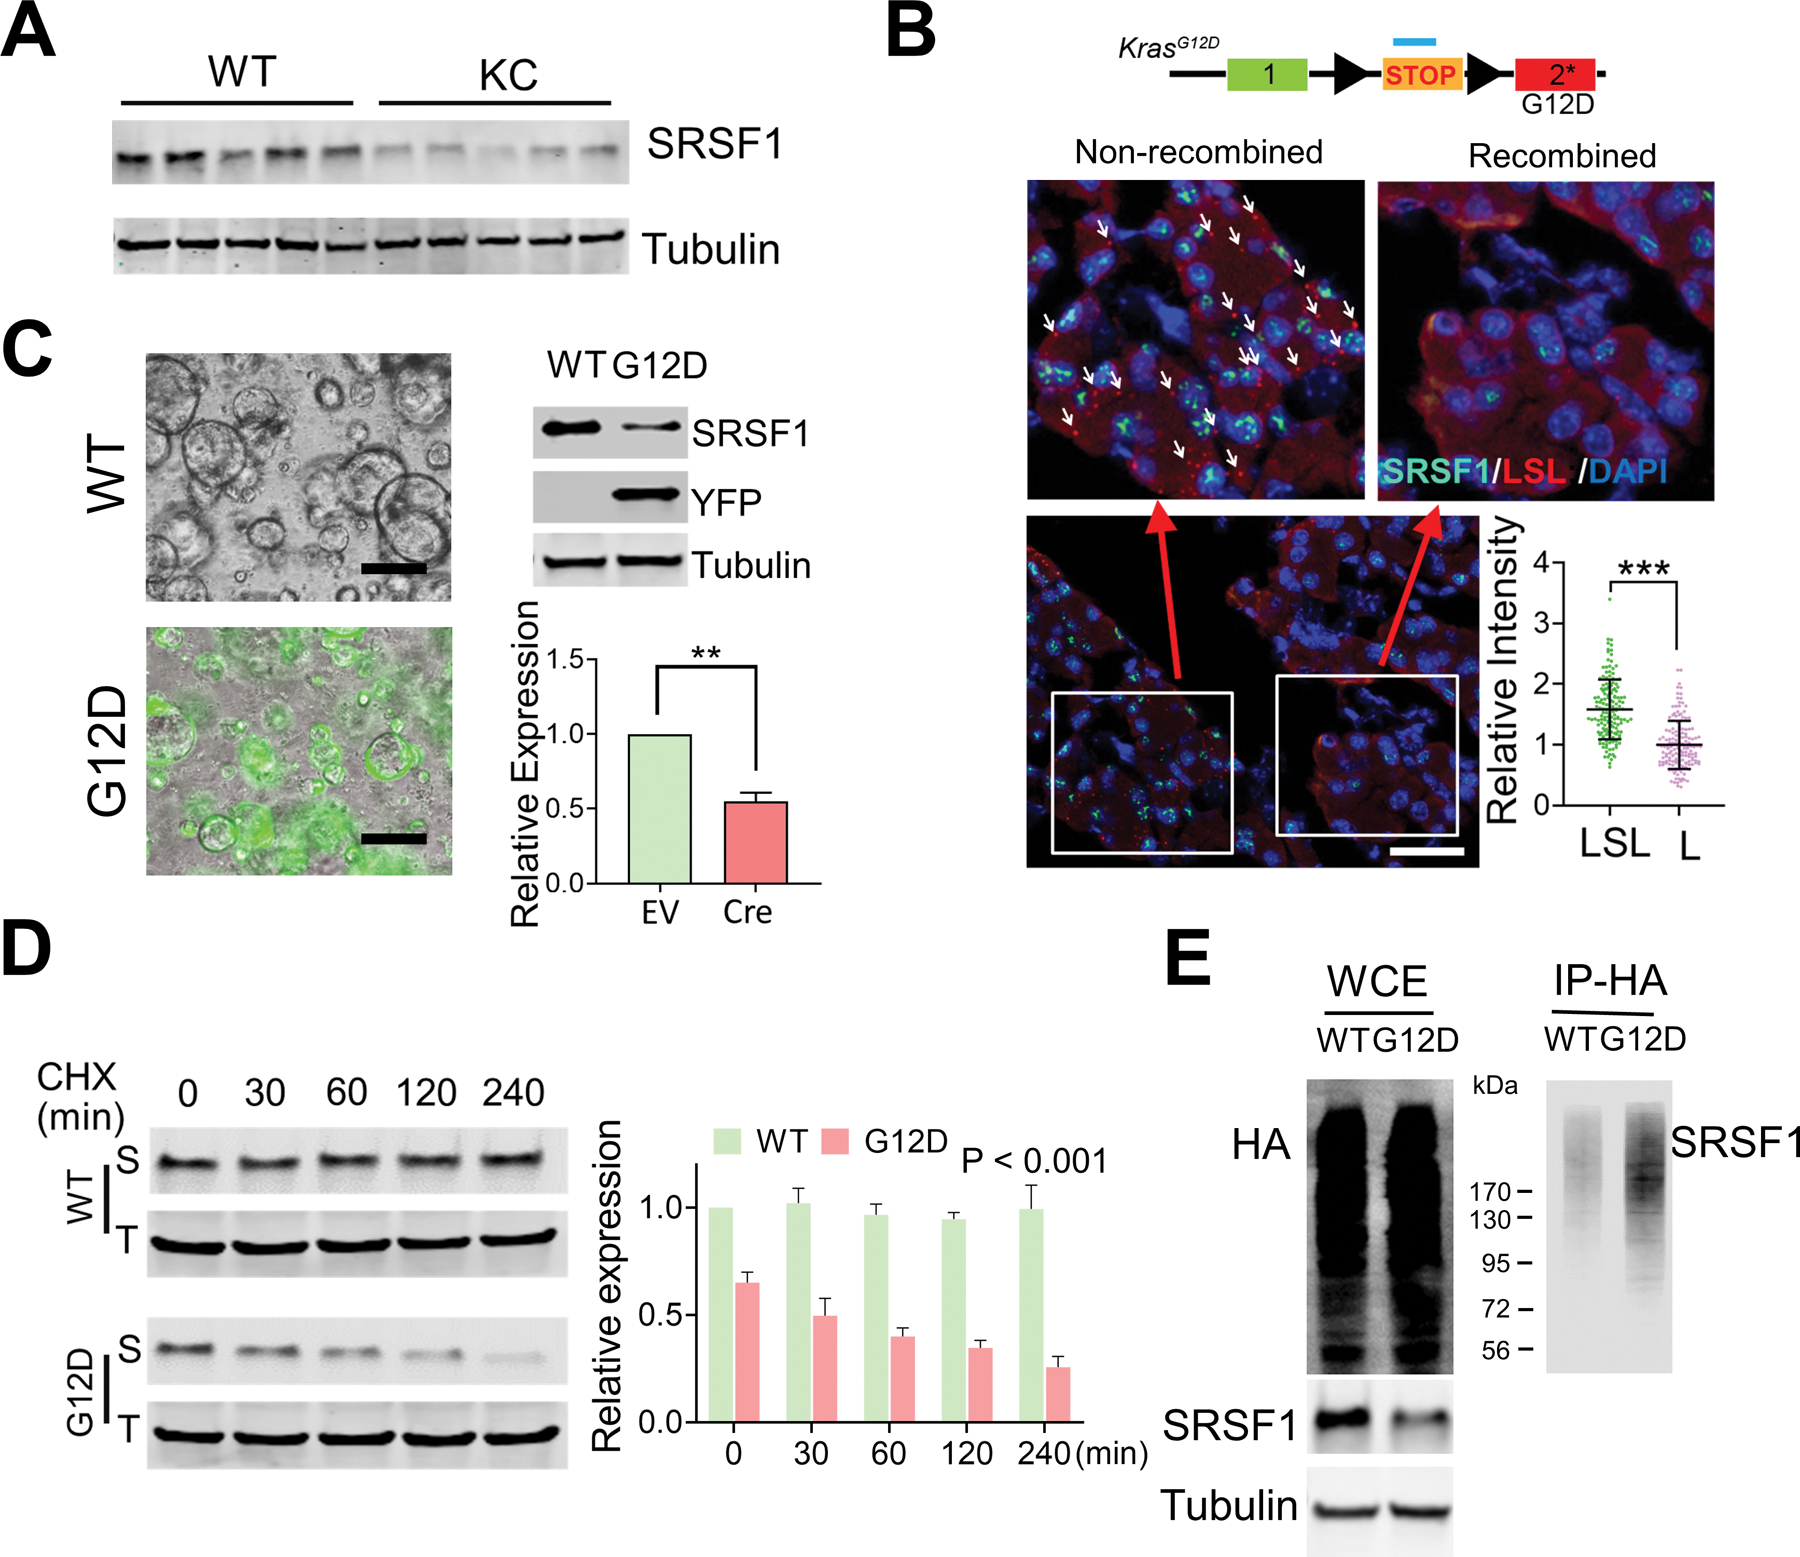
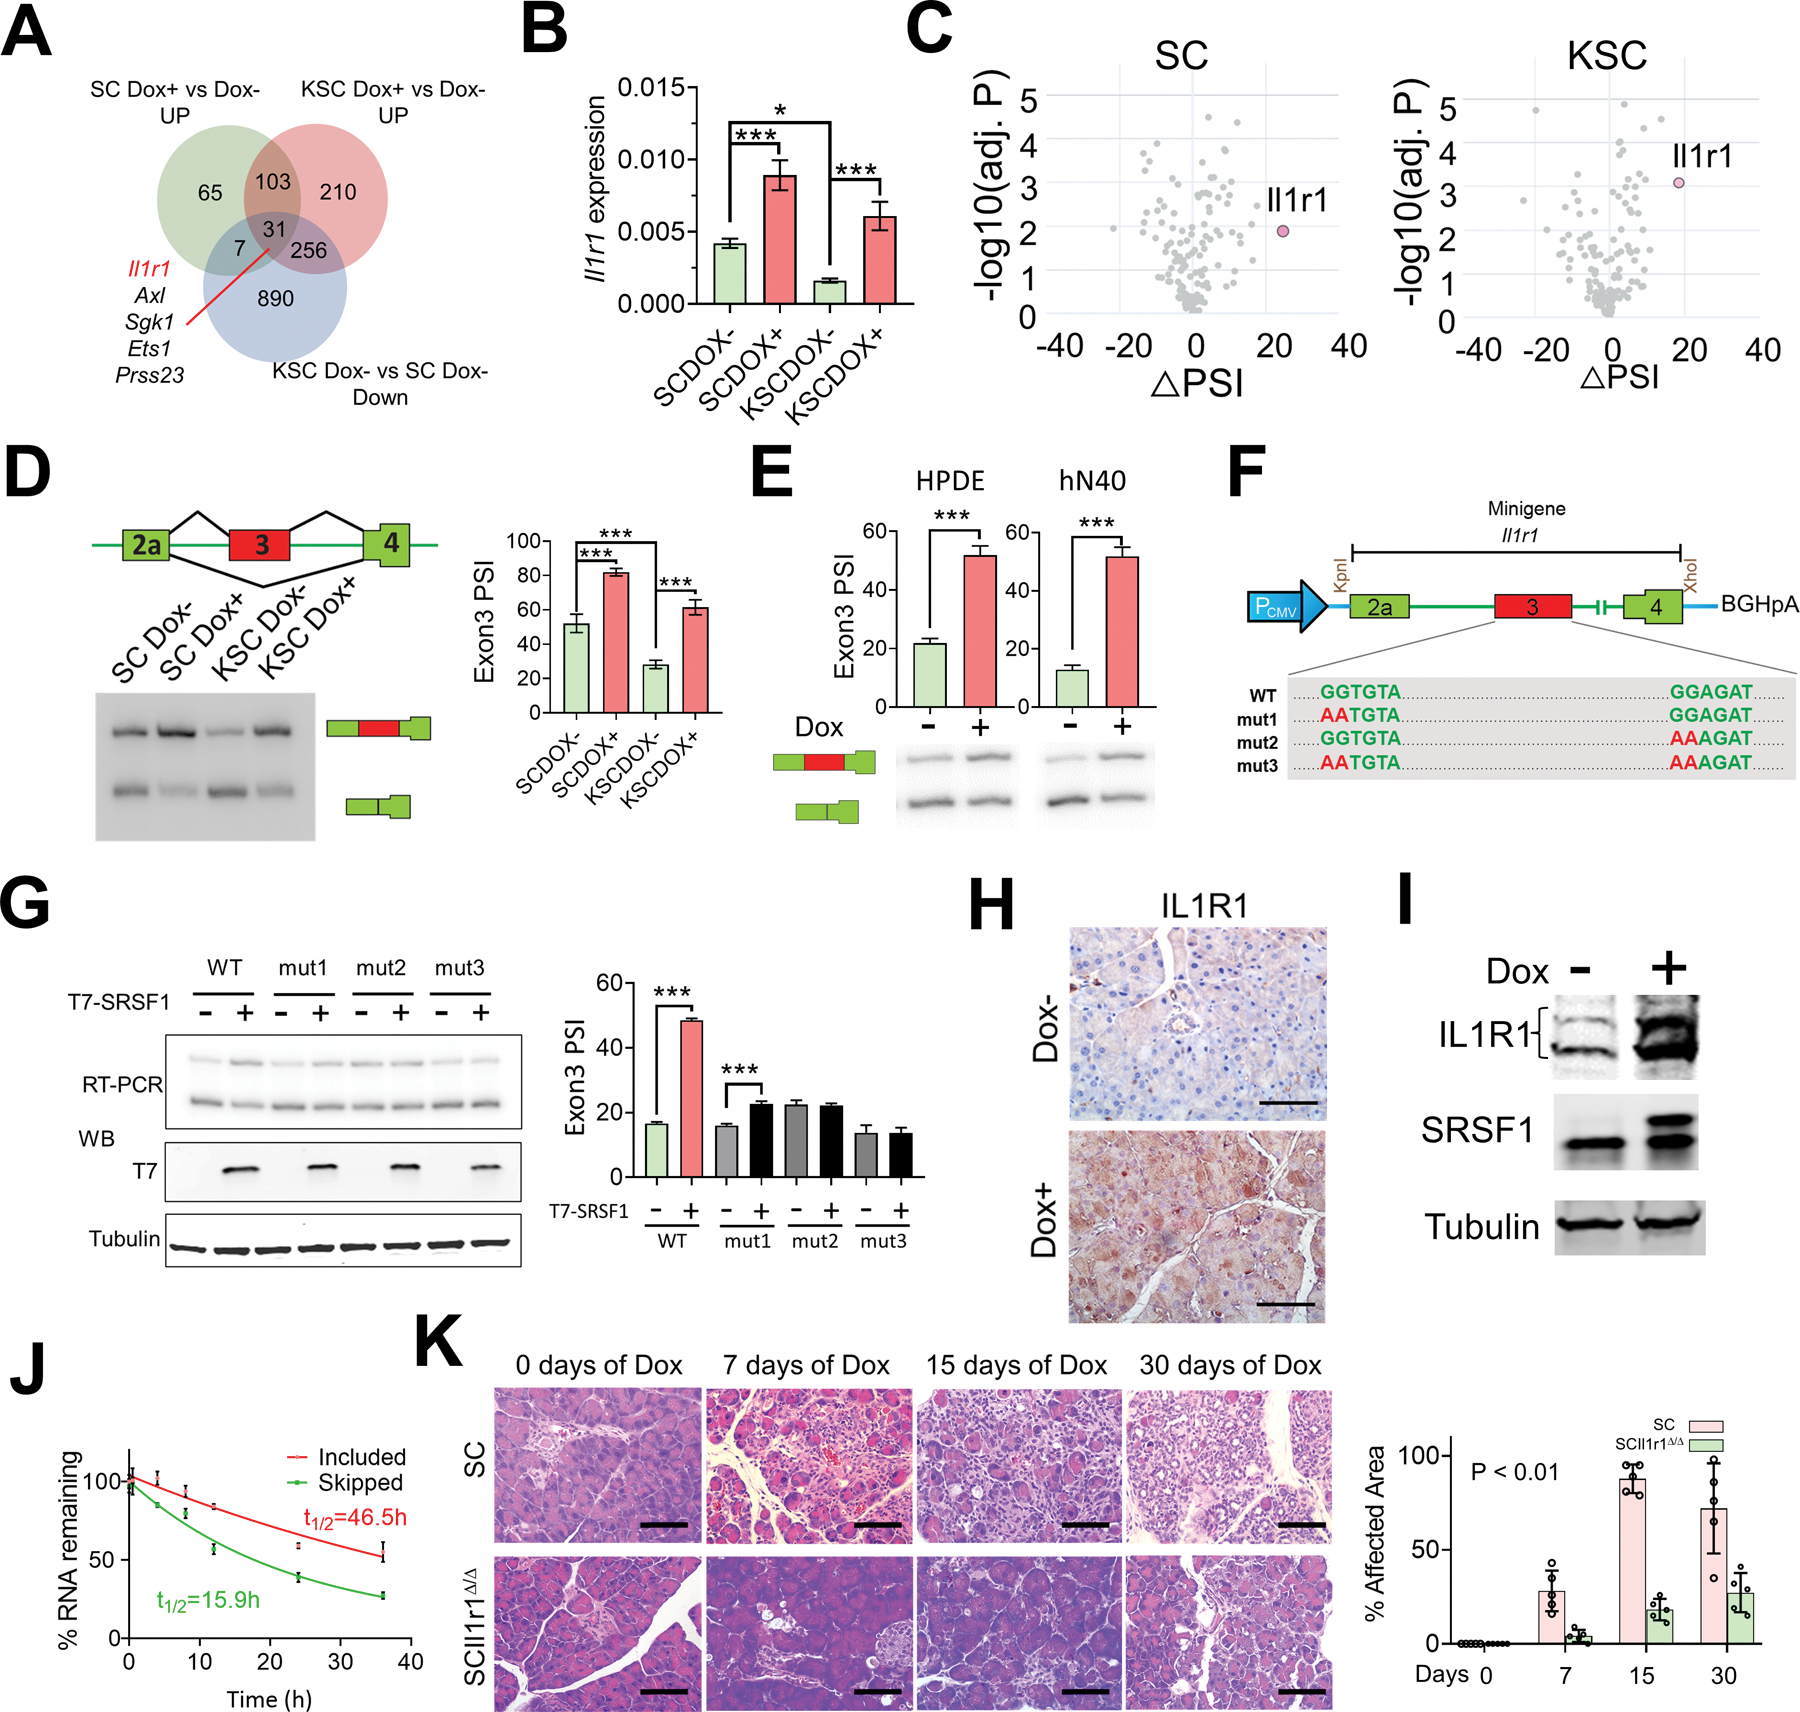
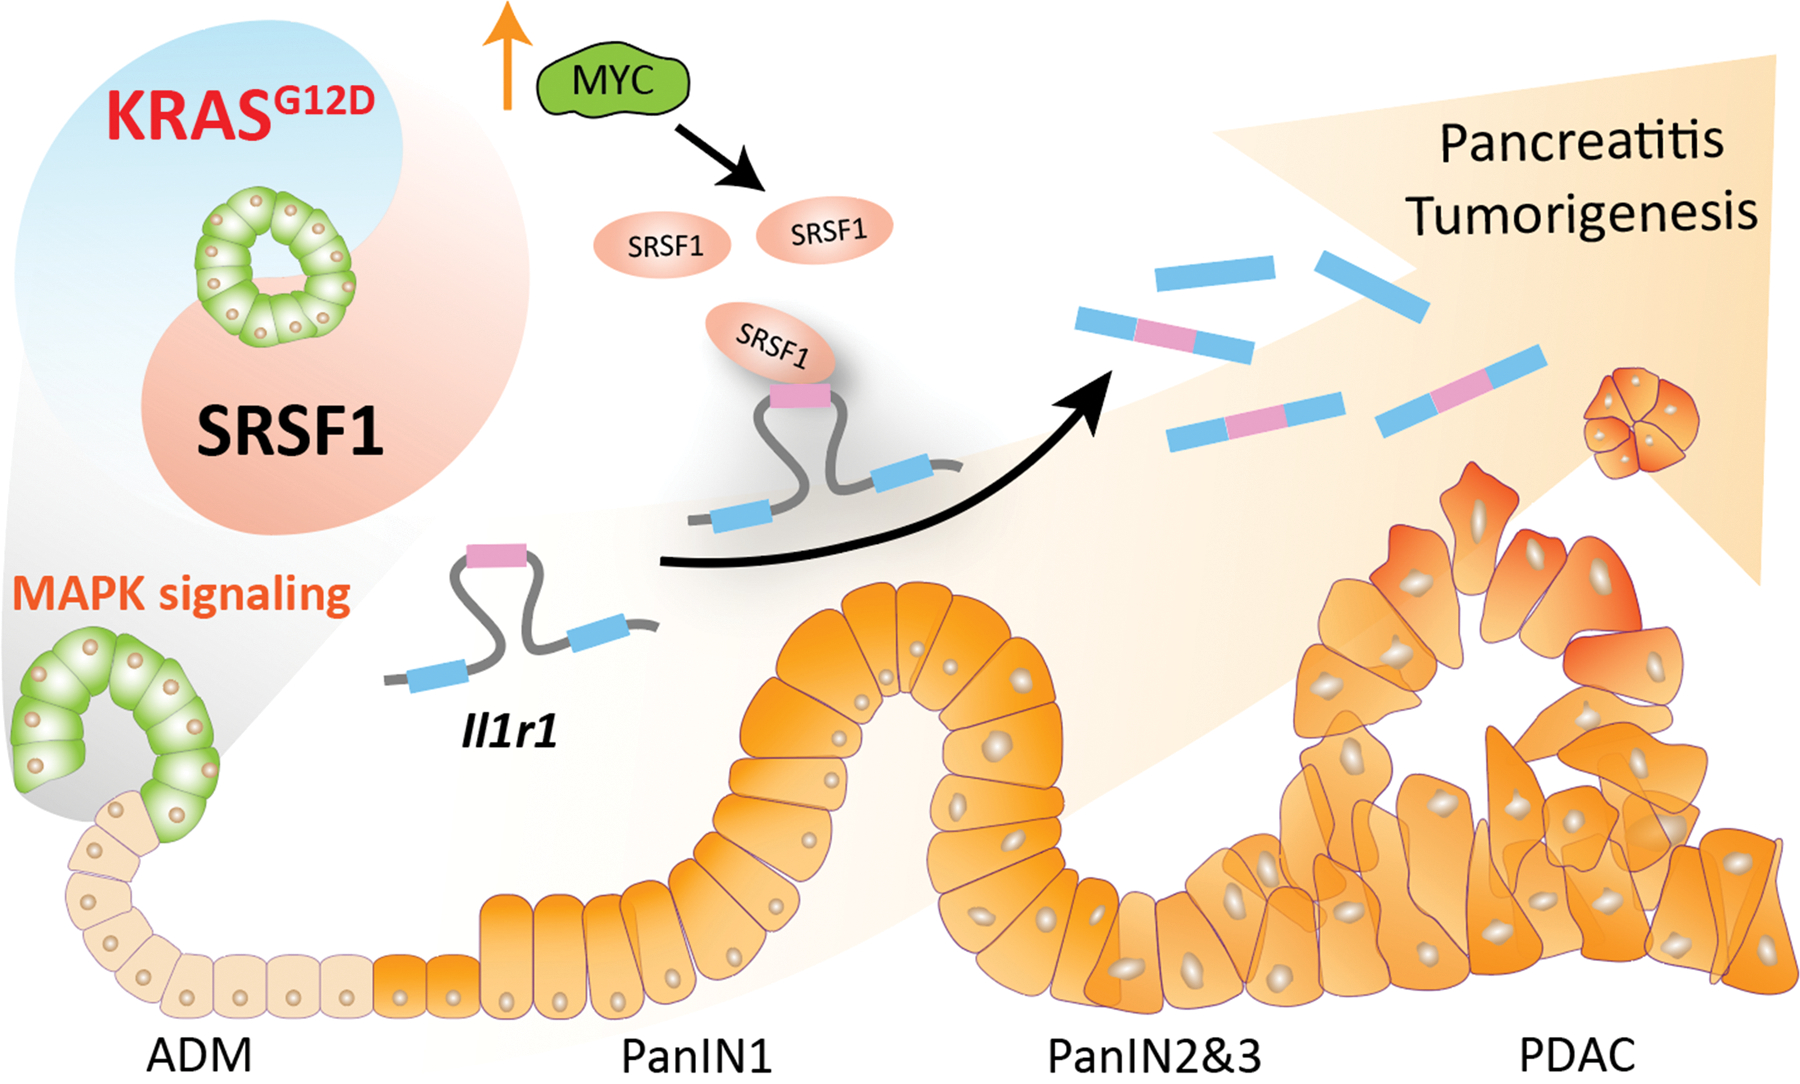
Inflammation is strongly associated with pancreatic ductal adenocarcinoma (PDAC), a highly lethal malignancy. Dysregulated RNA splicing factors have been widely reported in tumorigenesis, but their involvement in pancreatitis and PDAC is not well understood. Here, we report that the splicing factor SRSF1 is highly expressed in pancreatitis, PDAC precursor lesions, and tumors. Increased SRSF1 is sufficient to induce pancreatitis and accelerate KRASG12D-mediated PDAC. Mechanistically, SRSF1 activates MAPK signaling-partly by upregulating interleukin 1 receptor type 1 (IL1R1) through alternative-splicing-regulated mRNA stability. Additionally, SRSF1 protein is destabilized through a negative feedback mechanism in phenotypically normal epithelial cells expressing KRASG12D in mouse pancreas and in pancreas organoids acutely expressing KRASG12D, buffering MAPK signaling and maintaining pancreas cell homeostasis. This negative feedback regulation of SRSF1 is overcome by hyperactive MYC, facilitating PDAC tumorigenesis. Our findings implicate SRSF1 in the etiology of pancreatitis and PDAC, and point to SRSF1-misregulated alternative splicing as a potential therapeutic target.

Significance: We describe the regulation of splicing factor SRSF1 expression in the context of pancreas cell identity, plasticity, and inflammation. SRSF1 protein downregulation is involved in a negative feedback cellular response to KRASG12D expression, contributing to pancreas cell homeostasis. Conversely, upregulated SRSF1 promotes pancreatitis and accelerates KRASG12D-mediated tumorigenesis through enhanced IL1 and MAPK signaling. This article is highlighted in the In This Issue feature, p. 1501.


Conflict of interest statement

ARK is a co-founder, Director, Chair of the SAB, and shareholder of Stoke Therapeutics. ARK is on the SABs and holds shares of Skyhawk Therapeutics, Envisagenics, Assembl.cns, and Autoimmunity Biologic Solutions, and is a consultant for Biogen. DAT is on the SAB and holds shares with Leap Therapeutics, Surface Oncology, Sonata, and Mestag Therapeutics. DAT is a scientific co-founder of Mestag Therapeutics. DAT receives research support from Mestag Therapeutics and ONO therapeutics.

Figures

Figure 1.
Figure 1.
SRSF1 is associated with and promotes pancreatitis. A, Srsf1 expression in control and cerulein-treated mouse pancreas from reanalysis of GSE65146, GSE41418, and GSE10927 datasets. B, Scheme for cerulein-induced pancreatitis model (top); HE and SRSF1 IHC staining (bottom) of pancreata from control (saline) and cerulein-treated mice (M, mild; S, severe pancreatitis regions). Scale bars, 50 μm. n = 5 per group. C, Scheme of SC mice and their histological evaluation by HE staining, Masson’s trichrome staining (MT) (blue indicates collagen deposition), and IHC staining of cytokeratin CK19 to identify metaplastic ductal lesions, after treatment with Dox. Scale bars, 50 μm. n = 5 per group. D, Immune-cell infiltration evaluated by flow cytometry in SC mice treated with Dox. n = 5 per group. E-F, Circulating levels (U/L) of the pancreatic enzymes amylase (E) and lipase (F) in SC mice after treatment with Dox (days). Each data point represents a measurement from an individual mouse. A, Linear models and empirical bayes methods. (D-F) Kruskal-Wallis test followed by pairwise comparisons using Wilcoxon rank-sum test. Family-wise error rate was adjusted using Bonferroni-Holm method. *p <0.05, **p < 0.01, ***p <0.001. Error bars represent mean ± SD.
Figure 2.
Figure 2.
Elevated SRSF1 in PDAC and precursor lesions is associated with tumor progression. A, IHC staining (left) and intensity score (right) of SRSF1 in human PDAC tumor versus normal tissue. Insets show higher magnification. Scale bars, 20 μm. Unpaired, two-tailed t test. ***p < 0.001. Error bars represent mean ± SD. B, Kaplan-Meier survival analysis of patients with PAAD from TCGA. Group cut-offs were set at the SRSF1 median mRNA expression (n = 89 per group). Log-rank Mantel-Cox test was performed. C, IHC staining (left) and intensity score (right) of SRSF1 in pancreas cells from KC mice. Insets show higher magnification of normal duct, ADM, and murine PanIN1A. Scale bars, 50 μm. For quantification of intensity, n = 10 per group. One-way ANOVA with Tukey’s multiple comparison test. ***p < 0.001. D, Human tumor hT60 organoids following knockdown with control (shCon) or SRSF1sh hairpins (sh1 & sh2). Scale bar = 200 μm. n = 3 replicates per condition. E, Tumor growth curve of subcutaneous tumors formed with SUIT-2 cells, following knockdown with control (shCon) or SRSF1sh hairpins (sh1), n = 5 per group. Upper panel represents xenograft tumors. Linear mixed-effects model with the experimental group, time and group by time interaction as fixed effects, and tumor-specific random intercept was used to fit the model. ***P <0.001.
Figure 3.
Figure 3.
SRSF1 accelerates KRASG12D-mediated tumorigenesis. A, Scheme of KSC mouse strain (top), HE and MT staining of pancreata from two-month-old KC and KSC mice (n = 5 per group). Scale bars, 50 μm. B, Quantification of the percentage of pancreatic area exhibiting histological signs of ADM and neoplasia from two-month-old KC and KSC mice (n = 5 per group). Unpaired two-tailed t test, ***p <0.001. Error bars represent mean ± SD. C, Classification of highest-grade PanIN lesions present in two-month-old KC and KSC mice (n = 5 per group). D, Scheme of KPSC mouse strain, HE and MT staining of pancreata from one-month-old KPC and KPSC mice (n = 5 per group). Scale bars, 50 μm. E, Kaplan-Meier survival analysis of KPC and KPSC mice (n = 11 per group). The p value was determined by a log-rank Mantel-Cox test.
Figure 4.
Figure 4.
SRSF1 activates MAPK signaling, a prerequisite for KRASG12D-mediated PDAC initiation. A, Pathway-enrichment analysis of genes with increased (red) or decreased (blue) expression, in KSC organoids compared to SC organoids, both without Dox treatment (K), in Dox-treated SC organoids compared to untreated SC organoids (S), and in Dox-treated KSC organoids compared to untreated KSC organoids (KS). n = 3 replicates per group. Color bar represents −log10 (p value). B, PCR of pancreatic DNA (top), and western blot of Ras-GTP and total RAS levels (bottom) from 2-month-old wild-type (WT) and KC mice (n = 3 per genotype). C, Hematoxylin and eosin (HE), and Alcian blue staining of mucin of pancreata from two-month-old KC mice (n = 5). Insets show higher magnification of murine PanIN1A lesion. Scale bars, 100 μm. D, IHC staining of pERK in 2-month-old KC pancreas tissue (n = 5). Red arrow indicates ductal cells with early-stage neoplasia; black arrow indicates normal ductal cells. Scale bars, 50 μm. E, Western blotting of phosphorylated ERK1/2 (pERK1/2), total ERK1/2 (tERK1/2), and Tubulin in SC organoids, Dox-inducible T7-SRSF1 expressing HPDE cells, and hN40 organoids, with Dox treatment. n = 3 replicates per condition. F, pERK IHC staining of SC mice after Dox treatment (n = 5 per group). Scale bars, 50 μm.
Figure 5.
Figure 5.
Reduced expression of SRSF1 in morphologically normal KRASG12D-expressing pancreatic cells. A, Western blotting of SRSF1 protein in pancreatic protein lysates from WT and KC mice (n = 5 per group). B, Multiplexed RNA-FISH/IF staining of STOP-cassette and SRSF1 protein in pancreata isolated from KC mice. RNA FISH probes were designed to target the STOP cassette. Reflecting the mosaic expression of Cre recombinase in KC mice, pancreatic cells with the STOP cassette recombined and non-recombined can be distinguished by RNA-FISH probes. Upper left: non-recombined region, with white arrows indicating some of the positive FISH signals; upper right: recombined region, where most cells have undergone recombination and hence the FISH signal is lost; Bottom right, quantification of SRSF1 intensity in LSL-positive or -negative pancreas cells. Scale bars, 50 μm. Unpaired, two-tailed t test. ***p < 0.001. Error bars represent mean ± SD. C, YFP fluorescence (left), and western blotting and quantification of SRSF1 (right) of LSLKrasG12D/+; R26-LSl-YFP ductal organoids infected with adeno-empty (WT) or adeno-Cre (G12D) (n = 3 biological replicates). Unpaired, two-tailed t test. **p < 0.01. Error bars represent mean ± SD. D, Western blotting of SRSF1 (S) and Tubulin (T), and quantification in LSLKrasG12D/+; R26-LSl-YFP ductal organoids infected with adeno empty (WT) or adeno-Cre (G12D), respectively, followed by exposure to cycloheximide (10 mg/ml) for the indicated times. Linear mixed effects model with the experimental group, time and group by time interaction as fixed effects, and sample-specific random intercept was used to estimate the relative expression. E, In vivo ubiquitination assay of HA-ubiquitin stable-expressing LSL-KRASG12D/+; R26LSL-YFP organoids infected with adeno empty (WT) and adeno-Cre (G12D), respectively. Following immunoprecipitation of cell lysates, immunoprecipitates (IP) and whole-cell extracts (WCE) were analyzed by immunoblotting with the indicated antibodies.
Figure 6.
Figure 6.
SRSF1 increases IL1R1 expression through alternative splicing, contributing to pancreatitis and transformation. A, Venn diagram of genes upregulated in SC and KSC organoids treated with Dox versus untreated; and genes downregulated in KSC organoids compared to SC organoids, both without Dox treatment. B, Real-time PCR validation of Il1r1 expression changes in SC and KSC organoids treated with Dox (n = 3 biological replicates). One-way ANOVA with Tukey’s multiple comparison test. *p <0.05, ***p <0.001. Error bars represent mean ± SD. C, Volcano plots of splicing changes in MAPK signaling pathway-associated genes from SC and KSC organoids treated with Dox. D, Scheme and radioactive RT–PCR of SRSF1-regulated splicing event in Il1r1 pre-mRNA from SC and KSC organoids treated with Dox. The percent spliced in (PSI) was quantified for each condition (right, n = 3 biological replicates). One-way ANOVA with Tukey’s multiple comparison test. ***p <0.001. Error bars represent mean ± SD. E, Radioactive RT–PCR of SRSF1-regulated splicing event in Il1r1 pre-mRNA from Dox-inducible T7-SRSF1-expressing HPDE cells and human normal pancreatic hN40 organoids treated with Dox. The percent spliced in (PSI) was quantified for each condition (top panel, n = 3 biological replicates). Unpaired two-tailed t test. ***p <0.001. Error bars represent mean ± SD. F, Diagram of Il1r1 minigene. Mutations were introduced to disrupt SRSF1 binding motif(s). G, Radioactive RT-PCR results of Il1r1 minigene assays (top left), and Western blotting of T7-tag (bottom left) in 293T cells overexpressing T7-SRSF1. The percentage of exon 3 inclusion was quantified for each condition (right, n = 3 biological replicates). One-way ANOVA with Tukey’s multiple comparison test. ***p <0.001. Error bars represent mean ± SD. H, IHC staining of IL1R1 in pancreas tissues from SC mice with Dox treatment for 3 days (n = 5 per group). Scale bars, 50 μm. I, Western blotting of IL1R1, endogenous and T7-tagged SRSF1 in SC organoids treated with Dox. J, mRNA-decay assay of the Il1r1 isoforms in SC organoids harvested at the indicated times after actinomycin D treatment. mRNAs were quantified by real-time PCR, normalized to Gapdh levels, and expressed as a percentage of the levels at time 0 h (n = 3 biological replicates). K, HE staining of pancreata of SC and SCIl1r1Δ/Δ mice with Dox treatment (n = 5 per group). Scale bars, 50 μm. The affected area was quantified on the right. Statistical analysis was performed by a linear mixed-effects model with the experimental group, time, and group by time interaction as fixed effects, and the sample-specific random intercept was used to estimate the % affected area.
Figure 7.
Figure 7.
SRSF1 promotes pancreatitis and KRASG12D-mediated pancreatic cancer, and its downregulation is involved in negative feedback to KRASG12D to maintain cellular homeostasis. Splicing factor SRSF1 downregulation is a negative-feedback cellular response to KRASG12D mutation, which dampens MAPK signaling activity and contributes to pancreas-cell homeostasis. Conversely, increased SRSF1 enhances MAPK signaling through alternative splicing of Il1r1 pre-mRNA, promoting pancreatitis and ADM, thus accelerating KRASG12D-mediated tumorigenesis. One mechanism of SRSF1 upregulation is transcriptional activation by MYC, which can be amplified or epigenetically activated (↑).

Similar articles

Cited by

References

    1. Mizrahi JD, Surana R, Valle JW, Shroff RT. Pancreatic cancer. The Lancet 2020;395:2008–20. - PubMed
    1. Prior IA, Lewis PD, Mattos C. A comprehensive survey of Ras mutations in cancer. Cancer Res 2012;72:2457–67. - PMC - PubMed
    1. Hingorani SR, Petricoin EF, Maitra A, Rajapakse V, King C, Jacobetz MA, et al. Preinvasive and invasive ductal pancreatic cancer and its early detection in the mouse. Cancer Cell 2003;4:437–50. - PubMed
    1. Cheng DK, Oni TE, Thalappillil JS, Park Y, Ting H-C, Alagesan B, et al. Oncogenic KRAS engages an RSK1/NF1 pathway to inhibit wild-type RAS signaling in pancreatic cancer. Proc Natl Acad Sci U S A 2021;118:e2016904118. - PMC - PubMed
    1. Hingorani SR, Wang L, Multani AS, Combs C, Deramaudt TB, Hruban RH, et al. Trp53R172H and KrasG12D cooperate to promote chromosomal instability and widely metastatic pancreatic ductal adenocarcinoma in mice. Cancer Cell 2005;7:469–83. - PubMed

Publication types

MeSH terms

Substances