

Retinal Aging Transcriptome and Cellular Landscape in Association With the Progression of Age-Related Macular Degeneration
- PMID: 37099020
- PMCID: PMC10148661
- DOI: 10.1167/iovs.64.4.32
Retinal Aging Transcriptome and Cellular Landscape in Association With the Progression of Age-Related Macular Degeneration
Abstract
Purpose: Age is the main risk factor for age-related macular degeneration (AMD), a leading cause of blindness in the elderly, with limited therapeutic options.
Methods: Here, we analyze the transcriptomic characteristics and cellular landscape of the aging retinas from controls and patients with AMD.
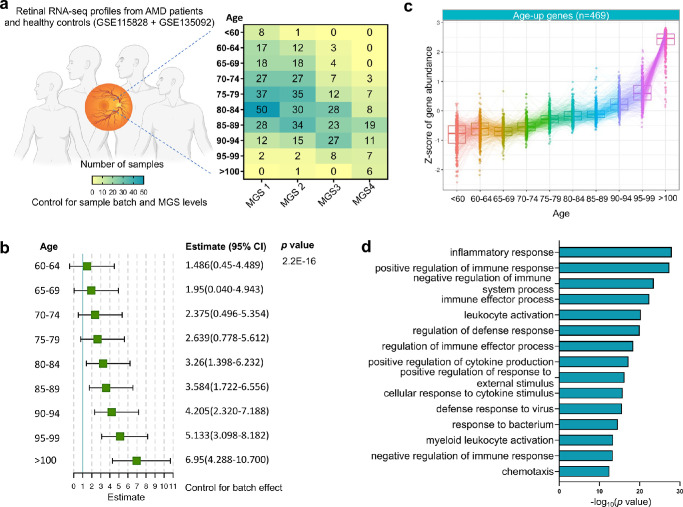
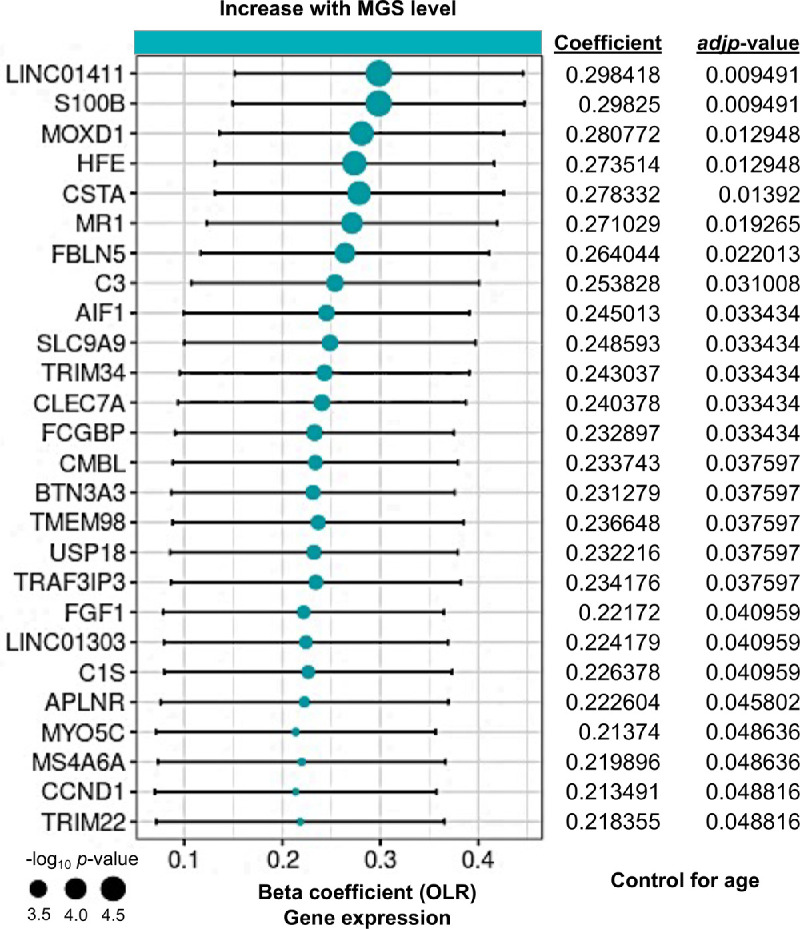
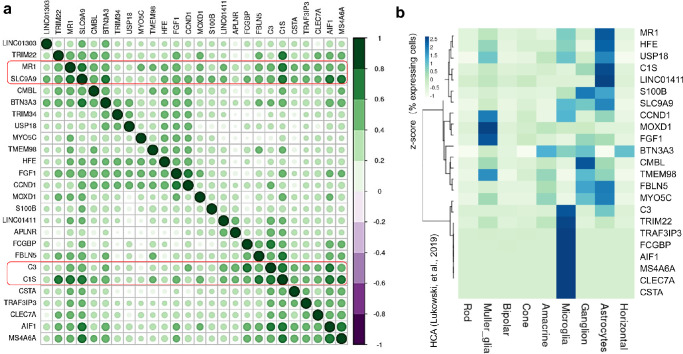
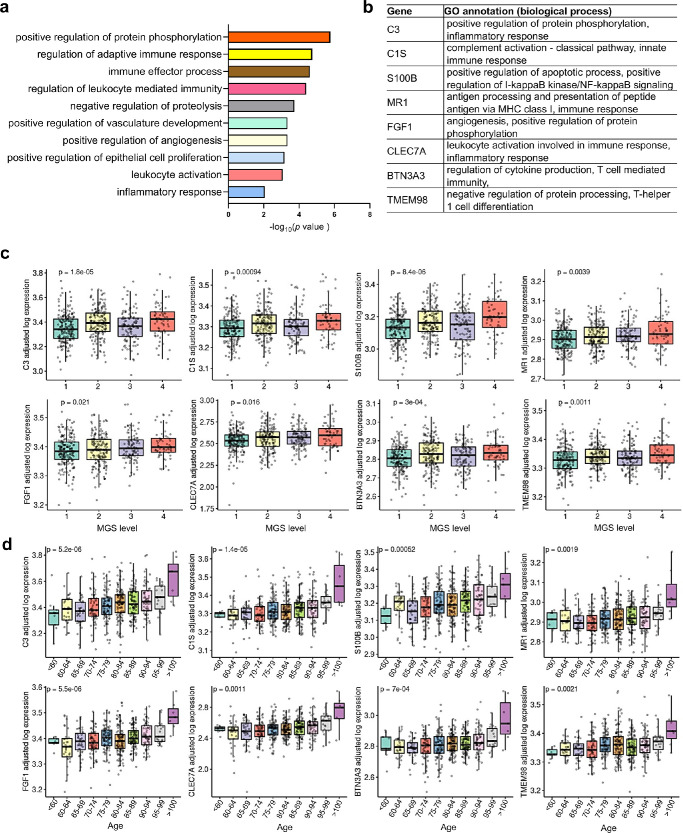
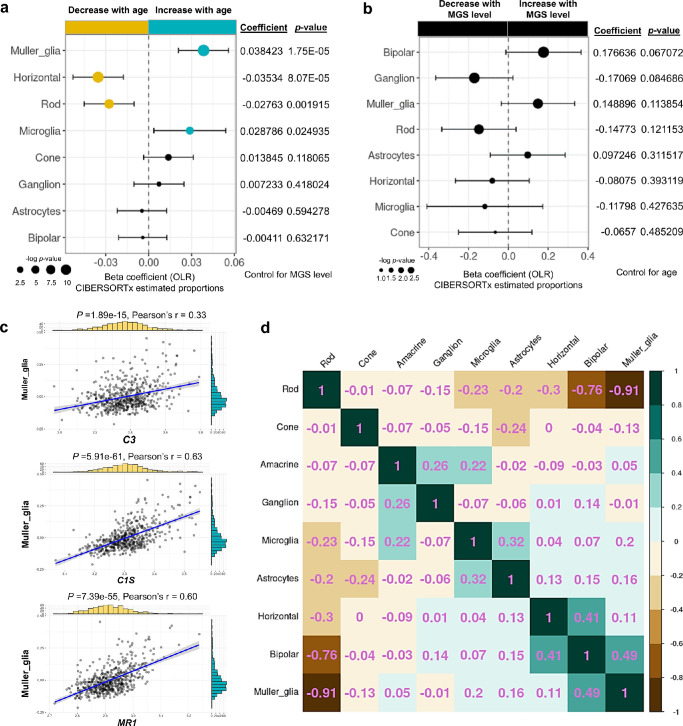
Results: We identify the aging genes in the neural retina, which are associated with innate immune response and inflammation. Deconvolution analysis reveals that the estimated proportions of M2 macrophages are significantly increased with both age and AMD severity. Moreover, we find that proportions of Müller glia are significantly increased only with age but not with AMD severity. Several genes associated with both age and AMD severity, particularly C1s and MR1, are strong positively correlated with the proportions of Müller glia.
Conclusions: Our studies expand the genetic and cellular landscape of AMD and provide avenues for further studies on the relationship between age and AMD.
Conflict of interest statement
Disclosure:
Figures
Similar articles
-
Idiopathic preretinal glia in aging and age-related macular degeneration.Exp Eye Res. 2016 Sep;150:44-61. doi: 10.1016/j.exer.2015.07.016. Epub 2015 Jul 26. Exp Eye Res. 2016. PMID: 26220834 Free PMC article.
-
Rat retinal transcriptome: effects of aging and AMD-like retinopathy.Cell Cycle. 2013 Jun 1;12(11):1745-61. doi: 10.4161/cc.24825. Epub 2013 May 6. Cell Cycle. 2013. PMID: 23656783 Free PMC article.
-
Comparative Analysis of Molecular Landscape in Mouse Models and Patients Reveals Conserved Inflammation Pathways in Age-Related Macular Degeneration.Invest Ophthalmol Vis Sci. 2024 Jan 2;65(1):13. doi: 10.1167/iovs.65.1.13. Invest Ophthalmol Vis Sci. 2024. PMID: 38175639 Free PMC article.
-
Regulatory role of HIF-1alpha in the pathogenesis of age-related macular degeneration (AMD).Ageing Res Rev. 2009 Oct;8(4):349-58. doi: 10.1016/j.arr.2009.06.002. Epub 2009 Jul 7. Ageing Res Rev. 2009. PMID: 19589398 Review.
-
C-Reactive Protein as a Therapeutic Target in Age-Related Macular Degeneration.Front Immunol. 2018 Apr 19;9:808. doi: 10.3389/fimmu.2018.00808. eCollection 2018. Front Immunol. 2018. PMID: 29725335 Free PMC article. Review.
Cited by
-
Single-cell RNA sequencing highlights a significant retinal Müller glial population in dry age-related macular degeneration.iScience. 2025 Apr 17;28(5):112464. doi: 10.1016/j.isci.2025.112464. eCollection 2025 May 16. iScience. 2025. PMID: 40343286 Free PMC article.
-
Functions of mucosal associated invariant T cells in eye diseases.Front Immunol. 2024 Feb 19;15:1341180. doi: 10.3389/fimmu.2024.1341180. eCollection 2024. Front Immunol. 2024. PMID: 38440736 Free PMC article. Review.
-
Ovariectomy drives increase of an ECM transcription signature in the posterior eye and retina.Vision Res. 2024 Dec;225:108507. doi: 10.1016/j.visres.2024.108507. Epub 2024 Oct 30. Vision Res. 2024. PMID: 39476526
-
Identification of Biomarkers for Oxidative Stress in Age-Related Macular Degeneration: Combining Transcriptomics and Mendelian Randomization Analysis.Transl Vis Sci Technol. 2025 Aug 1;14(8):42. doi: 10.1167/tvst.14.8.42. Transl Vis Sci Technol. 2025. PMID: 40874706 Free PMC article.
-
Retinal Transcriptome and Cellular Landscape in Relation to the Progression of Diabetic Retinopathy.Invest Ophthalmol Vis Sci. 2022 Aug 2;63(9):26. doi: 10.1167/iovs.63.9.26. Invest Ophthalmol Vis Sci. 2022. PMID: 36006018 Free PMC article.
References
-
- Evans JR. Risk factors for age-related macular degeneration. Prog Retin Eye Res. 2001; 20: 227–253. - PubMed
-
- Bressler NM. Age-related macular degeneration is the leading cause of blindness. JAMA. 2004; 291: 1900–1901. - PubMed
-
- Orozco LD, Chen HH, Cox C, et al. .. Integration of eQTL and a single-cell atlas in the human eye identifies causal genes for age-related macular degeneration. Cell Rep. 2020; 30: 1246–1259.e1246. - PubMed
Publication types
MeSH terms
LinkOut - more resources
Full Text Sources
Medical
Miscellaneous
