

Associations between sheep meat intake frequency and blood plasma levels of metabolites and lipoproteins in healthy Uzbek adults
- PMID: 37099187
- PMCID: PMC10133350
- DOI: 10.1007/s11306-023-02005-x
Associations between sheep meat intake frequency and blood plasma levels of metabolites and lipoproteins in healthy Uzbek adults
Abstract
Introduction: Uzbekistan is one of the countries with the highest number of diet-related chronic diseases, which is believed to be associated with high animal fat intake. Sheep meat is high in fats (~ 5% in muscle), including saturated and monounsaturated fatty acids, and it contains nearly twice the higher amounts of n-3 polyunsaturated fatty acids and conjugated linoleic acids compared to beef. Nevertheless, sheep meat is considered health promoting by the locals in Uzbekistan and it accounts for around 1/3 of red meat intake in the country.
Objectives: The aim of this study was to apply a metabolomics approach to investigate if sheep meat intake frequency (SMIF) is associated with alterations in fasting blood plasma metabolites and lipoproteins in healthy Uzbek adults.
Methods: The study included 263 subjects, 149 females and 114 males. For each subject a food intake questionnaire, including SMIF, was recorded and fasting blood plasma samples were collected for metabolomics. Blood plasma metabolites and lipoprotein concentrations were determined using 1H NMR spectroscopy.
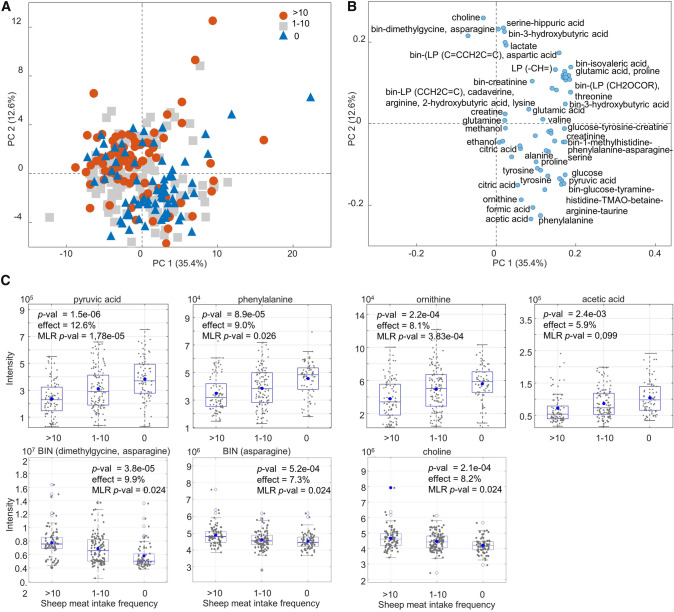
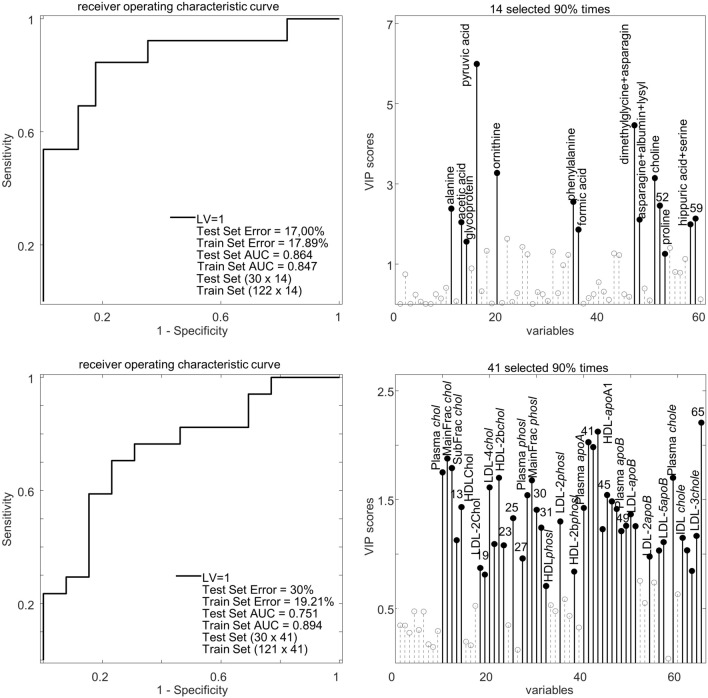
Results and conclusion: The results showed that SMIF was confounded by nationality, sex, body mass index (BMI), age, intake frequency of total meat and fish in ascending order (p < 0.01). Multivariate and univariate data analyses showed differences in the levels of plasma metabolites and lipoproteins with respect to SMIF. The effect of SMIF after statistical adjustment by nationality, sex, BMI, age, intake frequency of total meat and fish decreased but remained significant. Pyruvic acid, phenylalanine, ornithine, and acetic acid remained significantly lower in the high SMIF group, whereas choline, asparagine, and dimethylglycine showed an increasing trend. Levels of cholesterol, apolipoprotein A1, as well as low- and high-density lipoprotein subfractions all displayed a decreasing trend with increased SMIF although the difference were not significant after FDR correction.
Keywords: Choline; Lipoproteins; Meat intake; Metabolomics; NMR; Sheep meat.
© 2023. The Author(s).
Conflict of interest statement
The authors declare that they have no known competing financial interests or personal relationships that could have appeared to influence the work reported in this paper.
Figures


Similar articles
-
Influence of n-6 versus n-3 polyunsaturated fatty acids in diets low in saturated fatty acids on plasma lipoproteins and hemostatic factors.Arterioscler Thromb Vasc Biol. 1997 Dec;17(12):3449-60. doi: 10.1161/01.atv.17.12.3449. Arterioscler Thromb Vasc Biol. 1997. PMID: 9437192 Clinical Trial.
-
Plasma lipoprotein response to substituting fish for red meat in the diet.Am J Clin Nutr. 1991 May;53(5):1171-6. doi: 10.1093/ajcn/53.5.1171. Am J Clin Nutr. 1991. PMID: 2021128 Clinical Trial.
-
Exercise attenuates the increase in plasma monounsaturated fatty acids and high-density lipoprotein cholesterol but not high-density lipoprotein 2b cholesterol caused by high-oleic ground beef in women.Nutr Res. 2013 Dec;33(12):1003-11. doi: 10.1016/j.nutres.2013.09.003. Epub 2013 Oct 17. Nutr Res. 2013. PMID: 24267039 Clinical Trial.
-
Effects on plasma lipoproteins of monounsaturated, saturated, and polyunsaturated fatty acids in the diet of African green monkeys.J Lipid Res. 1990 Oct;31(10):1873-82. J Lipid Res. 1990. PMID: 2079610
-
The influence of consuming fatty fish instead of red meat on plasma levels of vitamins A, C and E.Eur J Clin Nutr. 1993 Feb;47(2):97-103. Eur J Clin Nutr. 1993. PMID: 8436095 Clinical Trial.
References
-
- Altorf-van der Kuil W, Brink EJ, Boetje M, Siebelink E, Bijlsma S, Engberink MF, Van’t Veer P, Tome D, Bakker SJ, van Baak MA, Geleijnse JM. Identification of biomarkers for intake of protein from meat, dairy products and grains: a controlled dietary intervention study. British Journal of Nutrition. 2013;110:810–22. doi: 10.1017/S0007114512005788. - DOI - PubMed
-
- Baila-Rueda L, Mateo-Gallego R, Perez-Calahorra S, Lamiquiz-Moneo I, de Castro-Oros I, Cenarro A, Civeira F. Effect of different fat-enriched meats on non-cholesterol sterols and oxysterols as markers of cholesterol metabolism: Results of a randomized and cross-over clinical trial. Nutrition, Metabolism, and Cardiovascular Diseases. 2015;25:853–859. doi: 10.1016/j.numecd.2015.06.008. - DOI - PubMed
Publication types
MeSH terms
Substances
LinkOut - more resources
Full Text Sources
Medical