. 2024 Mar;56(3):1260-1282.
doi: 10.3758/s13428-023-02093-6. Epub 2023 Apr 26.

A tutorial on Bayesian model-averaged meta-analysis in JASP

Affiliations

A tutorial on Bayesian model-averaged meta-analysis in JASP

Sophie W Berkhout et al. Behav Res Methods. 2024 Mar.

Abstract

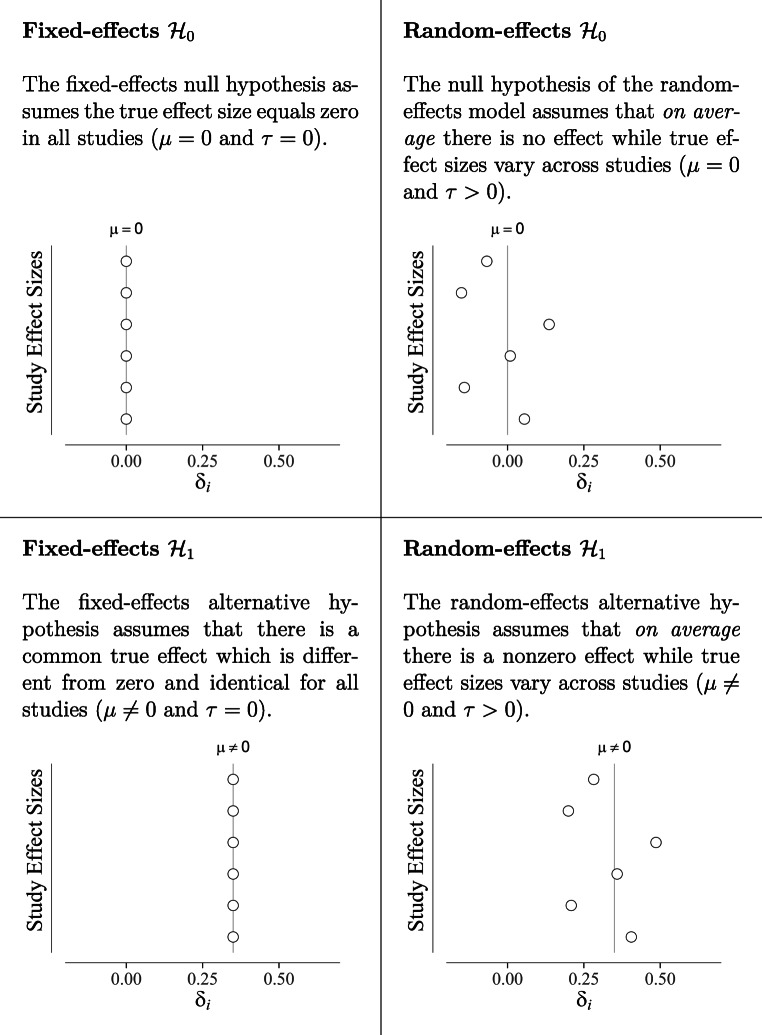
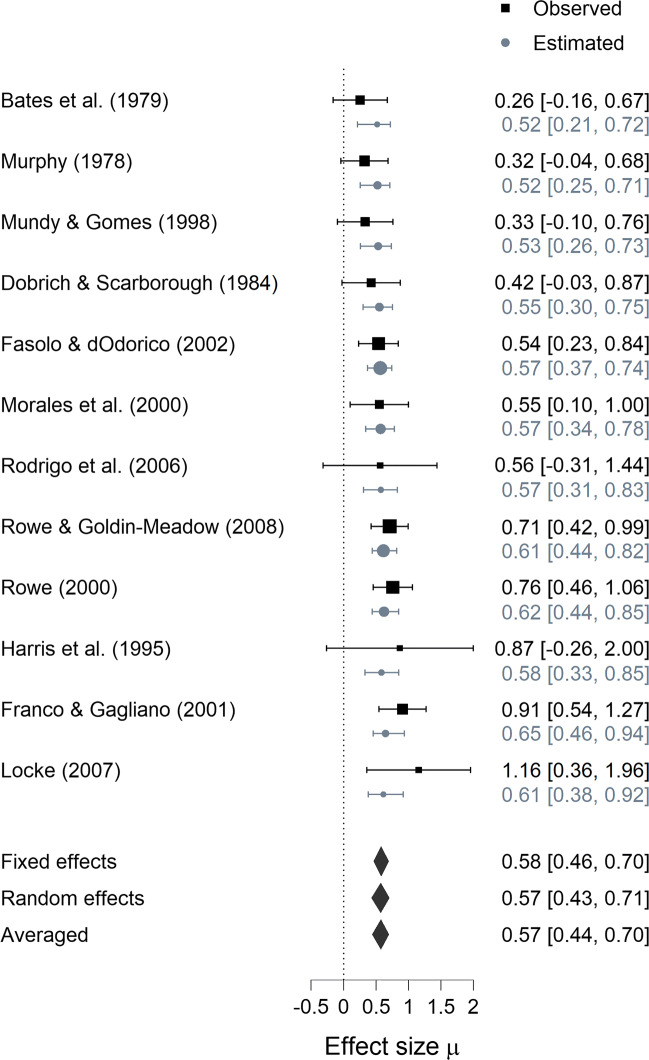
Researchers conduct meta-analyses in order to synthesize information across different studies. Compared to standard meta-analytic methods, Bayesian model-averaged meta-analysis offers several practical advantages including the ability to quantify evidence in favor of the absence of an effect, the ability to monitor evidence as individual studies accumulate indefinitely, and the ability to draw inferences based on multiple models simultaneously. This tutorial introduces the concepts and logic underlying Bayesian model-averaged meta-analysis and illustrates its application using the open-source software JASP. As a running example, we perform a Bayesian meta-analysis on language development in children. We show how to conduct a Bayesian model-averaged meta-analysis and how to interpret the results.

Keywords: Bayes factor; Bayesian model-averaging; Evidence synthesis; Meta-analysis; Posterior probability.


Conflict of interest statement

S.W. Berkhout, Julia M. Haaf, Quentin F. Gronau, and E.-J. Wagenmakers declare that they have contributed to the development of the open-source software package JASP (https://jasp-stats.org), a non-commercial, publicly funded effort to make Bayesian statistics accessible to a broader group of researchers and students.

Figures

Fig. 1
Fig. 1
Explanation of the four meta-analytic models. The figures show the true effect sizes for six studies (y-axis) in accordance with the models. The x-axis depicts the study effect size δi
Fig. 2
Fig. 2
Forest plot for the Bayesian model-averaged meta-analysis by Gronau et al., (2017). Shown are the estimated effect sizes per study (points) and the estimates of the overall effect sizes per model (fixed-effect, random-effects, and model-averaged; diamonds). The corresponding Bayes factors and p values are given on the right. Figure available at http://tinyurl.com/kz2jpwb under CC license https://creativecommons.org/licenses/by/2.0/
Fig. 3
Fig. 3
JASP screenshot of the input panel for the Bayesian meta-analysis module. The variables from the data file are listed in the top-left box and can be moved to the appropriate boxes on the top-right. Below the data input boxes are various options for inference and displaying results. More detailed options are available under the drop-down subsections Prior, Plots, and Advanced
Fig. 4
Fig. 4
JASP screenshot of the prior distribution options for effect size and heterogeneity in the Bayesian meta-analysis module
Fig. 5
Fig. 5
Prior distributions for the Bayesian meta-analysis of the studies identified by Colonnesi et al., (2010) on the concurrent relation between pointing and language development. Left panel: μCauchy(0,0.354). Right panel: τInv-Gamma(1,0.075). Note that these priors are on the Fisher’s z scale, with values about twice as small as Cohen’s d values. Figures from JASP
Fig. 6
Fig. 6
Forest plot for the studies identified by Colonnesi et al., (2010) on the concurrent relation between pointing and language development. Observed per-study effect sizes (i.e., Fisher’s z) with 95% confidence intervals are shown in black; estimated per-study effect sizes with 95% credible intervals are shown in gray. Figure from JASP
Fig. 7
Fig. 7
Cumulative forest plot for the studies identified by Colonnesi et al., (2010) on the concurrent relation between pointing and language development. Each consecutive row shows the model-averaged estimate of μ (with a 95% credible interval) after adding the associated study to the analysis. The bottom row shows the result for the complete data set. Figure from JASP
Fig. 8
Fig. 8
Posterior distributions (solid lines) and prior distributions (dotted lines) for the Bayesian meta-analysis of the studies identified by Colonnesi et al.,(2010) on the concurrent relation between pointing and language development. Left panel: prior and posterior distribution on effect size (for the fixed effects, random effects, and model-averaged alternative models). Right panel: prior and posterior distribution on heterogeneity (for the random effects alternative model). Figures from JASP
Fig. 9
Fig. 9
The flow of evidence: model-averaged meta-analytic Bayes factor sequential analyses for effect size (left panel) and heterogeneity (right panel). Data are based on the studies identified by Colonnesi et al., (2010) on the concurrent relation between pointing and language development. The panels show how evidence accumulates when studies are added one-by-one. Panels from JASP
Fig. 10
Fig. 10
The flow of belief: sequential analysis of posterior model probabilities for the four meta-analytic models. Data are based on the studies identified by Colonnesi et al., (2010) on the concurrent relation between pointing and language development. The lines show how the posterior model probabilities fluctuate when studies are added one-by-one. Figure from JASP
Fig. 11
Fig. 11
Advanced settings for the Bayesian meta-analysis. See text for details
Fig. 12
Fig. 12
JASP spreadsheet data view for the Colonnesi et al., (2010) meta-analysis. Clicking the ‘+’ sign on the top right activates the ‘create computed column’ functionality
Fig. 13
Fig. 13
The JASP pop-up menu that initiates the creation of a computed column. Users are asked to name the new column and determine the method of computation (i.e., R or the drag-and-drop interface)
Fig. 14
Fig. 14
The JASP drag-and-drop interface to transform correlation coefficients r to the Fisher’s z scale
Fig. 15
Fig. 15
The JASP R interface to obtain standard errors on the Fisher’s z scale
Fig. 16
Fig. 16
JASP spreadsheet data view for the Colonnesi et al., (2010) meta-analysis showing the Fisher’s z transformed variables

References

    1. Borenstein M, Hedges LV, Higgins JP, Rothstein HR. A basic introduction to fixed-effect and random-effects models for meta-analysis. Research Synthesis Methods. 2010;1(2):97–111. doi: 10.1002/jrsm.12. - DOI - PubMed
    1. Burnham KP, Anderson DR. Model selection and multimodel inference: A practical information?theoretic approach (2nd edn.) New York: Springer; 2002.
    1. Colonnesi C, Stams GJJ, Koster I, Noom MJ. The relation between pointing and language development: A meta-analysis. Developmental Review. 2010;30(4):352–366. doi: 10.1016/j.dr.2010.10.001. - DOI
    1. Etz A, Wagenmakers E-J. Haldane?s contribution to the Bayes factor hypothesis test. Statistical Science. 2017;32:313–?329. doi: 10.1214/16-STS599. - DOI
    1. Gail M, Simon R. Testing for qualitative interactions between treatment effects and patient subsets. Biometrics. 1985;41(2):361–372. doi: 10.2307/2530862. - DOI - PubMed

Publication types