

DOT1L regulates chromatin reorganization and gene expression during sperm differentiation
- PMID: 37099396
- PMCID: PMC10240200
- DOI: 10.15252/embr.202256316
DOT1L regulates chromatin reorganization and gene expression during sperm differentiation
Abstract
Spermatozoa have a unique genome organization. Their chromatin is almost completely devoid of histones and is formed instead of protamines, which confer a high level of compaction and preserve paternal genome integrity until fertilization. Histone-to-protamine transition takes place in spermatids and is indispensable for the production of functional sperm. Here, we show that the H3K79-methyltransferase DOT1L controls spermatid chromatin remodeling and subsequent reorganization and compaction of the spermatozoon genome. Using a mouse model in which Dot1l is knocked-out (KO) in postnatal male germ cells, we found that Dot1l-KO sperm chromatin is less compact and has an abnormal content, characterized by the presence of transition proteins, immature protamine 2 forms and a higher level of histones. Proteomic and transcriptomic analyses performed on spermatids reveal that Dot1l-KO modifies the chromatin prior to histone removal and leads to the deregulation of genes involved in flagellum formation and apoptosis during spermatid differentiation. As a consequence of these chromatin and gene expression defects, Dot1l-KO spermatozoa have less compact heads and are less motile, which results in impaired fertility.
Keywords: H3K79 methylation; flagellum development; gene regulation; histone-to-protamine transition; spermatogenesis.
© 2023 The Authors. Published under the terms of the CC BY 4.0 license.
Conflict of interest statement
The authors declare that they have no conflict of interest.
Figures

- A
Spermatogenesis scheme representing the dynamic of histone to protamine transition.
- B
Western blot detection of DOT1L and TUBULIN (TUB) in whole testicular protein extracts from CTL and Dot1l‐KO (KO) adult mice.
- C
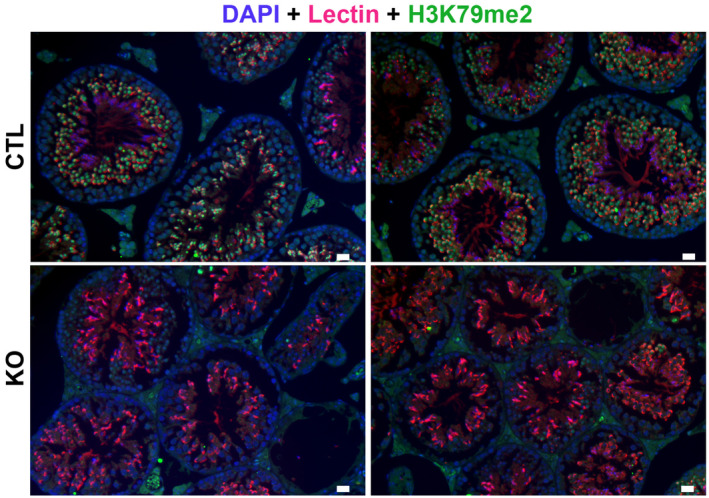
Immunohistochemistry detection of DOT1L in testicular sections from CTL and Dot1l‐KO (KO) adult mice. ES, elongating spermatids; RS, round spermatids; SC, spermatocytes. Pictures were taken using the same parameters. Scale bars indicate 50 μm.
- D
Western blot detection of DOT1L and H3K79me2 in Dot1l‐KO (KO) and CTL germ cells. Normalization was performed by detecting the membrane with anti‐TUBULIN (TUB). SC = primary spermatocytes, RS = round spermatids.

- A
Scatter plots (mean ± standard error of the mean, SEM) showing the average testis weight, body weight and sperm count in Dot1l‐KO and CTL adult mice (from ~ 2‐ to 4‐month‐old males, N > 10 biological replicates for CTL and Dot1l‐KO).
- B
Histology of Dot1l‐KO and CTL testes (periodic acid‐Schiff staining). Scale bars indicate 200 μm.
- C
Schematic diagram representing total number of each cell type per testis in CTL and Dot1l‐KO males, as calculated by FACS (mean ± SEM). 4N = Primary spermatocytes, 2N = Secondary spermatocytes, N = spermatids, SP = Side Population representing premeiotic germ cells (spermatogonia). Testes from 4 CTL and 3 Dot1l‐KO males were analyzed (biological replicates). *P‐value < 0.05 or **P‐value < 0.01 (Student t‐test).
- D
Results from the tests of fertility (natural mating) of Dot1l‐KO and CTL males (seven males in each group mated for ~ 3 months with wild‐type females). Schematic diagrams representing the number of litters and the litter size from progeny of Dot1l‐KO or CTL males (mean ± SEM).The P‐value obtained with a Student t‐test is indicated on each graph.
- E
In vivo (left panel) and in vitro fertilization results. The percentages of fertilized oocytes are indicated for WT, CTL, and HET males (‘all CTL’) and for Dot1l‐KO males. The left panel shows the mean (± SEM) fertilization rate of oocytes collected in superovulated females 24 h after natural mating. Nine and six females with a positive vaginal plug were analyzed after mating with CTL and Dot1l‐KO males, respectively. This represents 113 and 73 oocytes analyzed after mating with CTL or KO males, respectively. The central and right panels show in vitro fertilization results (mean fertilization rate ± SEM) using oocytes with intact cumulus, or using oocytes of which the zona pellucida was removed beforehand. **P‐value < 0.005 or ***P‐value < 0.0005 (unpaired t‐test performed after angular transformation of percentages).
- A
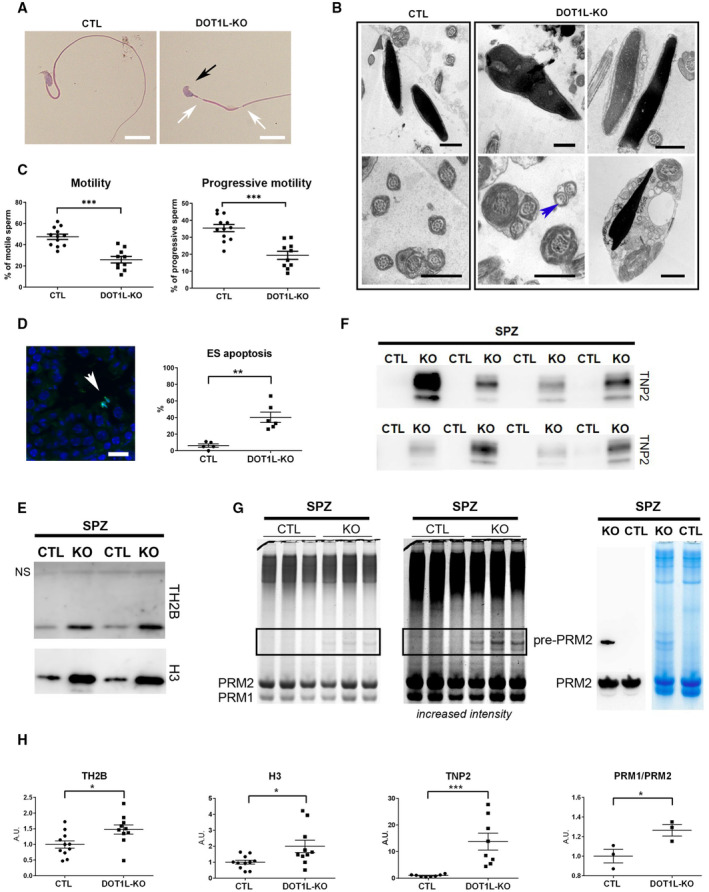
Representative pictures of Dot1l‐KO and CTL epididymal spermatozoa. The black arrow indicates an abnormal sperm head (without apical hook) and white arrows indicate thinning of the flagellum. Scale bars represent 10 μm.
- B
Ultrastructure pictures (electron microscopy) from epididymal spermatozoa showing multiple abnormalities in Dot1l‐KO compared to CTL: disorganized microtubules (blue arrow), impaired nuclear compaction (top panels) and increased cytoplasmic retention (bottom right panel). Scale bars represent 1 μm.
- C
Scatter plots (mean values following angular transformation ± SEM) of the percentage of motile and progressively motile spermatozoa in Dot1l‐KO and CTL adult mice (N = 12 biological replicates for CTL and 10 biological replicates for Dot1l‐KO) obtained following CASA (computer‐assisted sperm analysis). ***P‐value < 0.0005 (Mann–Whitney test performed after angular transformation of the percentages).
- D
Scatter plots showing the percentage of testicular tubules with TUNEL‐positive elongating/condensing spermatids (ES) (mean per animal ± SEM, N = 5 biological replicates for CTL and 6 biological replicates for Dot1l‐KO). **P‐value < 0.005 (unpaired t‐test performed after angular transformation of percentages). A representative picture of Dot1l‐KO testicular sections following TUNEL assay is shown on the left. TUNEL positive elongating/condensing spermatids are visible inside the tubule (in green, white arrowhead). DAPI (blue) was used to stain nuclei. Scale bar indicates 20 μm.
- E
Western blot detection of histones H3 and TH2B in spermatozoa from Dot1l‐KO and CTL males. The same quantity of material was loaded in each well (i.e., extracts from 2 million spermatozoa). NS indicates a non‐specific band also observed on the membrane stained with Ponceau (see Appendix Fig S3C).
- F
Western blot detection of transition protein 2 (TNP2) in spermatozoa from Dot1l‐KO and CTL males. The same quantity of material was loaded in each well (i.e., extracts from 2 million spermatozoa).
- G
Coomassie‐stained protamine extracts from CTL and Dot1l‐KO spermatozoa following acid urea gel electrophoresis (same gel, two different intensities). The same quantity of material has been loaded in each well (i.e., extracts from 1.4 million spermatozoa). Protamine 1 and 2 bands (PRM1 and PRM2, respectively) are detected at the bottom of the gel. The rectangle highlights the bands that are likely immature forms of Protamine 2 (i.e., non‐cleaved precursor forms). The right panel shows a western blot detection using anti‐PRM2 antibody which confirms that one of the high molecular weight band only observed in Dot1l‐KO spermatozoa is an immature form of Protamine 2 (Pre‐PRM2). The corresponding Coomassie‐stained gel is also shown.
- H
Quantification of histones TH2B and H3 (N = 11 and 10 biological replicates for CTL and KO, respectively), of TNP2 (N = 8 biological replicates for CTL and for KO) and of PRM1/PRM2 ratio (N = 3 biological replicates for CTL and for KO) in Dot1l‐KO and CTL spermatozoa, related to Fig 3E–G. The data shown are normalized to control mean values (± SEM). *P‐value < 0.05, ***P‐value < 0.0005 (unpaired t‐tests). A.U. = arbitrary units.

- A
Scatter plots showing the quantification of sperm abnormalities (mean ± SEM; N = 4–5 and four biological replicates for CTL and KO, respectively). Stars indicate significant differences obtained using t‐tests after angular transformation of the percentages (*P‐value < 0.05, **P‐value < 0.005, and ***P‐value < 0.0005).
- B
Motility parameters from Dot1l‐KO and CTL spermatozoa following CASA (computer‐assisted sperm analyses) (mean ± SEM; N = 12 and 10 biological replicates for CTL and KO, respectively). Specifically, Dot1l‐KO spermatozoa are slower and more static. They have a more linear movement (LIN) and a decreased straightness (STR), decreased lateral displacements of their heads (ALH) with a lower curvilinear velocity (VCL) resulting in a straight‐line velocity (VSL) similar to CTL spermatozoa but a higher Average Path Velocity (VAP). Stars indicate significant differences obtained using Mann–Whitney t‐tests after angular transformation of the percentages (**P‐value < 0.01, ***P‐value < 0.001, ****P‐value < 0.0001, ‘ns’ indicates non‐significance). The Beat Cross Frequency (BCF) of CTL and Dot1l ‐KO spermatozoa is similar.

- A, B
Bar plots showing the quantification of post‐translational modifications (PTMs) in histones H3 and H4 in ES (elongating/condensing spermatids) by LC–MS/MS. After normalization to be at constant amount of histone H3 or H4 in each analyzed sample (see Materials and Methods), mass spectrometry signals were divided by the average signal in both conditions (CTL and KO), so as to be able to represent all peptides in the same figure, whatever their MS intensity. Quantitative data obtained on biological replicates (N = 3 for CTL and 3 for KO) were plotted as dots, and the height of the bars indicates the average value (mean ± standard deviation, SD). T‐tests were performed to estimate the possible significant difference of modified peptide abundances between the two genotypes. *P‐value < 0.05, ** P‐value < 0.005, and ***P‐value < 0.0005. When interpreting our mass spectrometry data against the database MS_histoneDB, we were able to identify various H3 variants, namely canonical H3 and variants H3.3, testis‐specific H3t and H3mm13. “H3” indicates sequences shared among several variants; “H3.3,” “H3t,” or “H3mm13”, each variant. A.U. = arbitrary units.


- A
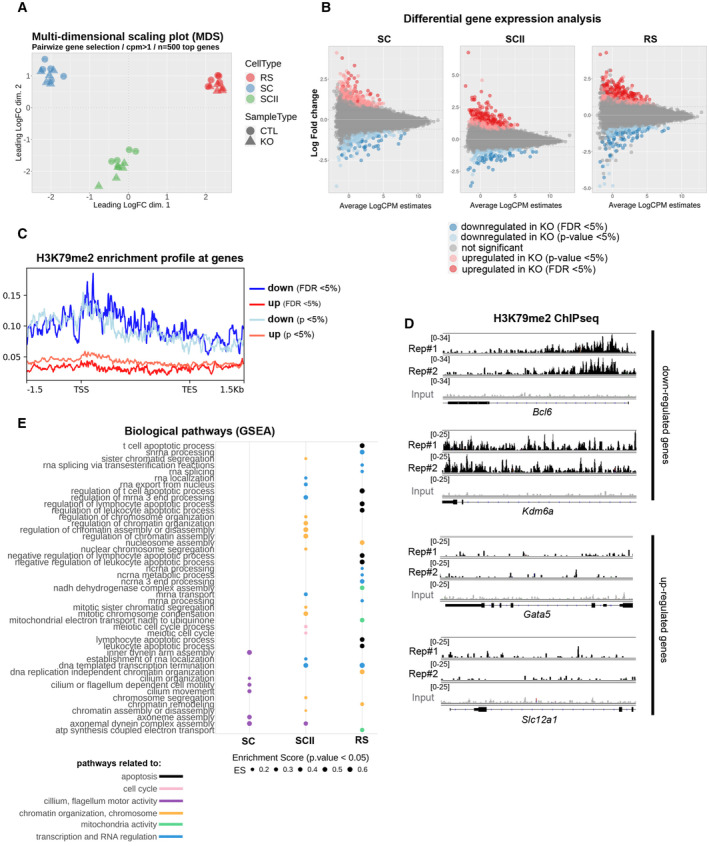
Multi‐dimensional scaling plot on the 500 top genes in Dot1l‐KO versus CTLs primary spermatocytes (SC), secondary spermatocytes (SCII), and round spermatids (RS) using pairwise gene selection.
- B
MD plot of the genes found deregulated in Dot1l‐KO versus CTLs SC, SCII, and RS, using differential gene expression analyses with two different parameters (FDR < 0.05 and P‐value < 0.05).
- C
H3K79me2 enrichment profile at deregulated genes (same parameters as in B).
- D
H3K79me2 enrichment profile at selected deregulated genes, in two biological replicates of ChIP‐Seq performed in wild type RS (Rep#1 and 2). The input value is shown in gray.
- E
GSEA analysis of RNA‐Seq data from Dot1l‐KO versus CTL SC, SCII and RS. The figure shows all the biological pathways found significantly downregulated in Dot1l‐KO primary spermatocytes (SC), secondary spermatocytes (SCII), and round spermatids (P < 0.05), ranked by their enrichment score (ES).

References
-
- Ahmed EA, de Rooij DG (2009) Staging of mouse seminiferous tubule cross‐sections. Methods Mol Biol 558: 263–277 - PubMed
Publication types
MeSH terms
Substances
LinkOut - more resources
Full Text Sources
Research Materials
