

A synaptic molecular dependency network in knockdown of autism- and schizophrenia-associated genes revealed by multiplexed imaging
- PMID: 37099425
- PMCID: PMC10259678
- DOI: 10.1016/j.celrep.2023.112430
A synaptic molecular dependency network in knockdown of autism- and schizophrenia-associated genes revealed by multiplexed imaging
Abstract
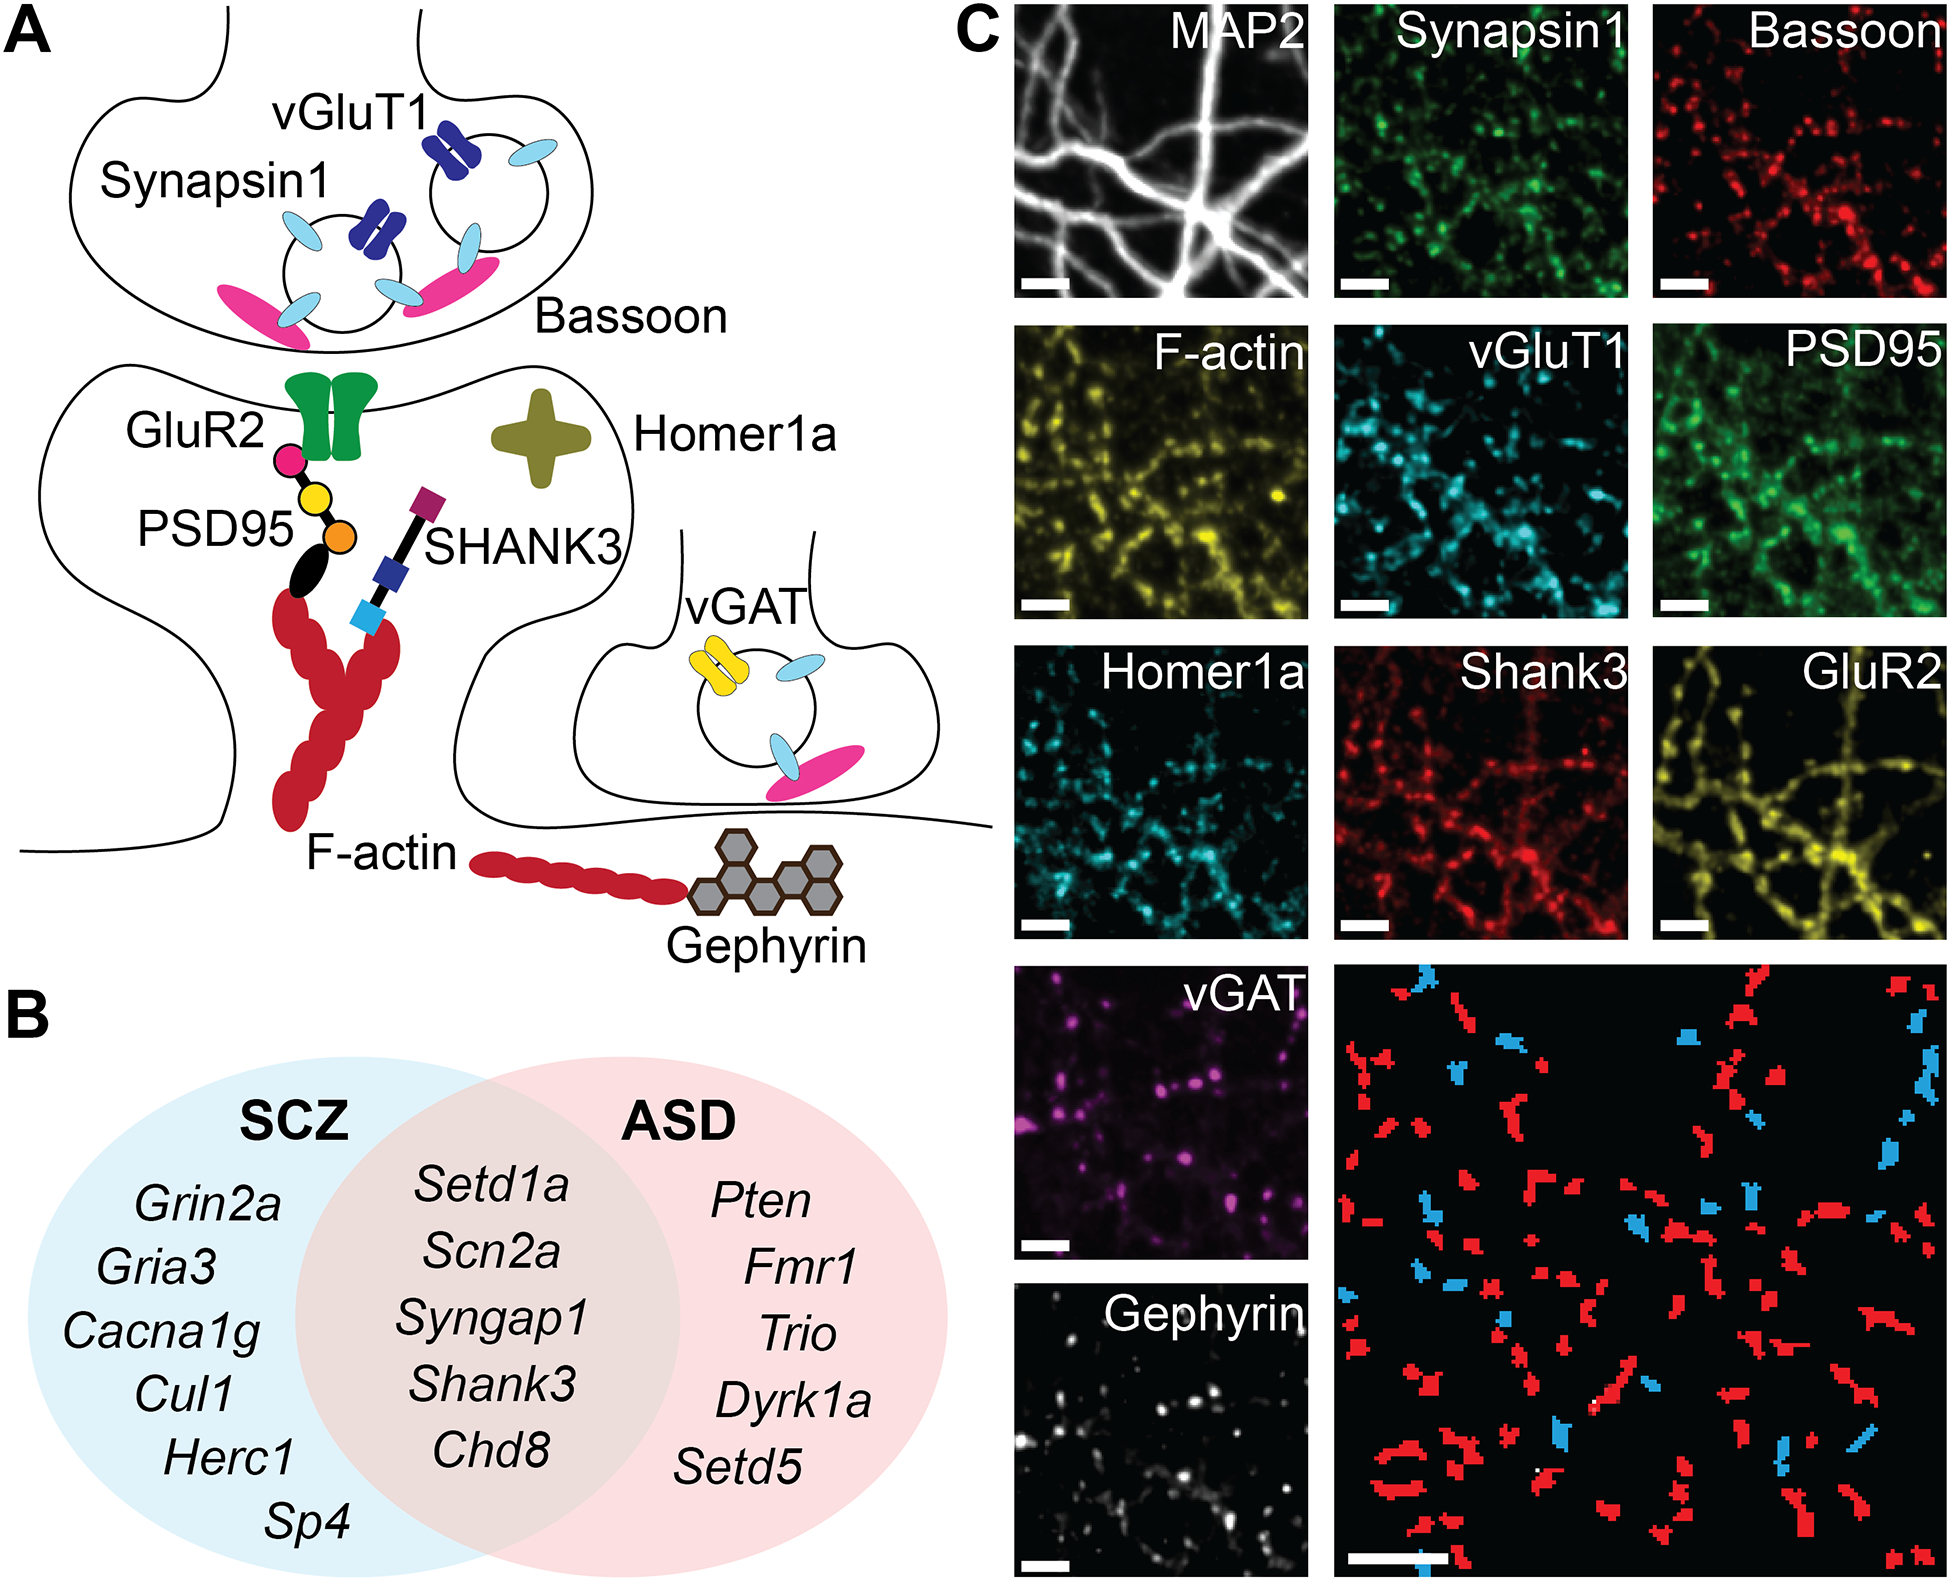
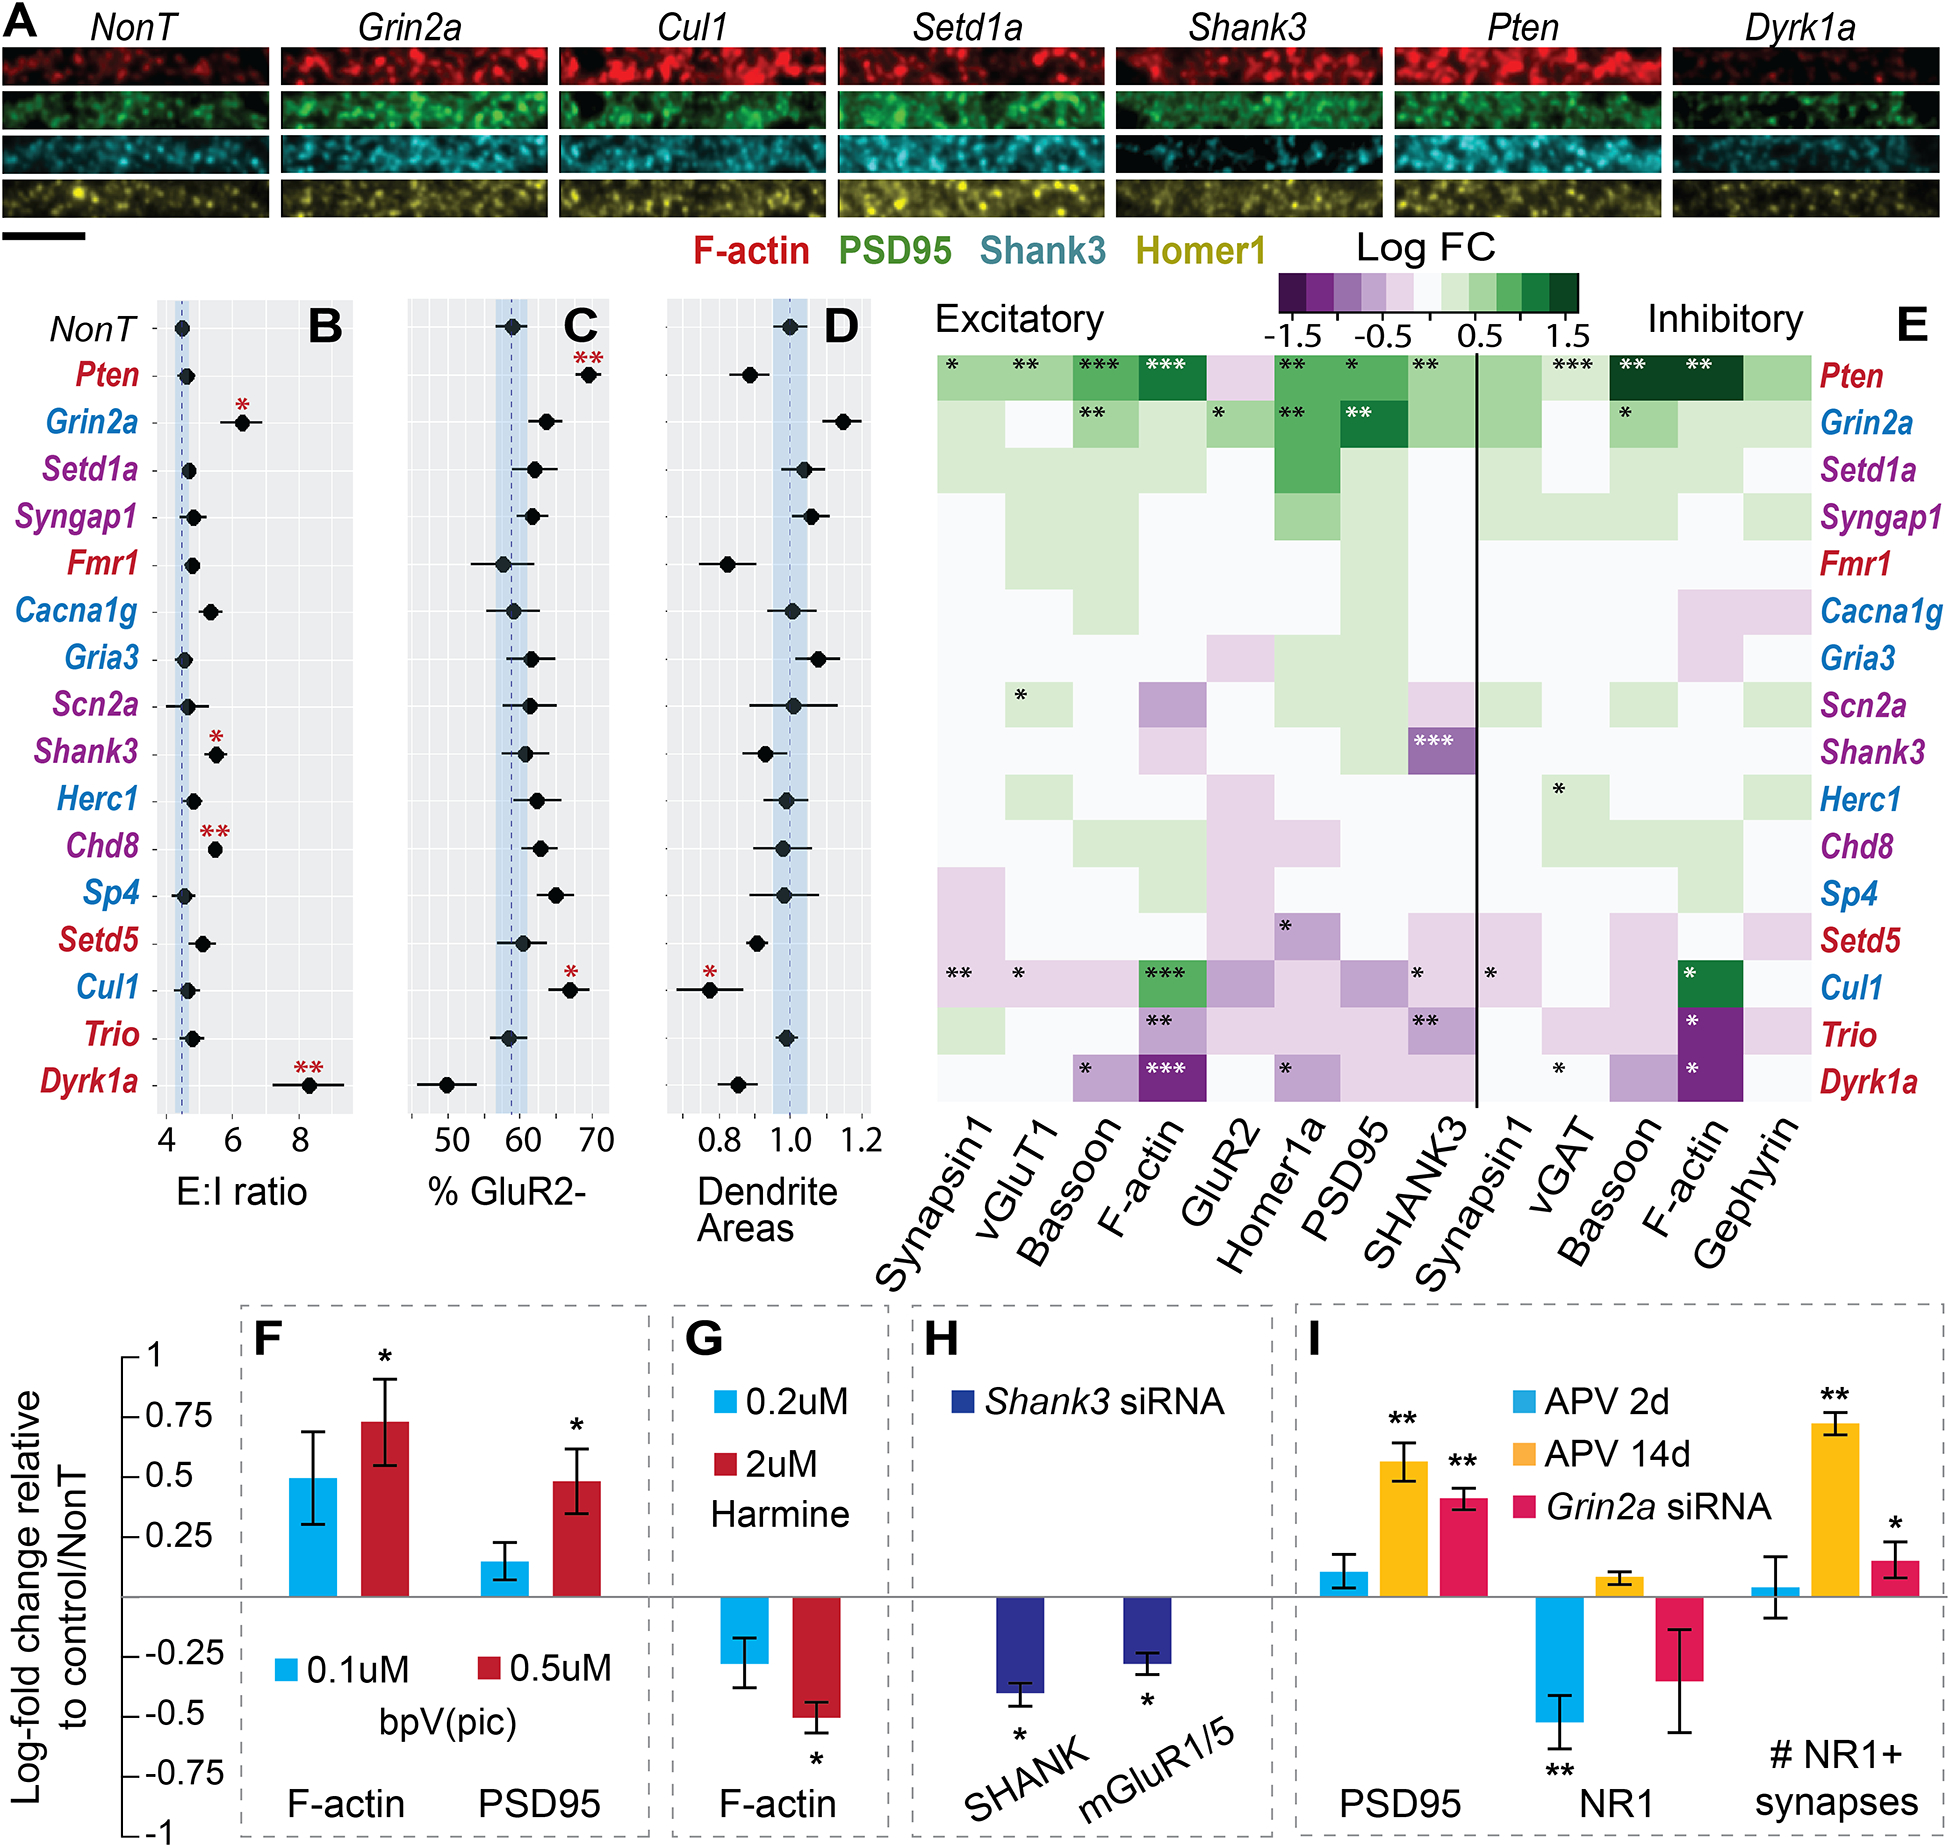
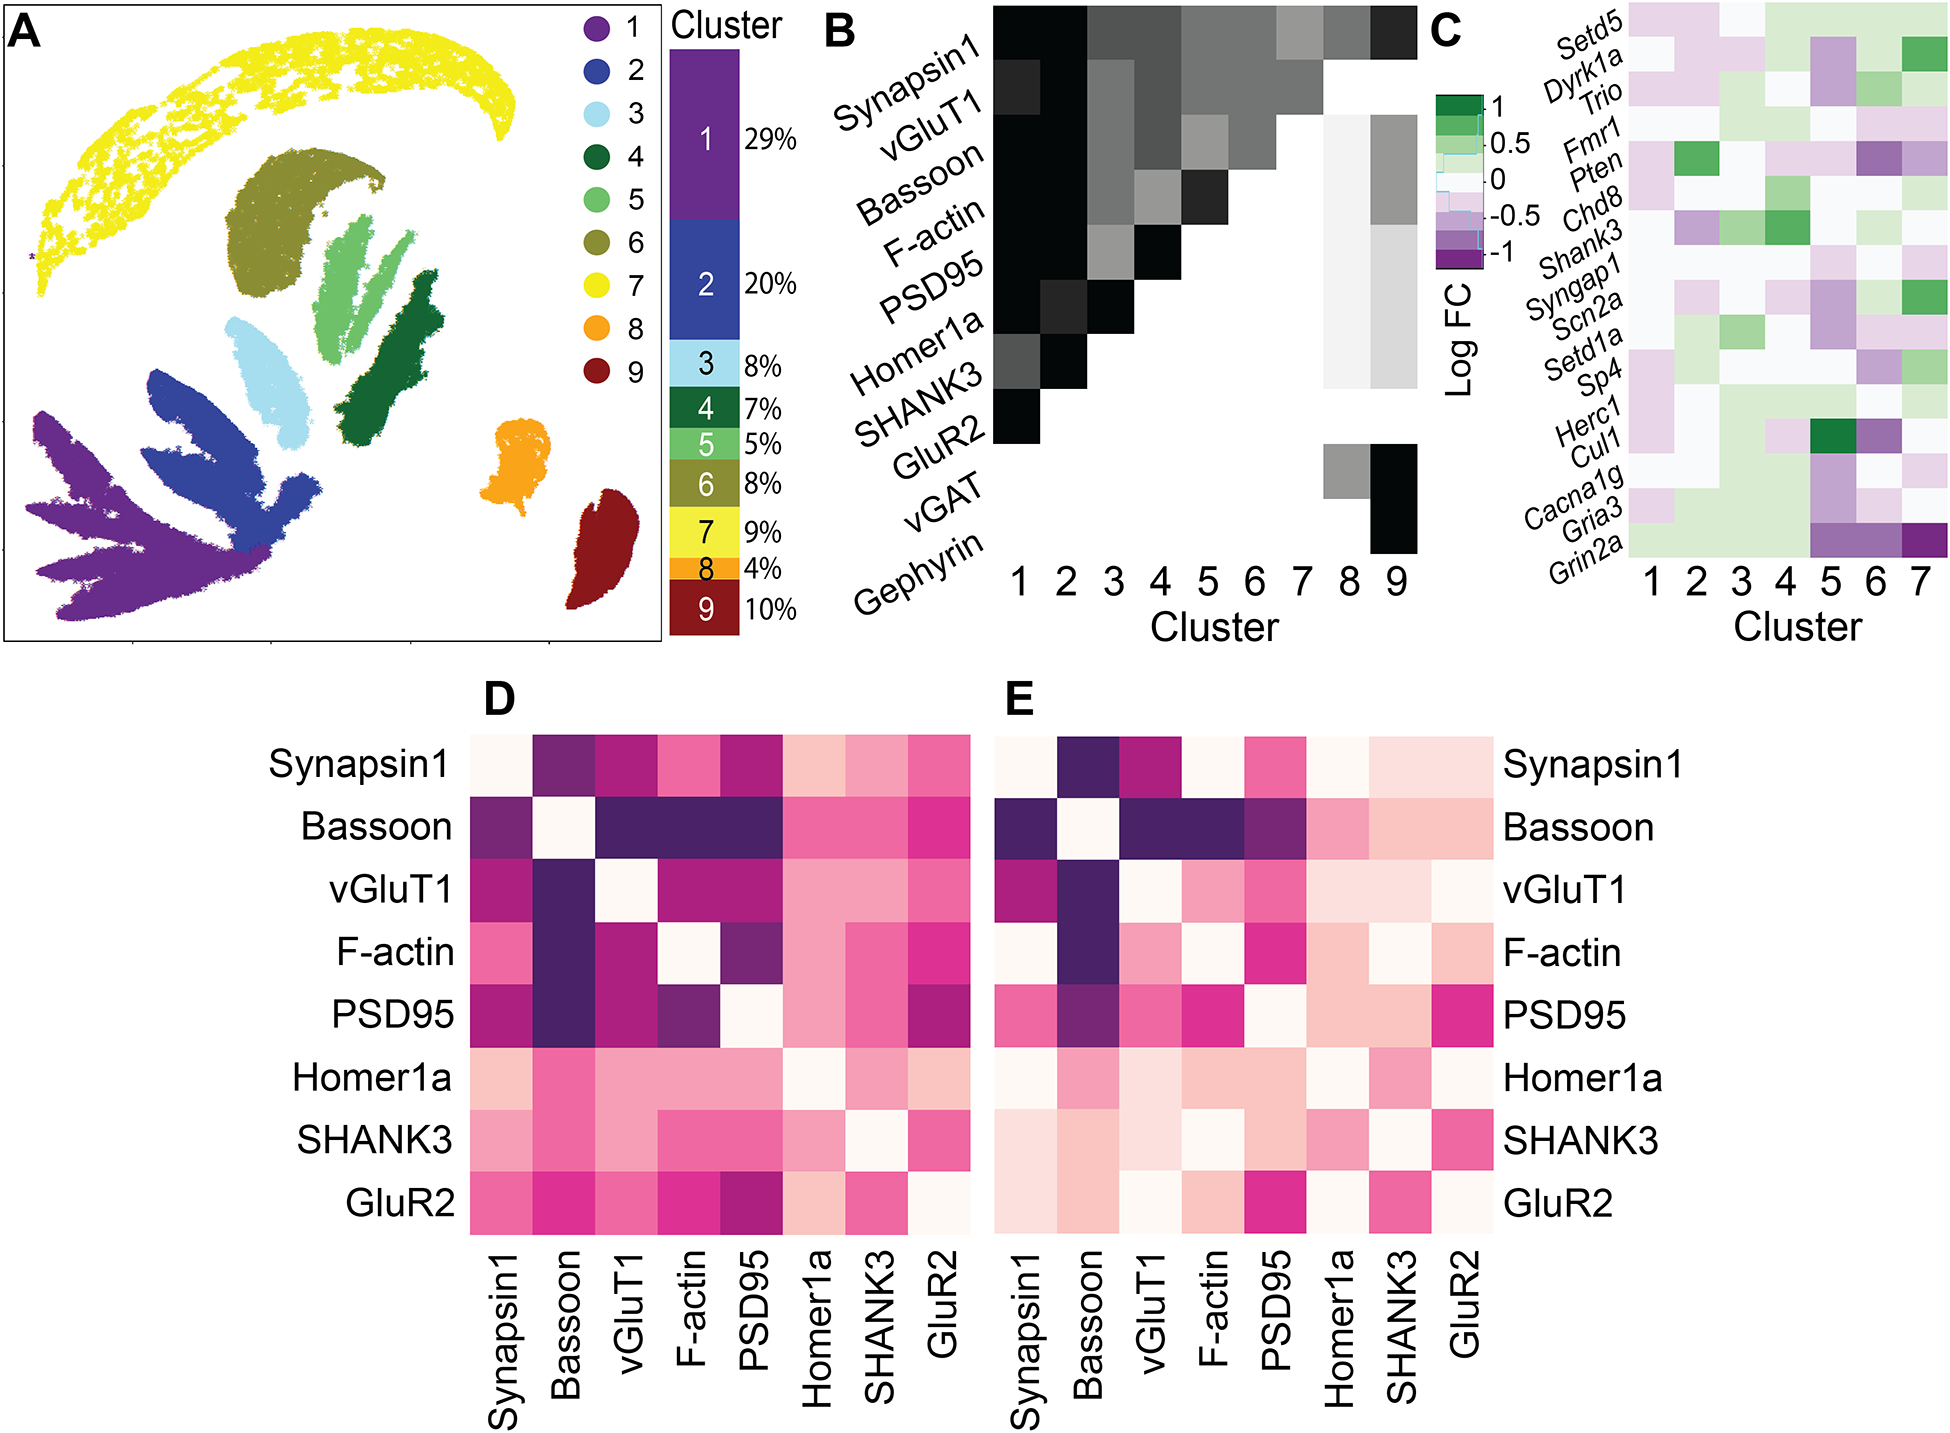
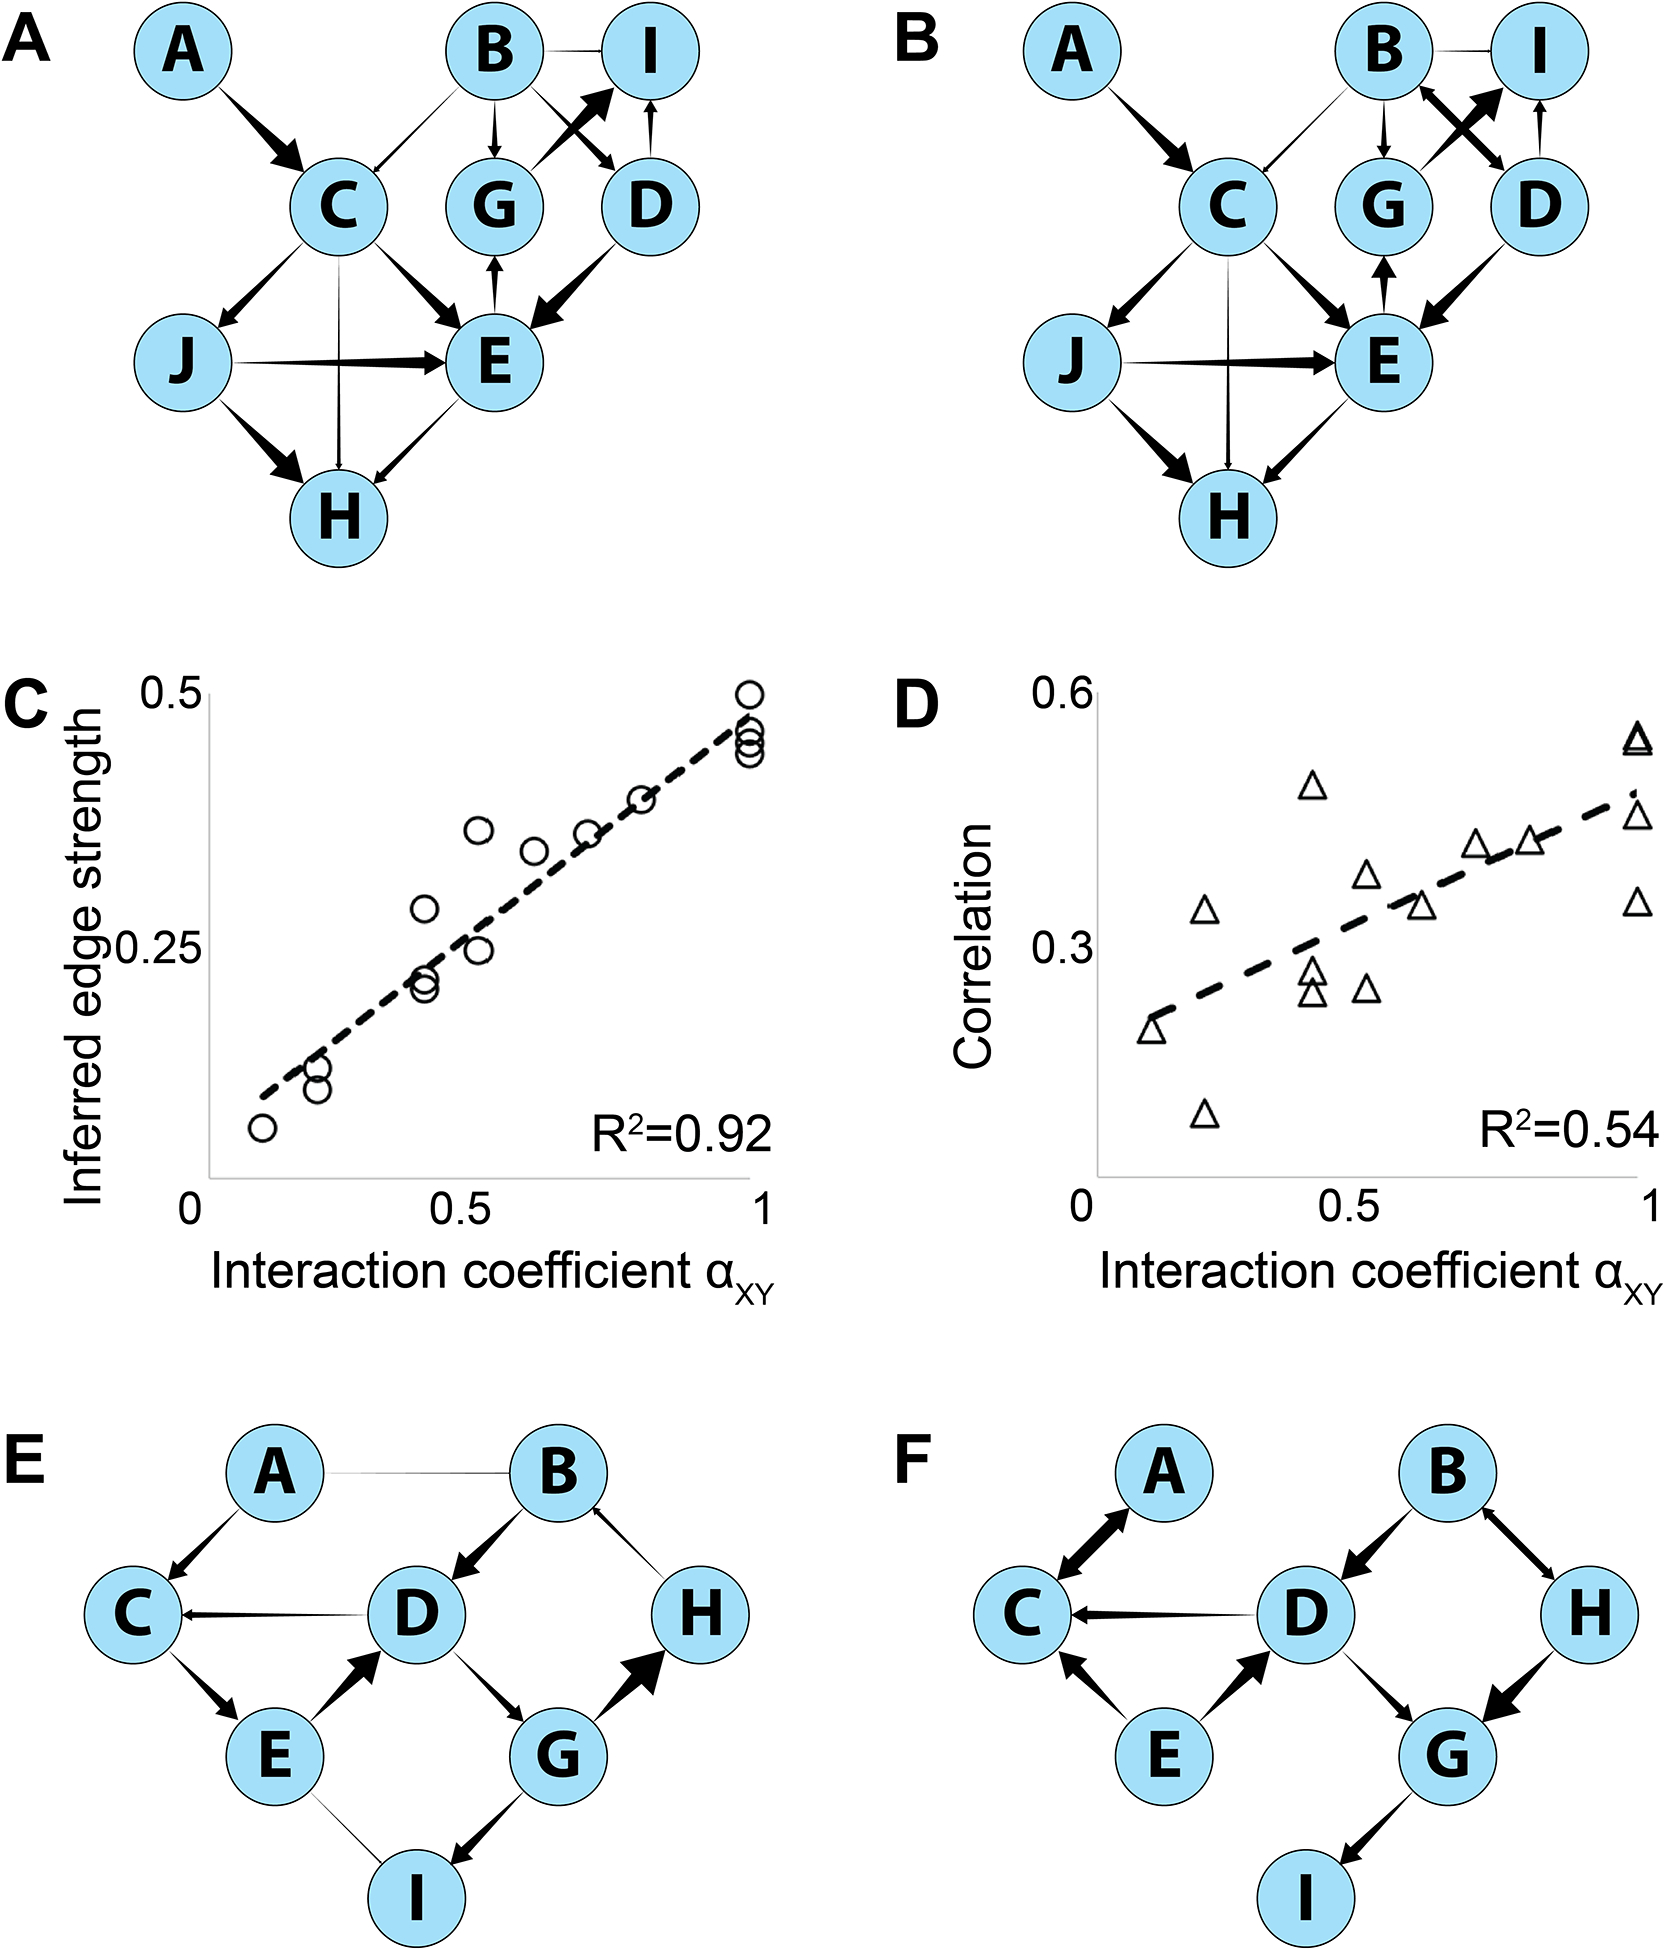
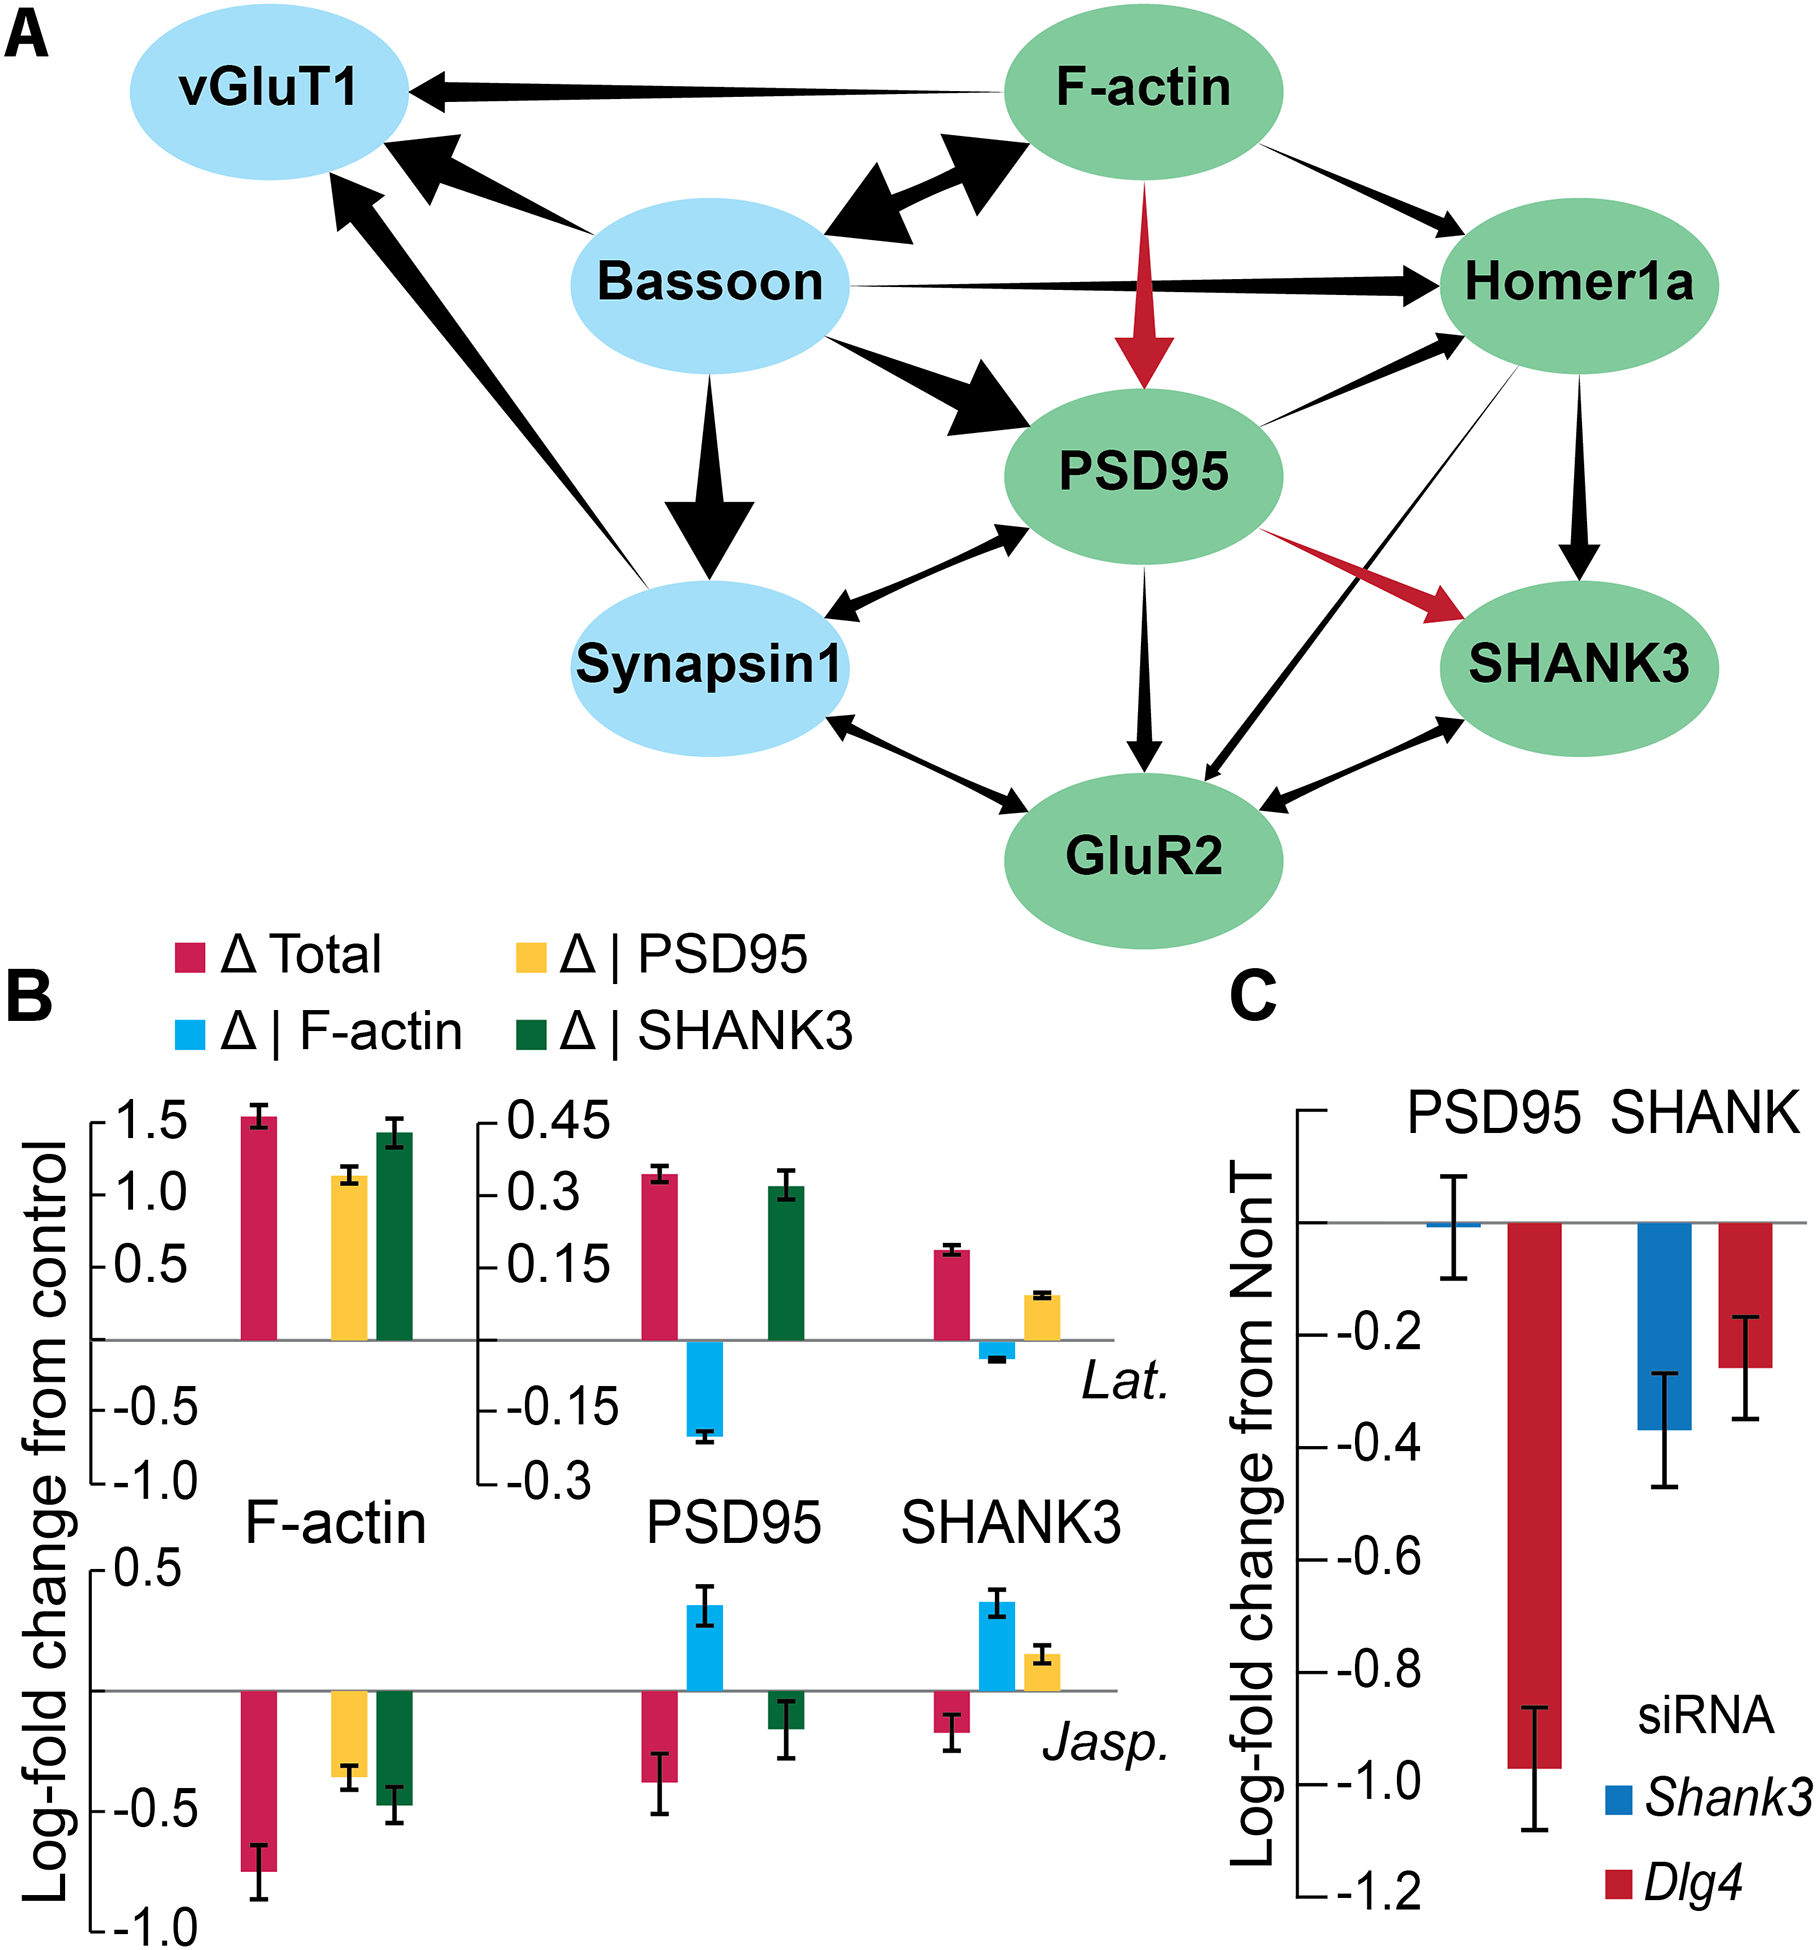
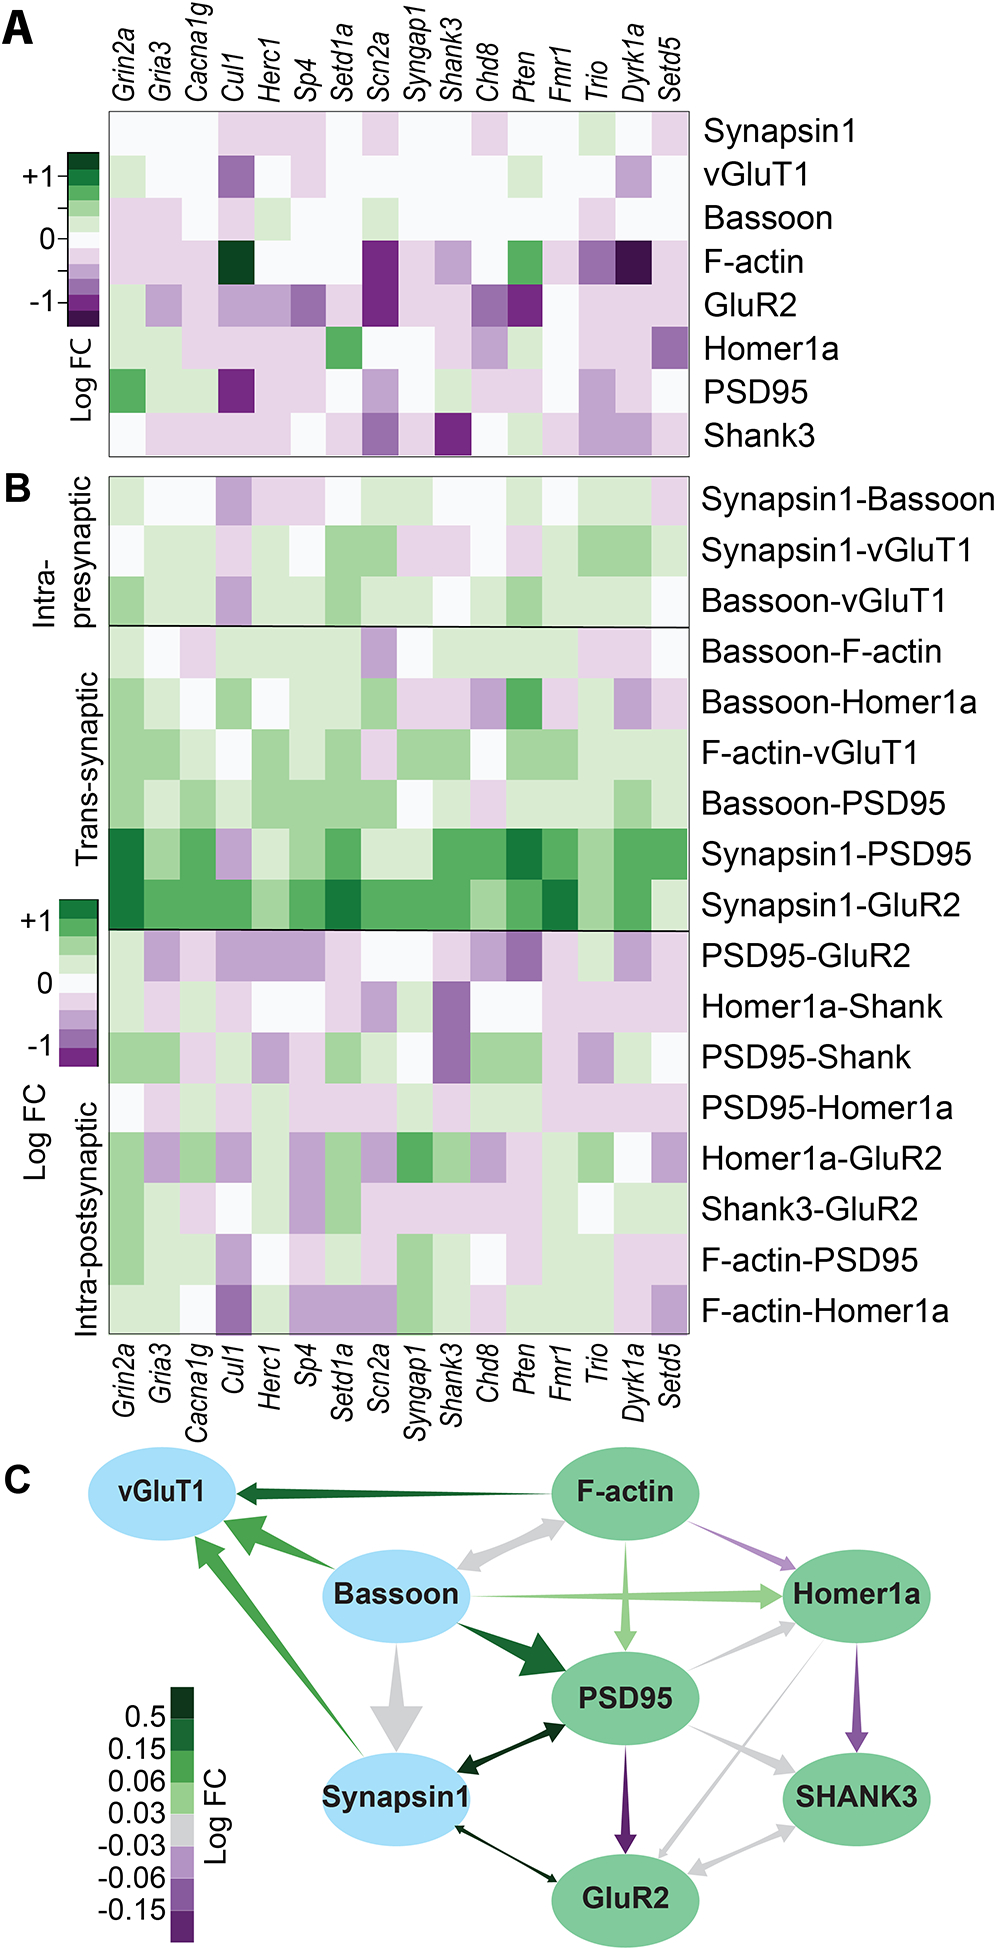
The complex functions of neuronal synapses depend on their tightly interconnected protein network, and their dysregulation is implicated in the pathogenesis of autism spectrum disorders and schizophrenia. However, it remains unclear how synaptic molecular networks are altered biochemically in these disorders. Here, we apply multiplexed imaging to probe the effects of RNAi knockdown of 16 autism- and schizophrenia-associated genes on the simultaneous joint distribution of 10 synaptic proteins, observing several protein composition phenotypes associated with these risk genes. We apply Bayesian network analysis to infer hierarchical dependencies among eight excitatory synaptic proteins, yielding predictive relationships that can only be accessed with single-synapse, multiprotein measurements performed simultaneously in situ. Finally, we find that central features of the network are affected similarly across several distinct gene knockdowns. These results offer insight into the convergent molecular etiology of these widespread disorders and provide a general framework to probe subcellular molecular networks.
Keywords: Bayesian network inference; CP: Genomics; CP: Neuroscience; RNAi; autism; genetic screen; molecular network; multiplexed imaging; schizophrenia; siRNA; synapse; synaptic protein.
Copyright © 2023 The Author(s). Published by Elsevier Inc. All rights reserved.
Conflict of interest statement
Declaration of interests The authors declare no competing interests.
Figures
Similar articles
-
Common mechanisms of excitatory and inhibitory imbalance in schizophrenia and autism spectrum disorders.Curr Mol Med. 2015;15(2):146-67. doi: 10.2174/1566524015666150303003028. Curr Mol Med. 2015. PMID: 25732149 Free PMC article. Review.
-
Glutamatergic Dysfunction and Synaptic Ultrastructural Alterations in Schizophrenia and Autism Spectrum Disorder: Evidence from Human and Rodent Studies.Int J Mol Sci. 2020 Dec 23;22(1):59. doi: 10.3390/ijms22010059. Int J Mol Sci. 2020. PMID: 33374598 Free PMC article. Review.
-
Neuroligin-2 as a central organizer of inhibitory synapses in health and disease.Sci Signal. 2020 Dec 22;13(663):eabd8379. doi: 10.1126/scisignal.abd8379. Sci Signal. 2020. PMID: 33443230 Review.
-
Synaptic and Gene Regulatory Mechanisms in Schizophrenia, Autism, and 22q11.2 Copy Number Variant-Mediated Risk for Neuropsychiatric Disorders.Biol Psychiatry. 2020 Jan 15;87(2):150-163. doi: 10.1016/j.biopsych.2019.06.029. Epub 2019 Jul 11. Biol Psychiatry. 2020. PMID: 31500805 Free PMC article.
-
PSD95: A synaptic protein implicated in schizophrenia or autism?Prog Neuropsychopharmacol Biol Psychiatry. 2018 Mar 2;82:187-194. doi: 10.1016/j.pnpbp.2017.11.016. Epub 2017 Nov 21. Prog Neuropsychopharmacol Biol Psychiatry. 2018. PMID: 29169997 Free PMC article. Review.
Cited by
-
An inhibitory circuit-based enhancer of DYRK1A function reverses Dyrk1a-associated impairment in social recognition.Neuron. 2023 Oct 4;111(19):3084-3101.e5. doi: 10.1016/j.neuron.2023.09.009. Neuron. 2023. PMID: 37797581 Free PMC article.
-
SRC family kinase inhibition rescues molecular and behavioral phenotypes, but not protein interaction network dynamics, in a mouse model of Fragile X syndrome.Mol Psychiatry. 2024 May;29(5):1392-1405. doi: 10.1038/s41380-024-02418-7. Epub 2024 Jan 31. Mol Psychiatry. 2024. PMID: 38297084 Free PMC article.
-
Data-driven synapse classification reveals a logic of glutamate receptor diversity.bioRxiv [Preprint]. 2025 Jan 14:2024.12.11.628056. doi: 10.1101/2024.12.11.628056. bioRxiv. 2025. PMID: 39713368 Free PMC article. Preprint.
-
Scaled and efficient derivation of loss-of-function alleles in risk genes for neurodevelopmental and psychiatric disorders in human iPSCs.Stem Cell Reports. 2024 Oct 8;19(10):1489-1504. doi: 10.1016/j.stemcr.2024.08.003. Epub 2024 Sep 12. Stem Cell Reports. 2024. PMID: 39270650 Free PMC article.
-
ZCCHC17 knockdown phenocopies Alzheimer's disease-related loss of synaptic proteins and hyperexcitability.J Neuropathol Exp Neurol. 2024 Jun 20;83(7):626-635. doi: 10.1093/jnen/nlae033. J Neuropathol Exp Neurol. 2024. PMID: 38630575 Free PMC article.
References
-
- Grant SGN Synapse signalling complexes and networks: Machines underlying cognition. BioEssays 25, 1229–1235 (2003). - PubMed
-
- Grant SGN The synapse proteome and phosphoproteome: A new paradigm for synapse biology. Biochem. Soc. Trans 34, 59–63 (2006). - PubMed
-
- Husi H, Ward MA, Choudhary JS, Blackstock WP & Grant SGN Proteomic analysis of NMDA receptor – adhesion protein signaling complexes. Nat. Neurosci 3, 661–669 (2000). - PubMed
Publication types
MeSH terms
Grants and funding
LinkOut - more resources
Full Text Sources
Medical
Miscellaneous
