. 2023 Apr 25;42(4):112395.
doi: 10.1016/j.celrep.2023.112395. Epub 2023 Apr 4.

Vaccination provides superior in vivo recall capacity of SARS-CoV-2-specific memory CD8 T cells

Affiliations

Vaccination provides superior in vivo recall capacity of SARS-CoV-2-specific memory CD8 T cells

Inga Kavazović et al. Cell Rep. .

Abstract

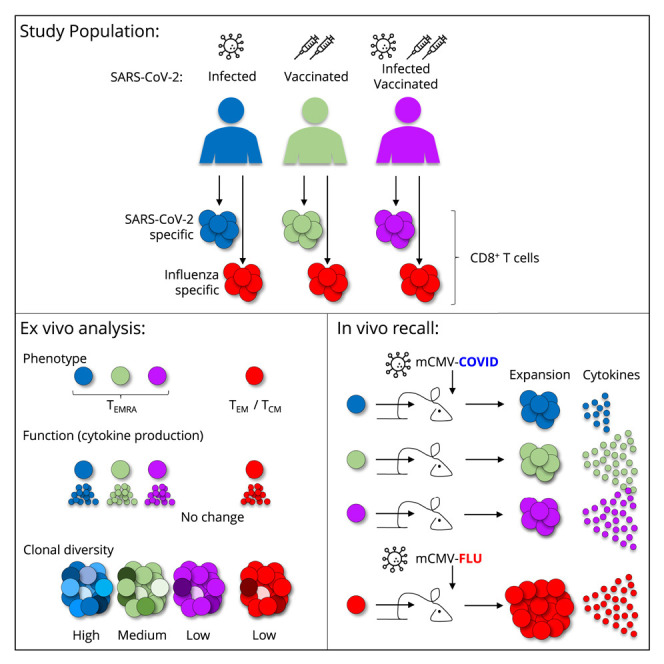
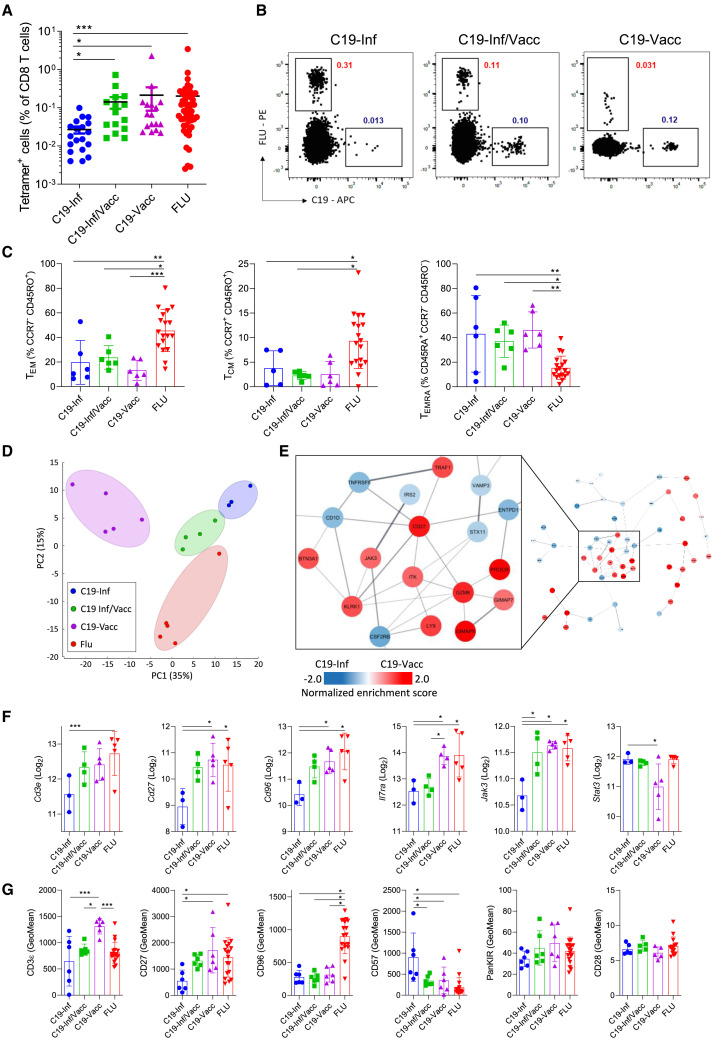
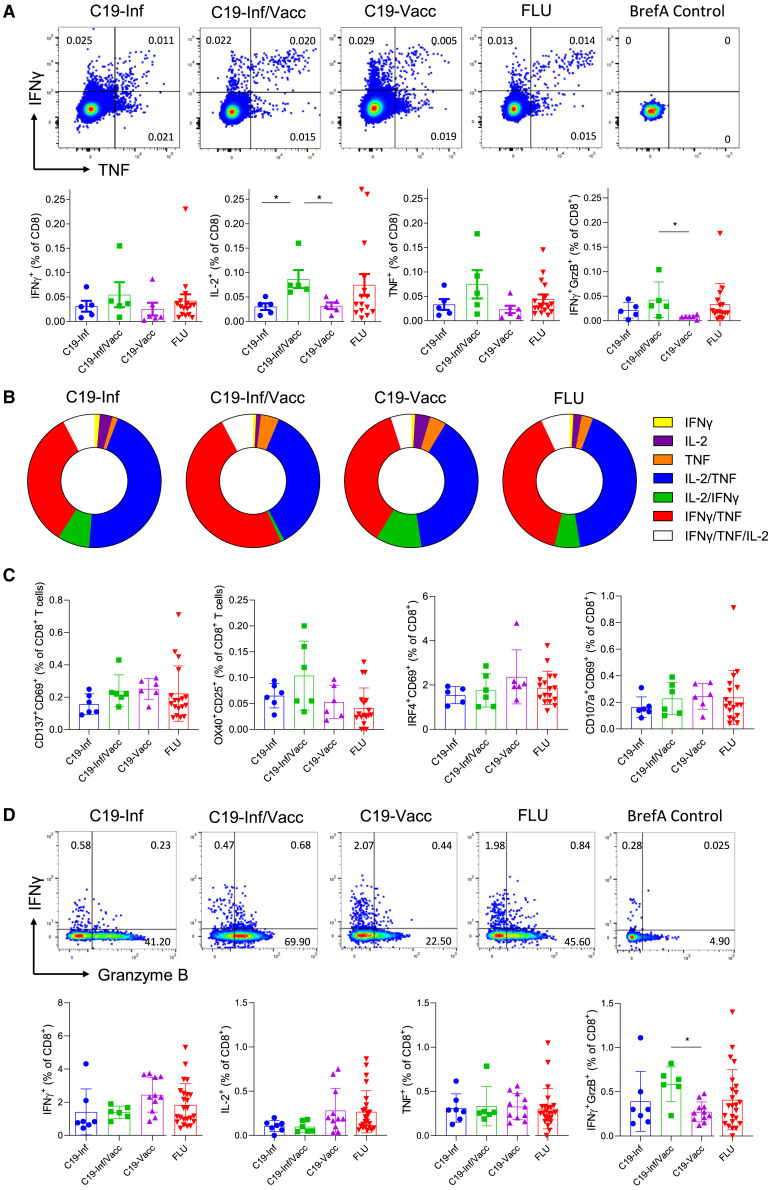
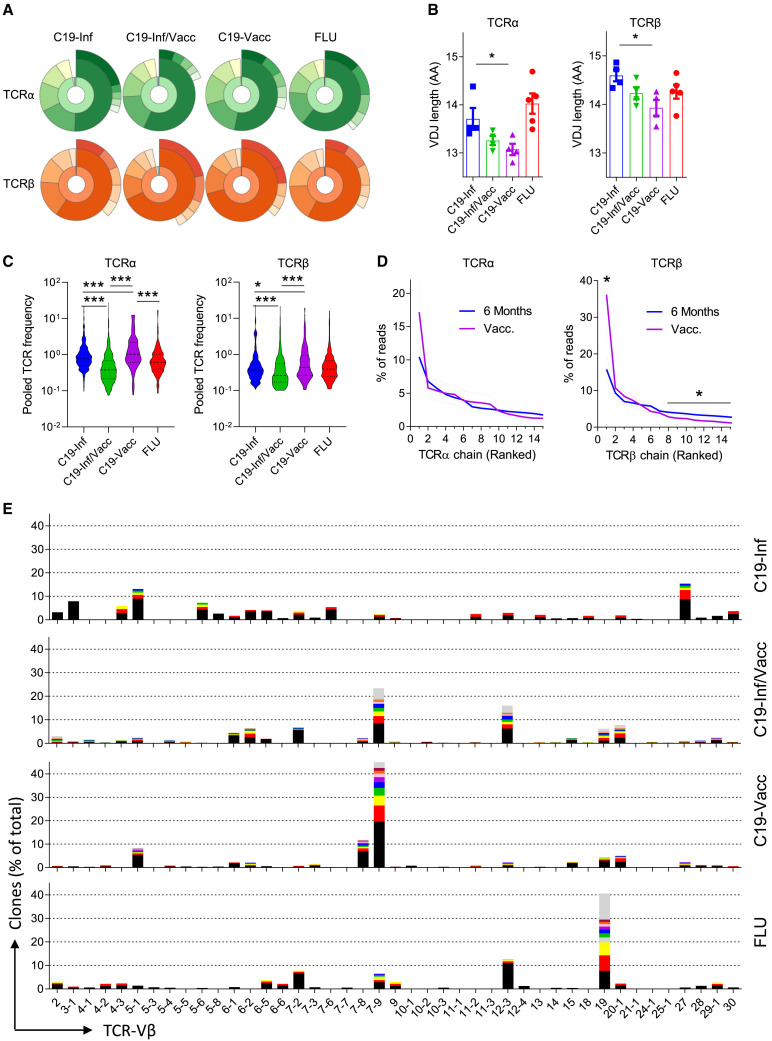
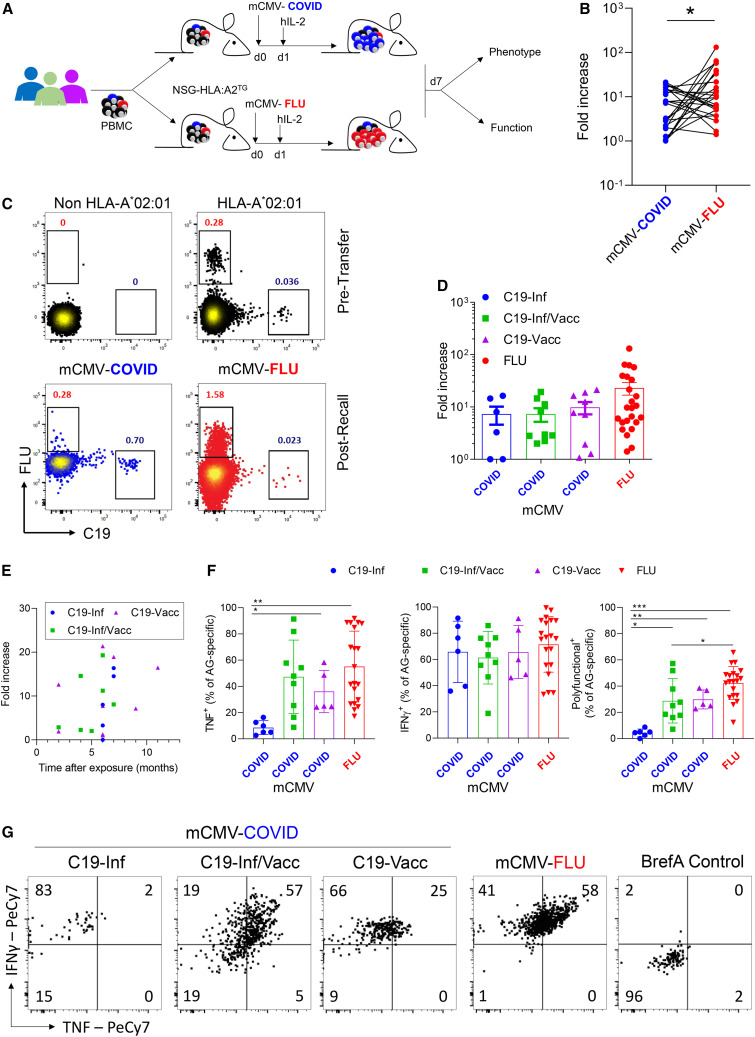
Memory CD8 T cells play an important role in the protection against breakthrough infections with severe acute respiratory syndrome coronavirus 2 (SARS-CoV-2). Whether the route of antigen exposure impacts these cells at a functional level is incompletely characterized. Here, we compare the memory CD8 T cell response against a common SARS-CoV-2 epitope after vaccination, infection, or both. CD8 T cells demonstrate comparable functional capacity when restimulated directly ex vivo, independent of the antigenic history. However, analysis of T cell receptor usage shows that vaccination results in a narrower scope than infection alone or in combination with vaccination. Importantly, in an in vivo recall model, memory CD8 T cells from infected individuals show equal proliferation but secrete less tumor necrosis factor (TNF) compared with those from vaccinated people. This difference is negated when infected individuals have also been vaccinated. Our findings shed more light on the differences in susceptibility to re-infection after different routes of SARS-CoV-2 antigen exposure.

Keywords: CD8 T cells; COVID-19; CP: Immunology; SARS-CoV-2; antigen-specific T cells; clonal diversity; infection; influenza; memory cells; transcriptome; vaccination.


Conflict of interest statement

Declaration of interests The authors declare no competing interests.

Figures

None
Graphical abstract
Figure 1
Figure 1
The route of antigen exposure impacts the transcriptional and phenotypic profile of virus-specific memory cells PBMCs from 3 groups of people were analyzed directly ex vivo (Inf, people with convalescent COVID-19; Inf/Vacc, people with convalescent COVID-19 who received 2 doses of vaccine; Vacc, nonconvalescent people who received 2 doses of COVID-19 vaccine). (A) Frequency of antigen-specific (C19- or FLU-tetramer+) cells. Each dot represents one donor (n = 19 – C19-Inf, n = 15 C19-Inf/Vacc, n = 17 C19-Vacc, n = 51 FLU pooled from all 3 groups). (B) Representative fluorescence-activated cell sorting (FACS) plots of cells stained with HLA A02 tetramers loaded with the YLQPRTFLL (C19) epitope of SARS-CoV-2 or GILGFVFTL (FLU) epitope of influenza. Gated is for live CD3+CD8+ cells. (C) Quantification of TEM, TCM, and TEMRA cell subsets among C19- and FLU-specific CD8+ T cells (n = 18). (D–F) C19- and FLU-specific CD8+ T cells were sorted and analyzed by RNA sequencing. (D) Principal-component analysis of virus-specific cells based on all differentially expressed genes (n = 17). (E) The 200 most differentially expressed genes between C19-tetramer+ cells from the C19-Inf and C19-Vacc groups were subjected to protein network clustering. Shown is the largest node network for each comparison. Inset shows the largest subcluster. (F) Differential expression of individual genes (n = 17). (G) Geometric mean fluorescence intensity (GeoMean) of selected markers on C19- and FLU-specific CD8+ T cells by flow cytometry (n = 18). Indicated are means ± SEM. Statistical significances at p < 0.05, ∗∗p < 0.01, and ∗∗∗p < 0.001 using Kruskal-Wallis rank-sum test with Dunn’s post hoc test for multiple comparisons (A) or one-way ANOVA followed with Bonferroni post-testing (C, F, and G). See also Figure S1.
Figure 2
Figure 2
The route of antigen exposure does not greatly impact the direct ex vivo functionality of antigen-specific cells PBMCs were stimulated with C19 (YLQPRTFLL) or FLU (GILGFVFTL) peptide for 4 h in the presence of brefeldin A and analyzed by flow cytometry. (A) Representative FACS plots (top row) and quantification of data (bottom row) are shown. Numbers indicate percentages within the quadrant. Cells are gated for live CD3+CD8+ cells. BrefA control, cells stimulated with brefeldin A only (n = 16). (B) Donut graphs showing polyfunctional analysis of C19- and FLU-specific CD8+ T cells. Relative distribution of single or multiple cytokine-producing cells is shown for IL-2, IFNγ, and TNF (n = 16). (C and D) PBMCs were stimulated with a peptide pool of immunodominant epitopes of the spike protein of SARS-CoV-2 or of influenza HA for 4 h in the presence of brefeldin A and analyzed by flow cytometry. (C) Percentage of cells expressing the indicated activation-induced markers (AIMs) (n = 18). (D) (Top row) Representative FACS plots and (bottom row) quantification of cytokine expression (n = 24). Indicated are means ± SEM. Statistical significances at p < 0.05 and ∗∗p < 0.01 using one-way ANOVA followed by Bonferroni post-testing (A, C, and D). See also Figure S2.
Figure 3
Figure 3
SARS-CoV-2 infection causes a broader TCR repertoire than vaccination C19- and FLU-specific CD8+ T cells were sorted and TCR-α and -β chains were analyzed by RNA sequencing. (A) Donut graph of the distribution of the TCR-α (green) and -β (orange) chains of a representative individual for each group. Inner ring shows reads recovered once (blue), twice (yellow), or >2 times (orange/green). Middle ring shows relative contribution of TCR chains segregated in quintets and ranked based on their relative frequency within the total pool. Outer ring shows the contribution of the 5 most frequent TCR chains to the total pool. (B) Average length of the VDJ region (n = 17). (C) Average contribution of each TCR chain to the total pool (n = 17). (D) Contribution of the 15 most dominant TCR-β and -α chains to the total antigen-specific response (n = 17). Dashed lines indicate SEM. (E) Representative TCR-Vβ usage of four individuals. The ten most frequent TCR chains for each TCR-Vβ are color coded, and chains recovered with lower frequency are gray. Indicated are means ± SEM and statistical significances at ∗∗p < 0.05 and ∗∗∗p < 0.01 by one-way ANOVA followed by Bonferroni post-testing (B), Kruskal-Wallis rank-sum test with Dunn’s post hoc test for multiple comparisons (C), and unpaired Mann-Whitney test (D). See also Figure S3.
Figure 4
Figure 4
Vaccination-induced memory cells have increased functional potential after in vivo recall PBMCs were analyzed pretransfer for the frequency of tetramer+ cells. Cells were divided into two equal fractions and transferred to NSG-HLA:A02 transgenic mice. On the same day, animals were infected i.p. with 2 × 105 PFU mCMV-COVID or mCMV-FLU. The next day, mice were injected i.p. with human IL-2 (100 ng/mouse). 7 days post-infection, donor cells in peritoneal exudate cells (PECs) were analyzed (n = 25). (A) Experimental setup. (B) Line graph showing expansion of cells of the same donor as fold increase over pretransfer, comparing C19- with FLU-specific CD8+ T cells. (C) Representative FACS plots of CD8+ T cell stained with HLA-A02 tetramers pretransfer or 7 days post-infection. Non-HLA-A02 cells are included as negative control. Numbers indicate percentages. Gated is for live hCD45+hCD8+ cells. (D) Fold increase of antigen-specific cells segregated by C19 groups. (E) Correlation between time after last antigen exposure and the expansion of virus-specific cells after mCMV-C19 infection. (F–G) On day 7 post-infection, PECs were re-stimulated in vitro with PMA/IONO for 4 h in the presence of Brefeldin A and analyzed by flow cytometry. Shown are (F) cytokine production of live hCD45+hCD8+tetramer+ cells and (G) representative FACS plots gated for hCD45+hCD8+tetramer+ cells. Indicated are means ± SEM. p values were calculated using paired Student t test (B) and Kruskal-Wallis rank-sum test with Dunn’s post hoc test for multiple comparisons (F). p < 0.05, ∗∗p < 0.01, and ∗∗∗p < 0.001. See also Figure S4.

References

    1. Gazit S., Shlezinger R., Perez G., Lotan R., Peretz A., Ben-Tov A., Herzel E., Alapi H., Cohen D., Muhsen K., et al. SARS-CoV-2 naturally acquired immunity vs. Vaccine-induced immunity, reinfections versus breakthrough infections: a retrospective cohort study. Clin. Infect. Dis. 2022;75:e545–e551. doi: 10.1093/cid/ciac262. - DOI - PMC - PubMed
    1. Dhumal S., Patil A., More A., Kamtalwar S., Joshi A., Gokarn A., Mirgh S., Thatikonda P., Bhat P., Murthy V., et al. SARS-CoV-2 reinfection after previous infection and vaccine breakthrough infection through the second wave of pandemic in India: an observational study. Int. J. Infect. Dis. 2022;118:95–103. doi: 10.1016/j.ijid.2022.02.037. - DOI - PMC - PubMed
    1. Mallajosyula V., Ganjavi C., Chakraborty S., McSween A.M., Pavlovitch-Bedzyk A.J., Wilhelmy J., Nau A., Manohar M., Nadeau K.C., Davis M.M. CD8(+) T cells specific for conserved coronavirus epitopes correlate with milder disease in COVID-19 patients. Sci. Immunol. 2021;6:eabg5669. doi: 10.1126/sciimmunol.abg5669. - DOI - PMC - PubMed
    1. Peng Y., Felce S.L., Dong D., Penkava F., Mentzer A.J., Yao X., Liu G., Yin Z., Chen J.L., Lu Y., et al. An immunodominant NP105-113-B∗07:02 cytotoxic T cell response controls viral replication and is associated with less severe COVID-19 disease. Nat. Immunol. 2022;23:50–61. doi: 10.1038/s41590-021-01084-z. - DOI - PMC - PubMed
    1. Dan J.M., Mateus J., Kato Y., Hastie K.M., Yu E.D., Faliti C.E., Grifoni A., Ramirez S.I., Haupt S., Frazier A., et al. Immunological memory to SARS-CoV-2 assessed for up to 8 months after infection. Science. 2021;371:eabf4063. doi: 10.1126/science.abf4063. - DOI - PMC - PubMed

Publication types

Substances