. 2023 Jun 2;22(6):1997-2017.
doi: 10.1021/acs.jproteome.3c00069. Epub 2023 Apr 26.

Profiling Plant Proteome and Transcriptome Changes during Grapevine Fanleaf Virus Infection

Affiliations

Profiling Plant Proteome and Transcriptome Changes during Grapevine Fanleaf Virus Infection

Brandon G Roy et al. J Proteome Res. .

Abstract

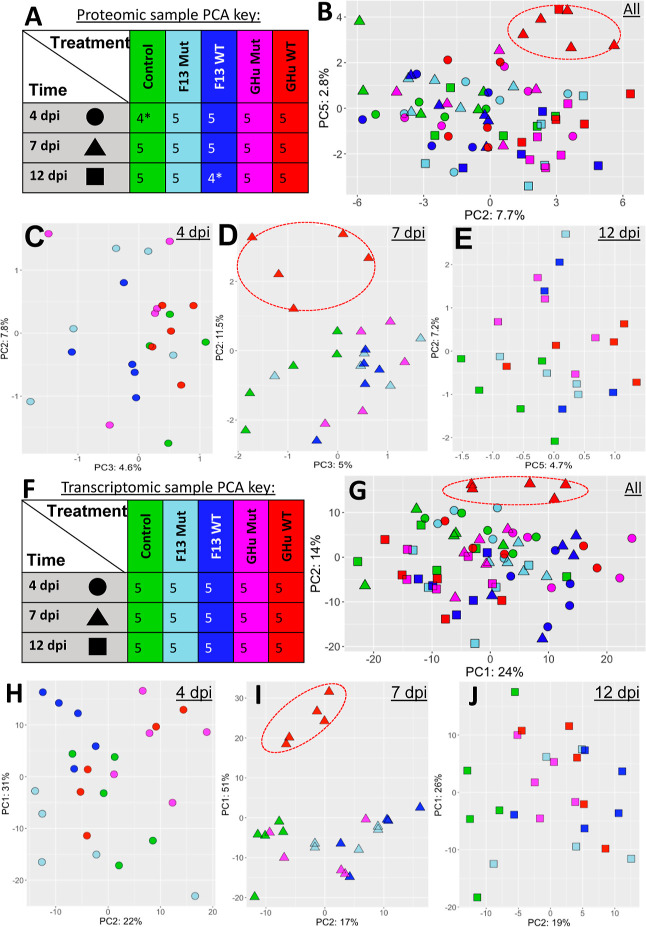
Viruses can elicit varying types and severities of symptoms during plant host infection. We investigated changes in the proteome and transcriptome of Nicotiana benthamiana plants infected by grapevine fanleaf virus (GFLV) with an emphasis on vein clearing symptom development. Comparative, time-course liquid chromatography tandem mass spectrometry and 3' ribonucleic acid sequencing analyses of plants infected by two wildtype GFLV strains, one symptomatic and one asymptomatic, and their asymptomatic mutant strains carrying a single amino acid change in the RNA-dependent RNA polymerase (RdRP) were conducted to identify host biochemical pathways involved in viral symptom development. During peak vein clearing symptom display at 7 days post-inoculation (dpi), protein and gene ontologies related to immune response, gene regulation, and secondary metabolite production were overrepresented when contrasting wildtype GFLV strain GHu and mutant GHu-1EK802GPol. Prior to the onset of symptom development at 4 dpi and when symptoms faded away at 12 dpi, protein and gene ontologies related to chitinase activity, hypersensitive response, and transcriptional regulation were identified. This systems biology approach highlighted how a single amino acid of a plant viral RdRP mediates changes to the host proteome (∼1%) and transcriptome (∼8.5%) related to transient vein clearing symptoms and the network of pathways involved in the virus-host arms race.

Keywords: Nicotiana benthamiana; RNA-dependent RNA polymerase; grapevine; nepovirus; proteomics; symptomology; time-course; transcriptomics; virus.


Conflict of interest statement

The authors declare no competing financial interest.

Figures

Figure 1
Figure 1
GFLV genetic composition and symptom expression in N. benthamiana. (A) Simplified schematic of the structure and expression of RNA1 of wildtype GFLV strains F13 (blue) and GHu (red) and RNA2 of wildtype GFLV strain GHu (purple). The viral genome-linked protein VPg is shown at the 5′ end of the RNA molecules and the polyadenylated tail at the 3′ end. Untranslated 5′ and 3′ regions are shown as horizontal gray bars. Vertical gray lines represent proteolytic cleavage sites as processed by RNA1-encoded proteinase 1DPro. The nucleotide identity of 87.78% between the two GFLV RNA1s is depicted in gray (Jalview v2.11.2.2). Critical amino acid residue 1E802Pol for vein clearing symptoms is indicated by an arrow and colored vertical line on RNA1 molecules. (B) GFLV-infected N. benthamiana plants at 7 days post-inoculation (dpi) with asymptomatic wildtype strain F13 (top) and symptomatic wildtype strain GHu (bottom) causing a stark vein clearing phenotype. Plants infected with mutant GFLV-GHu 1EK802GPol appear identical to asymptomatic plants infected with GFLV-F13 (image editing: individual plants are shown after background removal). (C) Symptom expression of wildtype GFLV-GHu in infected N. benthamiana over time. Apical leaves observed across three cohorts of plants (n1 = 23, n2 = 48, and n3 = 15) for vein clearing symptoms were rated on a binary scale (1 = symptomatic, 0 = asymptomatic). GFLV symptoms emerged in a few inoculated plants as early as 4–6 days post-inoculation (dpi); most plants expressed symptoms at 7–10 dpi, and all plants fully recovered by 17 dpi. The average percent of symptomatic plants in three trials is shown with standard deviations as error bars. Severity of symptoms is diagramed as representative leaf drawings above the plotted line. The three time points used for tissue collection for transcriptomics and proteomics work are indicated with a star.
Figure 2
Figure 2
PCA for unbiased observation of acquired proteomics and transcriptomics data. Proteomics data utilizes top 100 proteins after vsn and bpca imputation. Transcriptomics data utilizes top 500 varying genes after vsn and low-count filtering. (A) Key for biological replicates displaying colors for treatments and shape used for three time points (4, 7, and 12 dpi as circles, triangles, and squares, respectively) of N. benthamiana inoculated with various GFLV strains and controls for (B) proteomics analysis of 73* samples for which grouping of samples is minorly apparent, especially for the wildtype GFLV strain GHu treatment (red triangles) in the upper-right quadrant. (C) Breakdown of samples at 4 dpi, (D) 7 dpi with large separation of wildtype GFLV strain GHu symptomatic plants in red (D), and (E) 12 dpi with cluster effects, suggesting subtle variations of the proteome upon these treatment groups. (F) Key displaying colors for treatments and shape used for the three time points (4, 7, and 12 dpi) following inoculation of N. benthamiana with various GFLV strains for (G) all 75 samples from DESeq2 analysis, normalization, and transformation plotted in PCA where PC2 separates out wildtype GHu 7 dpi, (H) 4 dpi with minor grouping of treatment groups, (I) 7 dpi with a large separation PC1 for symptomatic wildtype GFLV strain GHu, and (J) 12 dpi with minor grouping of treatment groups, although PC2 separates control from viral treatment groups.*Two samples were lost during sample processing resulting in 73 samples rather than the designed 75 sample experiment. This did not impact the ability of contrasts with a larger sample size taken and no more than one sample lost in a treatment group or time point.
Figure 3
Figure 3
Select transcriptomics contrasts at 4, 7, and 12 dpi of N. benthamiana infected with various GFLV strains. Thresholds of |log2FoldChange| > 1 and p-adjusted value > 0.05 were used to identify DEGs. Data points meeting both requirements (green), significant reads but insufficient expression differences (blue), expression differences but not statistical significance (gray), and neither requirement (black) are shown. Contrasts between wildtype GFLV strain GHu and mutant GFLV-GHu 1EK802GPol at (A) 4 dpi with little difference in transcript expression, (B) 7 dpi with many DEGs, and (C) 12 dpi with few DEGs. Contrasts between wildtype GFLV strains GHu and F13 show a similar pattern at (D) 4 dpi with little difference in DEGs, (E) 7 dpi with many DEGs, and (F) 12 dpi with a reduced number of DEGs. Contrasts between wildtype GFLV strain F13 and mutant GFLV-F13 1EK802GPol show a different pattern at (G) 4 dpi with more DEGs than at (H) 7 dpi and (I) 12 dpi. (B) and (E) share 62.5% identity of significant DEGs, showing that most changes in the transcriptome are the result of a single amino acid and not the background of all other genomic differences between wildtype GFLV strains.
Figure 4
Figure 4
Select proteomics contrasts at 4, 7, and 12 dpi of N. benthamiana with various GFLV strains. Thresholds of |log2FoldChange| > 1 (high confidence), |log2FoldChange| > 0.5 (medium confidence), and p-value <0.05 were used to identify DEPs. Data points meeting requirements for high confidence (purple), medium confidence (pink), significant reads but insufficient expression differences (blue), and neither requirement (black) are shown. Contrasts between wildtype GFLV strain GHu and mutant GFLV-GHu 1EK802GPol at (A) 4 dpi with very limited DEPs, (B) 7 dpi with several DEPs identified with medium and high confidence, and (C) 12 dpi with limited DEPs. Contrasts between wildtype GFLV-GHu and F13 show a similar pattern at (D) 4 dpi with limited DEPs, (E) 7 dpi with larger differences in protein expression, and (F) 12 dpi with limited DEPs. Contrasts between wildtype GFLV-F13 and mutant GFLV-F13 1EK802GPol with few DEPs at (G) 4 dpi, (H) 7 dpi, and (I) 12 dpi. The illustration of these time-resolved volcano plots demonstrates that the proteome is mainly disrupted at 7 dpi only for the wildtype GFLV-GHu treatment, corresponding to vein clearing symptom expression.
Figure 5
Figure 5
Gene set enrichment analysis of overrepresented genes present in the transcriptome analyses. GeneIDs were extracted from individual genes in contrast with a |log2FoldChange| > 1 and p-value <0.05. GeneID was inserted into “gprofiler2” package v0.2.1 for matching identity of functional annotation of N. benthamiana genes. Size of the dot represents relative abundance, and the color from blue to red signifies increasing significance (p-value range of 0.05 to <0.01). The upper panel shows phenotypes obtained following inoculation of N. benthamiana by various GFLV strains above each contrast for ease of comparing the visual phenotype to the transcriptome profile.
Figure 6
Figure 6
Overrepresented GOs for proteomic analysis. (A) Gene IDs were extracted from individual genes in multiple treatment-wise contrasts with a |log2FoldChange| > 0.5 and p-value <0.05 (medium confidence). The gene ID was inserted into “gprofiler2” package v0.2.1 for matching identity of functional annotation of N. benthamiana genes and returned GO terms overrepresented in the dysregulated proteome across the entire experiment. Contrasts were included from all time points of the experiment and from the following treatment contrasts: wildtype GFLV strain GHu vs mutant GHu 1EK802GPol, wildtype GFLV strain F13 vs mutant F13 1EK802GPol, wildtype GFLV-GHu vs wildtype GFLV-F13, and wildtype GFLV-F13 vs mutant GHu 1EK802GPol. The relative ratio of genes is shown by the x-axis scale, and the adjusted p-value (padj) is shown by the color of red to blue for most to least significant. Adjusted p-values indicated as significant by * = padj <0.1, ** = padj <0.05, and *** = padj<0.01. (B) GOs extracted from MNAR proteins across the entire 73 protein samples. Only significant ontologies are shown with the adjusted p-value increasing from blue to red (0.025 to <0.005).
Figure 7
Figure 7
Differential gene set enrichment analysis network of wildtype GFLV strain GHu at 7 days post-inoculation of N. benthamiana contrasted against all other treatments (wildtype GFLV-GHu at 7 dpi was contrasted against the profile of all other treatments in GSEA with parameters of |log2FoldChange| > 1 and an adjusted p-value <0.05). Gene clusters upregulated (blue circle) and downregulated (red circle) are shown and are colored by saturation according to their respective calculated p-values. The size of a circle represents the relative number of genes present within a cluster ranging from 15 to 359. Lines represent the potential interactant connection network between GO terms. Black lined circles encompassing several clusters represent a general classification that was manually annotated; this analysis confirmed three main categories related to metabolism, immunity, and gene regulatory processes in the event of vein-clearing symptom development.
Figure 8
Figure 8
Functional categorization of WGCNA eigengene modules unique to infection of N. benthamiana by GFLV wildtype strain GHu at 7 dpi. (A) Selected modules with unique expression patterns. Four of five modules (MEbrown, MEyellow, MEblack, and MEpurple) display downregulation of genes, while the MEblue module shows upregulation of genes. The consensus eigengene-based connectivity (kME) value was set to 0.3 and mergeCutHeight to 0.25 for selecting closely related gene expression profiles. (B) GOs overrepresented in all five modules subjected to GSEA. GOs unique to downregulated pathways are indicated by gray down arrows. Bars are colored by the p-value as indicated by the in-plot legend. (C) GOs overrepresented in MEblue subjected to GSEA.
Figure 9
Figure 9
(A) Contrast of differentially abundant gene candidates identified by LC–MS/MS (purple) and 3′RNA-Seq (green) between wildtype GFLV strain GHu and mutant GFLV-GHu 1EK802GPol. From left to right, Venn diagrams show the number of differentially abundant genes identified by proteomics (|log2FoldChange| > 0.5 and p-value < 0.05), transcriptomics (adjusted p-value <0.05), and both (overlap) at 4, 7, and 12 dpi, respectively. The overlap between the two techniques shows 82% of the DEPs also being identified within the transcriptomics pipeline for this contrast at 7 dpi. No overlap was seen at 4 dpi and 12 dpi, perhaps indicative of differences in data acquired or biological timing differences in the transcriptome and proteome upon viral infection. (B) Comparative bar plots for Log2FoldChange values in proteomics (purple) and transcriptomics (green) data when contrasting wildtype GFLV-GHu and mutant GFLV-GHu 1EK802GPol. The 23 genes were pulled from the overlapping gene IDs seen in the central Venn diagram from A. All expression levels are in the same absolute value between LC–MS/MS- and 3′RNA-Seq-acquired data.
Figure 10
Figure 10
Hypothesized major networks for symptom development in N. benthamiana upon infection by GFLV strain GHu deduced from profiling proteome and transcriptome changes. Highly represented at 4 dpi and during peak symptom expression at 7 dpi were genes related to basal host defense responses including chitinases, ROS modulators, and a senescence-related protein, which were all upregulated. Other basal defense systems suppressed the expression of GLUTAMINE SYNTHASE PATHOGEN RELATED-1. Additionally, ribosomal subunits were upregulated at 7 dpi, related to changes of major translational networks for protein production. An increased abundance of certain ribosomal subunits could modify translational products and reprogram the cellular structure to be more conducive for the expression of the viral genome. Silencing mechanisms of miRNA- and RNAi-mediated defense involved the upregulation of SUPPRESSOR OF GENE SILENCING and DOUBLE-STRANDED RNA BINDING PROTEIN transcripts at 7 dpi. Other genes of the RNA silencing pathways such as DICER-LIKE 4 returned results with conflicting expression levels or very low counts (ARGONAUTE) and, therefore, may contribute in minor but non-critical capacities to the vein clearing phenotype. ROS = reactive oxygen species, GS-PR1 = glutamine synthase pathogenesis related-1, eIF = eukaryotic translation initiation factor, SGS = suppressor of gene silencing, DRB = double-stranded RNA binding protein, DCL = dicer-like protein, and AGO = argonaute protein.

Similar articles

Cited by

References

    1. Xu K.; D Nagy P. Dissecting Virus-Plant Interactions through Proteomics Approaches. Curr. Proteomics 2010, 7, 316.10.2174/157016410793611792. - DOI - PMC - PubMed
    1. Di Carli M.; Benvenuto E.; Donini M. Recent Insights into Plant–Virus Interactions through Proteomic Analysis. J. Proteome Res. 2012, 11, 4765–4780. 10.1021/pr300494e. - DOI - PubMed
    1. Osterbaan L. J.; Fuchs M. Dynamic Interactions between Plant Viruses and Their Hosts for Symptom Development. J. Plant Pathol. 2019, 101, 885–895. 10.1007/s42161-019-00323-5. - DOI
    1. Zanardo L. G.; de Souza G. B.; Alves M. S. Transcriptomics of Plant–Virus Interactions: A Review. Theor. Exp. Plant Physiol. 2019, 31, 103–125. 10.1007/s40626-019-00143-z. - DOI
    1. Calil I. P.; Fontes E. P. B. Plant Immunity against Viruses: Antiviral Immune Receptors in Focus. Ann. Bot. 2017, 119, 711–723. 10.1093/aob/mcw200. - DOI - PMC - PubMed

Publication types

Supplementary concepts