. 2023 Aug 3;192(4):3088-3105.
doi: 10.1093/plphys/kiad255.

Viral synergism suppresses R gene-mediated resistance by impairing downstream defense mechanisms in soybean

Affiliations

Viral synergism suppresses R gene-mediated resistance by impairing downstream defense mechanisms in soybean

Mazen Alazem et al. Plant Physiol. .

Abstract

Viral synergism occurs when mixed infection of a susceptible plant by 2 or more viruses leads to increased susceptibility to at least 1 of the viruses. However, the ability of 1 virus to suppress R gene-controlled resistance against another virus has never been reported. In soybean (Glycine max), extreme resistance (ER) against soybean mosaic virus (SMV), governed by the Rsv3 R-protein, manifests a swift asymptomatic resistance against the avirulent strain SMV-G5H. Still, the mechanism by which Rsv3 confers ER is not fully understood. Here, we show that viral synergism broke this resistance by impairing downstream defense mechanisms triggered by Rsv3 activation. We found that activation of the antiviral RNA-silencing pathway and the proimmune mitogen-activated protein kinase 3 (MAPK3), along with the suppression of the proviral MAPK6, are hallmarks of Rsv3-mediated ER against SMV-G5H. Surprisingly, infection with bean pod mottle virus (BPMV) disrupted this ER, allowing SMV-G5H to accumulate in Rsv3-containing plants. BPMV subverted downstream defenses by impairing the RNA-silencing pathway and activating MAPK6. Further, BPMV reduced the accumulation of virus-related siRNAs and increased the virus-activated siRNA that targeted several defense-related nucleotide-binding leucine-rich repeat receptor (NLR) genes through the action of the suppression of RNA-silencing activities encoded in its large and small coat protein subunits. These results illustrate that viral synergism can result from abolishing highly specific R gene resistance by impairing active mechanisms downstream of the R gene.


Conflict of interest statement

Conflict of interest statement. None declared.

Figures
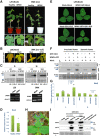
Figure 1.
Figure 1.
BPMV suppresses Rsv3-mediated ER against SMV-G5H. A) Effect of BPMV on the susceptibility of soybean cultivars ‘L29’ (Rsv3) and ‘SMK’ (rsv) to SMV-G7H infection. Plants were infected with BPMV at the unifoliate leaves, and then at 14 dpi, inoculation with G7H-eGFP was carried out on the 2nd trifoliate leaf. B) Accumulation levels of SMV-G7H::eGFP in ‘L29’ plants (left) and ‘SMK’ plants (right) at 10 dpi. C) Protein blots of SMV-G7H::eGFP in the inoculated leaves (IL) and the systemically infected leaves (SL), at 5 and 10 dpi, respectively, in mock plants (M) or plants preinfected with BPMV in ‘L29’ plants and ‘SMK’ plants. Ponceau-S was used as a loading control. Lower panels are RT–PCR to detect BPMV movement protein in the systemically infected leaves of ‘L29’ and ‘SMK’ plants (24 dpi: 14 d after BPMV infection plus 10 d after G7H infection). D) qPCR relative expression level of Rsv3 gene in ‘L29’ plants infected with BPMV. Samples were collected from 3 biological replicates, each comprised of 3 plants. Actin11 was used as an internal control. Values are means + Sd of 3 biological replicates. One-sided Student’s t tests were used to determine significant differences at P < 0.05 (*). E) Symptoms of BPMV::GFP on the systemically infected leaves of ‘L29’ plants with or without G5H::GUS. Unifoliate leaves of 10-d-old plants were infected with BPMV::GFP. After 12 d, the 2nd trifoliate leaf on each plant was infected with G5H::GUS. The systemically infected leaves were photographed 10 d after G5H::GUS infection. F) Protein blot for BPMV::GFP and G5H::GUS from ‘L29’ inoculated leaves at 5 dpi and systemically infected leaves at 10 dpi. (−) or (+) indicates the absence or presence of the mock or virus inoculation, respectively. The numbers below the protein blots are the quantification of GFP bands relative to RubScL level, and quantification was carried out by ImageJ. G) Relative expression level of Rsv3 gene in ‘L29’ plants infected with BPMV and/or SMV-G5H from F) in the IL or SL. For qPCRs, Actin11 was used as an internal control. Values are means + Sd of 3 biological replicates. One-sided Student’s t tests were used to determine significant differences at P < 0.05 (*) and P < 0.01 (**). Black and red asterisks indicate significant increase and decrease, respectively. H) Experimental design of G5H point inoculation and cell-to-cell movement in ‘L29’ plants fully infected with BPMV. G5H was point inoculated on the 2nd trifoliate leaf (black circles of 1 cm in diameter); margin areas (light orange areas of 1 cm width) separate the inoculated points and the distant regions (blue half circles). Tissues were collected at 5 dpi from black and blue areas to measure G5H accumulation in local and distant tissues. I) Protein blots of SMV-G7H::eGFP in point inoculated and the distant regions at 5 dpi. Recombinant GUS and GFP proteins were loaded as positive controls. L denotes the protein ladder, and data represent 1 of 3 biological replicates.
Figure 2.
Figure 2.
Viral suppressor of RNA-silencing activity of BPMV coat protein subunits CPL and CPS in N. benthamiana plants. A) GFP fluorescence levels in N. benthamiana transiently expressing CPL, CPS, P19, or mCherry (mCh) with eGFP at 1, 2, and 3 dpi. B) Protein blot of N. benthamiana from A) with GFP antibody; free GFP recombinant protein was loaded as a positive control. C) Protein blot from A) for mCherry (27 kDa), CPL (72 kDa), CPS (51.5 kDa), and P19 (49.5 kDa) at 1, 2, and 3 dpi. Blot represents 1 of 3 biological replicates, L denotes the protein ladder, and Ponceau-S was used as the loading control. The charts below B) and C) are the quantifications of the bands, which were carried out by ImageJ using RubScL as an internal control. D) Northern blot of eGFP siRNA from N. benthamiana leaves at 2 dpi; upper panel is eGFP siRNA of 21 bp size and U6 was used as a loading control. The lower panel is the total small RNA, and M is the miRNA marker showing 17-, 21-, and 24-mer bands. E) Stem–loop RT–PCR for a siRNA eGFP coimmunoprecipitated from a mix of eGFP with CPL, CPS, or P19 proteins from A), and the input panel represents GFP and HA protein blots for samples collected at 2 dpi from the leaves shown in A). The CoIP panel is the protein blot (upper) for the coimmunoprecipitated mCherry, CPL, CPS, or P19 proteins by anti-HA antibody and the stem–loop RT–PCR (lower) for a siGFP from RNA samples isolated from the coimmunoprecipitated proteins. L denotes the protein ladder. Each protein or RNA blot represents 3 biological replicates.
Figure 3.
Figure 3.
CPL and CPS subunits of BPMV are responsible for impairing Rsv3-mediated ER against SMV-G5H. A) Protein blots for SMV-G5H::eGFP constructs expressing CPL, CPS, or P19 from ‘L29’ plants in the inoculated leaves (IL) at 5 and 10 dpi (left and right panels, respectively) and the systemically infected leaves (SL) at 10 dpi (lower panel). GFP recombinant protein was loaded as a positive control. The blot is representative of 3 biological replicates. B) Visual symptoms and GFP fluorescence in the ‘L29’ leaves systemically infected with SMV-G7H::eGFP expressing CPL, CPS, or P19. The 2nd unifoliate leaves were photographed at 12 dpi. Scale bar = 2 cm. C) Protein blot of eGFP from protein samples extracted from ‘L29’ leaves systemically infected with SMV-G7H::eGFP expressing CPL, CPS, or P19 at 12 dpi. D) Symptoms developed on ‘L29’ upper leaves [from A)] infected with SMV-G5H::GUS 10 dpi. Scale bar = 2 cm. E) Protein blot of eGFP (for SMV-G7H::eGFP::VSRs) and GUS (for SMV-G5H::GUS) from the SMV-G5H::GUS–inoculated and SMV-G5H::GUS–systemically infected leaves, at 10 dpi. L denotes the protein ladder, Ponceau-S is the loading control, and blots are representative of 3 biological replicates. The numbers below the panels are the quantification of the bands relative to the RubScL level revealed by Ponceau-S, and quantification was carried out by ImageJ. F) Relative expression level of Rsv3 gene before and after SMV-G5H::GUS infection in ‘L29’ plants infected with SMV-G7H::eGFP::VSRs. G) Relative expression of SMV-G7H–encoded genes eGFP and CI in ‘L29’ plants infected with the SMV-G7H::eGFP::VSR alone (top chart) or after SMV-G5H::GUS infection (bottom chart). Actin was used as an internal control. Values are means + Sd of 3 biological replicates. Statistical analysis was carried out as described in the legend of Fig. 1; * and ** indicate a significant difference at P < 0.05 and 0.01, respectively.
Figure 4.
Figure 4.
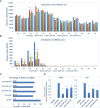
Characteristics of sRNAs and vsiRNA in SMV-infected soybean. A) Abundance and size distribution of total sRNAs from 18 to 30 nt in the 5 constructed libraries. Values are means + Sd of 2 biological replicates. One-sided Student’s t tests were used to determine significant differences at P < 0.05 (*). B) Abundance and size distribution of vsiRNA between 18 and 30 nt in the 5 constructed libraries. Statistical analysis was carried out as described in the legend of Fig. 1. Black and red asterisks indicate significant increase and decrease, respectively, at P < 0.05. C) Percentage of total sRNA in plants infected SMV-G7H::eGFP, SMV-G7H::eGFP::CPL, SMV-G7H::eGFP::CPS, or SMV-G7H::eGFP19 infected plants compared with healthy plants, and percentage of vsiRNA in their correspondent sRNA lines. D) Stem–loop qPCR for 2 vsiRNAs from the eGFP (siGFP) and the CI (siCI) regions to confirm vsiRNA-Seq analysis. SnoRI was used as an internal control. Statistical analysis was carried out as described in the legend of Fig. 1; * and ** indicate a significant difference at P < 0.05 and 0.01, respectively.
Figure 5.
Figure 5.
Distribution and RPM of vsiRNA along the SMV-G7H::eGFP genome and its chimeras. A) SMV-G7H::eGFP, B) SMV-G7H::eGFP::CPL, C) SMV-G7H::eGFP::CPS, D) SMV-G7H::eGFP::P19, and E) the specific regions of CPL, CPS, and P19 from B to D), respectively. Upward blue and downward red denote the sense (+) and antisense (−) polarity reads, respectively. The genomic sites of SMV-encoded proteins are indicated below each panel.
Figure 6.
Figure 6.
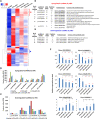
Commonly regulated vasiRNAs by CPL, CPS, and P19 and their potential targets in ‘L29’ plants. A) A heatmap of vasiRNAs (in RPM) extracted from sRNA libraries from healthy plants or those infected with G7H-eGFP or its variants. vasiRNAs with RPM less than 5 were removed. The red and blue asterisks indicate up- and downregulated vasiRNAs in CPL, CPS, and P19 chimeras. Single linkage was used as the clustering method, and the Pearson method was chosen for distance measurement. B) RPMs of the commonly increased vasiRNAs by VSRs. C) RPMs of the decreased vasiRNAs by VSRs. D) Target prediction of the increased vasiRNAs. E) Target prediction of the decreased vasiRNAs. F) qPCR of 6 selected target genes: Glyma.13G228000.1, Glyma.14G186600.1, Glyma.19G201400.1, Glyma.19G261700.1, Glyma.14G62300.1, and Glyma.1G202600.1. Actin was used as an internal control. Data are the average of 3 biological replicates. Values are means + Sd of 3 biological replicates. Statistical analysis was carried out as described in the legend of Fig. 1. * and ** indicate a significant difference at P < 0.05 and 0.01, respectively. Red and black asterisks indicate significant increase and decrease, respectively. The complete list of target genes is in Supplemental Table S5.
Figure 7.
Figure 7.
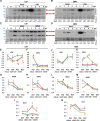
Early immune responses in ‘L29’ and ‘SMK’ plants infected with SMV-G5H or BPMV. A to D) Immunoblotting to determine the kinase activity of MAPK6 and MAPK3 in ‘L29’ plants infected with G5H strain of SMV SMV-G5H A) or with BPMV C), and in ‘SMK’ plants infected with SMV-G5H B) or BPMV D), at 1, 2, 4, and 6 dpi. The phospho-p44/42 MAP Erk1/2 antibody, which recognizes phosphorylated MPK3, MPK4, and MPK6 across kingdoms, was used to detect the kinase activities in soybean. Ponceau-S was used as an internal control. Blots represent 1 of 3 biological replicates. The numbers below the panels are the quantification of the bands relative to the RubScL level revealed by Ponceau-S and quantification was carried out by ImageJ. E to M) Relative expression levels of key genes in the SA pathway in ‘L29’ or ‘SMK’ leaves inoculated with SMV-G5H::eGFP or BPMV::GFP, respectively, for ICS1E, J), EDS1F, K), PAD4G, L), NPR1H, M), and Rsv3 and rsv genes I, N), and qPCR primers were designed based on the conserved regions between Rsv3 and rsv CDS. Samples from healthy uninfected plants were collected at 0 hpi, and expression levels for all genes were measured at 1, 2, 4, and 6 hpi and normalized to that in healthy plants. Values are means ± Sd of 3 biological replicates. Statistical analysis was carried out as described in the legend of Fig. 1; * or Ħ indicate a significant difference at P < 0.01 or 0.05, respectively. * or Ħ indicate significant difference for G5H or BPMV, respectively. Black or blue symbols indicate significant increases, and red symbols indicate significant decreases.

Similar articles

Cited by

References

    1. Akhter MS, Nakahara KS, Masuta C. Resistance induction based on the understanding of molecular interactions between plant viruses and host plants. Virol J. 2021:18(1):176. 10.1186/s12985-021-01647-4 - DOI - PMC - PubMed
    1. Alazem M, He MH, Moffett P, Lin NS. Abscisic acid induces resistance against bamboo mosaic virus through Argonaute2 and 3. Plant Physiol. 2017:174(1):339–355. 10.1104/pp.16.00015 - DOI - PMC - PubMed
    1. Alazem M, Tseng KC, Chang WC, Seo JK, Kim K-H. Elements involved in the Rsv3-mediated extreme resistance against an avirulent strain of soybean mosaic virus. Viruses 2018:10(11):581. 10.3390/v10110581 - DOI - PMC - PubMed
    1. Babicki S, Arndt D, Marcu A, Liang Y, Grant JR, Maciejewski A, Wishart DS. Heatmapper: web-enabled heat mapping for all. Nucleic Acids Res. 2016:44(W1):W147–W153. 10.1093/nar/gkw419 - DOI - PMC - PubMed
    1. Bonnet E, He Y, Billiau K, Van de Peer Y. TAPIR, a web server for the prediction of plant microRNA targets, including target mimics. Bioinformatics 2010:26(12):1566–1568. 10.1093/bioinformatics/btq233 - DOI - PubMed

Publication types

Substances

Supplementary concepts