. 2023 Jul 31;174(2):165-181.
doi: 10.1093/jb/mvad032.

Full-length prion protein incorporated into prion aggregates is a marker for prion strain-specific destabilization of aggregate structure following cellular uptake

Affiliations

Full-length prion protein incorporated into prion aggregates is a marker for prion strain-specific destabilization of aggregate structure following cellular uptake

Daniel Shoup et al. J Biochem. .

Abstract

Accumulation of insoluble aggregates of infectious, partially protease-resistant prion protein (PrPD) generated via the misfolding of protease sensitive prion protein (PrPC) into the same infectious conformer, is a hallmark of prion diseases. Aggregated PrPD is taken up and degraded by cells, a process likely involving changes in aggregate structure that can be monitored by accessibility of the N-terminus of full-length PrPD to cellular proteases. We therefore tracked the protease sensitivity of full-length PrPD before and after cellular uptake for two murine prion strains, 22L and 87V. For both strains, PrPD aggregates were less stable following cellular uptake with increased accessibility of the N-terminus to cellular proteases across most aggregate sizes. However, a limited size range of aggregates was able to better protect the N-termini of full-length PrPD, with the N-terminus of 22L-derived PrPD more protected than that of 87V. Interestingly, changes in aggregate structure were associated with minimal changes to the protease-resistant core of PrPD. Our data show that cells destabilize the aggregate quaternary structure protecting PrPD from proteases in a strain-dependent manner, with structural changes exposing protease sensitive PrPD having little effect on the protease-resistant core, and thus conformation, of aggregated PrPD.

Keywords: PrPD; PrPSc; aggregate structure; degradation; prion; protein.


Figures

Graphical Abstract
Graphical Abstract
Fig. 1
Fig. 1
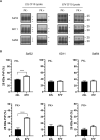
A small subpopulation of full-length PrP D is protected from truncation by PK. The molecular mass of PrPD in brain homogenates from mice infected with 22L and 87V prions was determined via immunoblot. (A) Immunoblots containing three replicates of PK treated and untreated PrPD from brain homogenates of 22L (left panels) and 87V (right panels) prion infected mice. All samples were de-glycosylated with PNGase F. Blots were developed using the anti-PrP antibodies Saf32 (upper panels), 6D11 (middle panels) and Saf84 (lower panels). Molecular mass markers representing 25 kDa (upper line) and 20 kDa (lower line) are shown to the right of each panel. Representative exposures from gel lanes within the same experiment are shown. (B) The percentage of 25 kDa PrP for PrPD in 22L brain homogenate (filled bars) or for PrPD in 87V brain homogenate (open bars) was determined for samples that were left untreated (upper plots) or digested with PK (lower plots), using immunoblots developed with either Saf32 (left plots), 6D11 (middle plots) or Saf84 (right plots). Percentages were calculated by quantifying the amount of full-length 25 kDa PrPD and dividing by the amount of total PrPD ((25 kDa PrPD/(25 kDa PrPD + 20 kDa PrPD)) x 100). Data were calculated from n = 3 for each time point and are given as mean ± standard deviation. An unpaired one-tail t-test was used to calculate the statistical significance between 22L and 87V samples. Asterisks represent a range of P-values with p* = 0.02, p** = 0.008 and p**** = < 0.0009. A map of PrP from residues 23–230 with the location of the epitopes for all 3 antibodies is shown at the top of the graph. The octapeptide repeat region (OPR) and glycosylation sites are indicated.
Fig. 2
Fig. 2
Full-length 22L or 87V PrP D is partially protected from cellular proteases 24 h after uptake. Media containing brain homogenate from either 22L or 87V prion infected mice was incubated with CF10 cells for 4 and 24 h and the percentage of full-length PrPD in cells and growth media was quantified. (A) Immunoblots of 22L (upper panels) and 87V (lower panels) PrPD from PK treated (PK+) and untreated (PK-) CF10 cell lysates. All samples were treated with PNGaseF and blots were developed with the 6D11 antibody. Molecular mass markers representing 25 kDa (upper line) and 20 kDa (lower line) are shown to the right of each panel while an asterisk indicates 23 kDa PrPD. (B) The average percentage of full-length PrPD in the total PrPD population from cell lysates of CF10 cells exposed to 22L or 87V prions for either 4 or 24 h. Samples were either PK treated (unfilled bars) or left untreated (filled bars). (C) Immunoblots of the starting brain homogenate (BH, representing time 0) or cell media incubated with 22L or 87V brain homogenate for 4 or 24 h. All samples were treated with PNGase F and the blots developed with the 6D11 antibody. (D) The average percentage of full-length PrPD in the total PrPD population of starting brain homogenate (time 0) or cell media incubated with 22L or 87V brain homogenate for 4 or 24 h. Gray bars represent 22L samples and white bars represent 87V samples. Percentages were calculated by quantifying the amount of full-length 25 kDa PrPD and dividing by the amount of total PrPD ((25 kDa PrPD/(25 kDa PrPD + 23 kDa PrPD + 20 kDa PrPD)) x 100). Averages were calculated from n = 3 for each time point and are given as mean ± standard deviation. An unpaired one-tail t-test was used to calculate statistical significance between the 4 and 24 h time points. Asterisks represent a range of P-values with p*** = 0.001–0.004 and p**** = 0.0003. Representative exposures from gel lanes within the same experiment are shown. For some panels, longer exposures are shown in order to clearly show the PrPD banding pattern.
Fig. 3
Fig. 3
Full-length PrP D is partially accessible to cellular proteases in both 22L and 87V PrP D aggregates. (A) PrPD in lysates of CF10 cells exposed to 22L (left panels) and 87V (right panels) prion infected brain homogenates for 24 h. All samples were treated with PNGase F. Half of each cell lysate was PK treated and triplicate samples of digested and undigested lysates were run on the same gels. Blots were developed with the anti-PrP antibodies Saf32 (upper panels), 6D11 (middle panels), and Saf84 (lower panels). Molecular mass markers representing 25 kDa (upper line) and 20 kDa (lower line) are shown to the right of each panel while an asterisk indicates the presence of 23 kDa PrPD. Representative exposures from gel lanes within the same experiment are shown. (B) The percentage of 25 kDa PrPD in lysates of CF10 cells exposed to 22L brain homogenate (filled bars) or 87V brain homogenate (open bars) for 24 h. Samples were either not exposed to PK (upper plots) or PK treated (lower blots) and then analysed with the anti-PrP antibodies Saf32 (left plots), 6D11 (middle plots), and Saf84 (right plots). The percentage of full-length 25 kDa PrPD was calculated as in the legend to Figure 2. Data were calculated from n = 3 for each time point and are given as mean ± standard deviation. An unpaired one-tail t-test was used to calculate the statistical significance between 22L and 87V PrPD samples. Asterisks represent a range of P-values with p**** = < 0.0009.
Fig. 4
Fig. 4
Changes in cellular lysosomal activity following PrP D uptake are limited. A protease sensitive, self-quenched fluorescent peptide was used to characterize the overall lysosomal activity of CF10 cells acutely exposed to 22L or 87V brain homogenates or CF10-Mo3F4 cells chronically infected with 22L prions. (A) Bar graphs of the average fluorescence intensities of CF10 cells exposed to 22L and 87V prions (left panel) or chronically infected with 22L prions (right panel). In the left panel, cells were acutely exposed to normal brain homogenate (Normal BH, bars with horizontal lines), 22L infected brain homogenate (22L BH, bars with spots), or 87V infected brain homogenate (87V BH, bars with diagonal lines). Samples in both panels were also treated with bafilomycin (white bars) or left untreated (black bars). Averages were calculated from the mean fluorescence area of cells from n = 3 separate experiments and are shown as mean ± standard deviation. The average fluorescence values for CF10 cells taking up brain homogenate (left panel) were normalized to untreated cells while the values from CF10-Mo3F4 cells that were or were not chronically infected with 22L (right panel) were not normalized. (B) A one-way ANOVA Tukey's multiple comparisons test was used to calculate the statistical significance of the average fluorescence values of cells exposed to brain homogenate shown in (A), left panel. In the right panel, the statistical significance of untreated and bafilomycin treated CF10-Mo3F4 cells that were or were not chronically infected with 22L was calculated with a paired one-tail t-test. Asterisks represent a range of P-values with p**** = < 0.0009.
Fig. 5
Fig. 5
Full-length PrP D is uniformly present in aggregates across a wide size range but is partially inaccessible to proteases in intermediate sized aggregates. Brain homogenates from 22L (gray lines and circles) and 87V (black lines and squares) prion infected mice were fractionated via a 10% to 60% sucrose gradient. Half of each sucrose fraction was either PK treated (open shapes and dashed lines) or left undigested (filled shapes and solid lines). All samples were PNGase F treated and analysed via immunoblot using the 6D11 antibody. The average percentage of full-length PrPD in each sucrose fraction is shown. The percentage of full-length 25 kDa PrPD was calculated as in the legend to Figure 1, with the percentage of full-length PrPD in each fraction normalized to the amount of PrPD within each fraction. Thus, the percentage of 25 kDa PrPD is not weighted by concentration and will not equal the percentage of total 25 kDa PrPD calculated in the unfractionated samples in Figure 1. Averages were calculated from n = 3 for each fraction and are given as mean ± standard deviation.
Fig. 6
Fig. 6
Strain specific protection of full-length PrP D in large aggregates following cellular uptake. CF10 cells were exposed to media containing brain homogenate from 22L and 87V prion infected mice for 24 h and then lysed. Cellular lysates were fractionated via a 10% to 60% sucrose gradient and half of each fraction was PK treated before all fraction samples were PNGase F treated and analysed by immunoblot using the 6D11 antibody. Plotted is the average percentage of 25 kDa (gray lines and circles) and 23 kDa (gray lines and triangles) PrPD in 22L PrPD and 25 kDa PrPD in 87V (black lines and squares), in cell lysates that have been either digested (open shapes and dashed lines) or left undigested (filled shapes and solid lines) with PK. Percentages of 25 kDa and 23 kDa PrPD in each population were calculated by dividing the amount of these bands by the total amount of PrPD as in the legend to Figure 2. Averages were calculated from n = 3 for each fraction and are given as mean ± standard deviation.
Fig. 7
Fig. 7
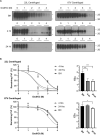
Strain specific changes in PrP D aggregate structural stability following cellular uptake. (A) Immunoblot analysis of 22L PrPD (left panels) or 87V PrPD (right panels) exposed to 0, 1, 2, 3, or 4 M GndHcl followed by centrifugation. A total of three separate samples are shown and all blots were analysed using the 6D11 antibody. Upper panel: PrPD in brain homogenate (BH); Middle panels: immunoblots of PrPD in cell lysate from CF10 cells exposed to prion infected brain homogenate for 4 h; Bottom panels: immunoblots of PrPD in cell lysate from CF10 cells exposed to prion infected brain homogenate for 24 h. Molecular mass markers representing 25 k Da (upper line) and 20 k Da (lower line) are shown to the right of each panel. Representative exposures from gel lanes within the same experiment are shown. (B) The total amount of insoluble PrPD remaining in the pellet was calculated from n = 3 for each GndHCl concentration and is given as mean ± standard deviation. Curve fitting and EC50 values were calculated via a non-linear sigmoidal fitting model using GraphPad Prism. EC50 values calculated from each fit are shown in bar plots on the right side. Brain homogenate: black triangles, bars and lines; Cell lysate at 4 h: gray circles, bars and lines; Cell lysate at 24 h: gray squares, white bars and gray dashed lines. Significance values were calculated from the non-linear sigmoidal fit for each data set and asterisks represent a range of P-values with p* = 0.03 and p*** = 0.001–0.004.
Fig. 8
Fig. 8
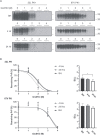
The stability of PK-resistant 22L and 87V PrP D is minimally altered following cellular uptake. (A) Immunoblot analysis of 22L PrPD (left panels) or 87V PrPD (right panels) exposed to 0, 1, 2, 3, or 4 M GndHcl followed by PK treatment. A total of three separate samples are shown and all blots were analysed using the 6D11 antibody. Upper panel: PrPD in brain homogenate (BH); Middle panels: immunoblots of PrPD in cell lysate from CF10 cells exposed to prion infected brain homogenate for 4 h; Bottom panels: immunoblots of PrPD in cell lysate from CF10 cells exposed to prion infected brain homogenate for 24 h. Molecular mass markers representing 25 k Da (upper line) and 20 k Da (lower line) are shown to the right of each panel. Representative exposures from gel lanes within the same experiment are shown. (B) The total amount of PrPD remaining after protease digestion was calculated from n = 3 for each GndHCl concentration and is given as mean ± standard deviation. Curve fitting and EC50 values were calculated via a non-linear sigmoidal fitting model using GraphPad Prism. EC50 values calculated from each fit are shown in bar plots on the right side. Brain homogenate: black triangles, bars and lines; Cell lysate at 4 h: gray circles, bars and lines; Cell lysate at 24 h: gray squares, white bars and gray dashed lines. Averages were calculated from n = 3 and are given as mean ± standard deviation. Fits in each graph were calculated with a non-linear sigmoidal fitting model in GraphPad Prism, which was used to calculate the EC50 values, shown as bar plots (right side), and determine their significance values. Asterisks represent a P-value with p* = 0.03.
Fig. 9
Fig. 9
Aggregate structure protecting full-length PrP D is destabilized following cellular uptake. The GndHCl stability of full-length 25 kDa PrPD in populations of 22L (left panels) and 87V PrPD (right panels) before exposure to cells (BH, brain homogenate) and 24 h after cellular uptake (Lysate) was tested by exposure to 0, 1, 2, 3, and 4 M GndHCl followed by either treatment with PK (PK+, upper panels) or centrifugation with no PK treatment (lower panels). All samples were PNGase F treated and analysed by immunoblot using the 6D11 antibody. The percentage of 25 kDa PrPD in each population was calculated as in the legend to Figure 1. Shown is the average percentage of 25 kDa PrPD in each sample. Averages were calculated from n = 3 for each GndHCl concentration and are given as mean ± standard deviation while fits and EC50 values were calculated via a non-linear sigmoidal fitting model in GraphPad Prism. Brain homogenate: black circles and lines; CF10 cell lysate 24 h post-exposure: gray squares and dashed lines.

Similar articles

Cited by

References

    1. Büeler, H., Fischer, M., Lang, Y., Bluethmann, H., Lipp, H.-P., DeArmond, S.J., Prusiner, S.B., Aguet, M., and Weissmann, C. (1992) Normal development and behaviour of mice lacking the neuronal cell-surface PrP protein. Nature 356, 577–582 - PubMed
    1. Choi, C.J., Anantharam, V., Saetveit, N.J., Houk, R.S., Kanthasamy, A., and Kanthasamy, A.G. (2007) Normal cellular prion protein protects against manganese-induced oxidative stress and apoptotic cell death. Toxicol. Sci. 98, 495–509 - PMC - PubMed
    1. Gabus, C., Derrington, E., Leblanc, P., Chnaiderman, J., Dormont, D., Swietnicki, W., Morillas, M., Surewicz, W.K., Marc, D., Nandi, P., and Darlix, J.L. (2001) The prion protein has RNA binding and chaperoning properties characteristic of nucleocapsid protein NCP7 of HIV-1. J. Biol. Chem. 276, 19301–19309 - PubMed
    1. Bremer, J., Baumann, F., Tiberi, C., Wessig, C., Fischer, H., Schwarz, P., Steele, A.D., Toyka, K.V., Nave, K.-A., Weis, J., and Aguzzi, A. (2010) Axonal prion protein is required for peripheral myelin maintenance. Nat. Neurosci. 13, 310–318 - PubMed
    1. Hoyt, F., Alam, P., Artikis, E., Schwartz, C.L., Hughson, A.G., Race, B., Baune, C., Raymond, G.J., Baron, G.S., Kraus, A., and Caughey, B. (2022) Cryo-EM of prion strains from the same genotype of host identifies conformational determinants. PLoS Pathog. 18, e1010947 - PMC - PubMed