

Fidelity of hyperbolic space for Bayesian phylogenetic inference
- PMID: 37099595
- PMCID: PMC10166537
- DOI: 10.1371/journal.pcbi.1011084
Fidelity of hyperbolic space for Bayesian phylogenetic inference
Abstract
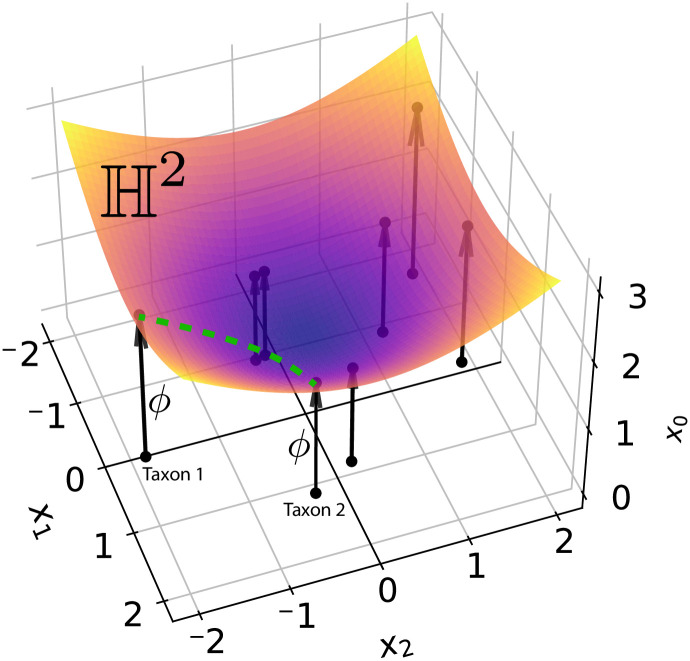
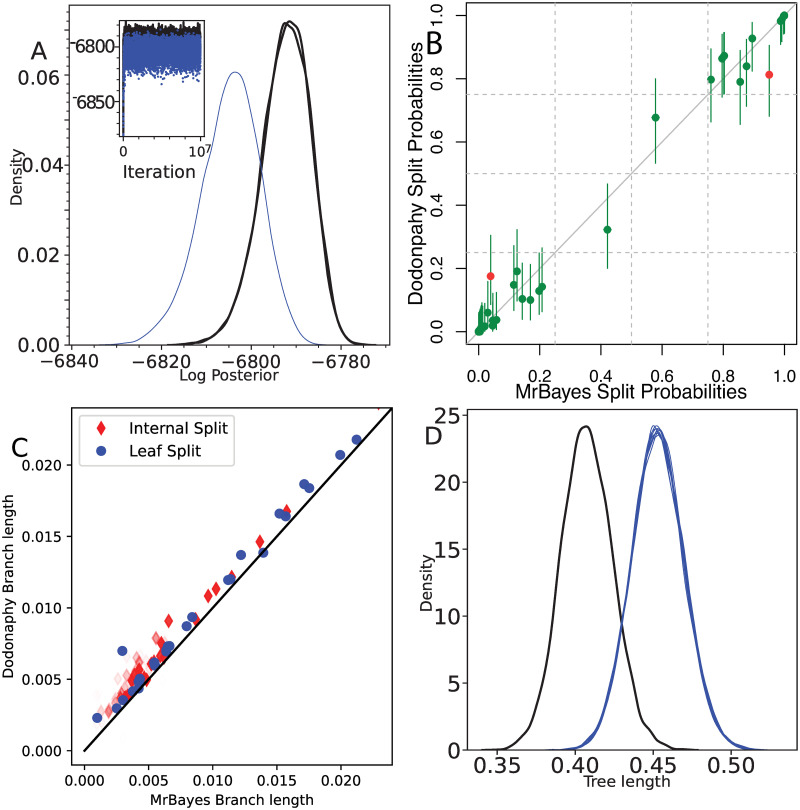
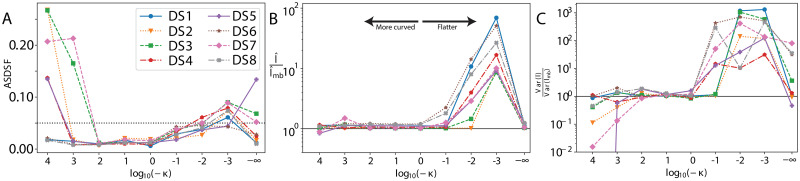
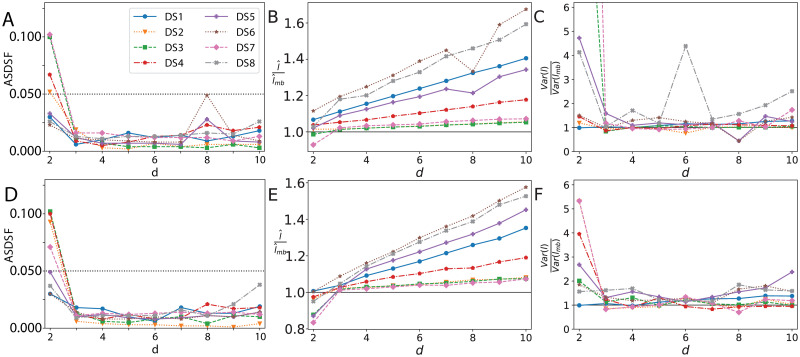
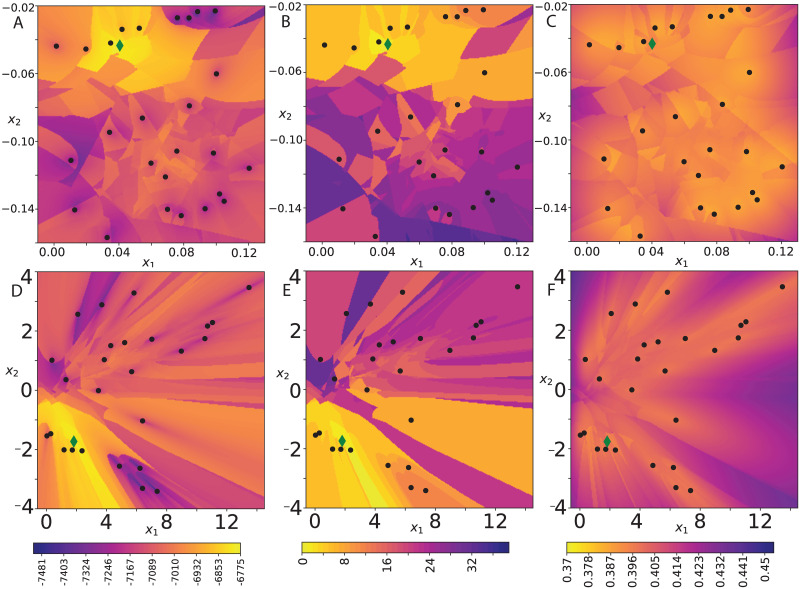
Bayesian inference for phylogenetics is a gold standard for computing distributions of phylogenies. However, Bayesian phylogenetics faces the challenging computational problem of moving throughout the high-dimensional space of trees. Fortunately, hyperbolic space offers a low dimensional representation of tree-like data. In this paper, we embed genomic sequences as points in hyperbolic space and perform hyperbolic Markov Chain Monte Carlo for Bayesian inference in this space. The posterior probability of an embedding is computed by decoding a neighbour-joining tree from the embedding locations of the sequences. We empirically demonstrate the fidelity of this method on eight data sets. We systematically investigated the effect of embedding dimension and hyperbolic curvature on the performance in these data sets. The sampled posterior distribution recovers the splits and branch lengths to a high degree over a range of curvatures and dimensions. We systematically investigated the effects of the embedding space's curvature and dimension on the Markov Chain's performance, demonstrating the suitability of hyperbolic space for phylogenetic inference.
Copyright: © 2023 Macaulay et al. This is an open access article distributed under the terms of the Creative Commons Attribution License, which permits unrestricted use, distribution, and reproduction in any medium, provided the original author and source are credited.
Conflict of interest statement
The authors have declared that no competing interests exist.
Figures
Similar articles
-
ScITree: Scalable Bayesian inference of transmission tree from epidemiological and genomic data.PLoS Comput Biol. 2025 Jun 10;21(6):e1012657. doi: 10.1371/journal.pcbi.1012657. eCollection 2025 Jun. PLoS Comput Biol. 2025. PMID: 40493703 Free PMC article.
-
Random-Effects Substitution Models for Phylogenetics via Scalable Gradient Approximations.Syst Biol. 2024 Sep 5;73(3):562-578. doi: 10.1093/sysbio/syae019. Syst Biol. 2024. PMID: 38712512 Free PMC article.
-
A regression based approach to phylogenetic reconstruction from multi-sample bulk DNA sequencing of tumors.PLoS Comput Biol. 2024 Dec 4;20(12):e1012631. doi: 10.1371/journal.pcbi.1012631. eCollection 2024 Dec. PLoS Comput Biol. 2024. PMID: 39630782 Free PMC article.
-
A practical guide to pseudo-marginal methods for computational inference in systems biology.J Theor Biol. 2020 Jul 7;496:110255. doi: 10.1016/j.jtbi.2020.110255. Epub 2020 Mar 26. J Theor Biol. 2020. PMID: 32223995 Review.
-
Scalable Bayesian phylogenetics.Philos Trans R Soc Lond B Biol Sci. 2022 Oct 10;377(1861):20210242. doi: 10.1098/rstb.2021.0242. Epub 2022 Aug 22. Philos Trans R Soc Lond B Biol Sci. 2022. PMID: 35989603 Free PMC article. Review.
Cited by
-
Differentiable phylogenetics via hyperbolic embeddings with Dodonaphy.Bioinform Adv. 2024 Jun 19;4(1):vbae082. doi: 10.1093/bioadv/vbae082. eCollection 2024. Bioinform Adv. 2024. PMID: 39132286 Free PMC article.
-
Product Manifold Representations for Learning on Biological Pathways.ArXiv [Preprint]. 2025 Feb 4:arXiv:2401.15478v2. ArXiv. 2025. PMID: 39975438 Free PMC article. Preprint.
-
Leaping through Tree Space: Continuous Phylogenetic Inference for Rooted and Unrooted Trees.Genome Biol Evol. 2023 Dec 1;15(12):evad213. doi: 10.1093/gbe/evad213. Genome Biol Evol. 2023. PMID: 38085949 Free PMC article.
-
Common Methods for Phylogenetic Tree Construction and Their Implementation in R.Bioengineering (Basel). 2024 May 11;11(5):480. doi: 10.3390/bioengineering11050480. Bioengineering (Basel). 2024. PMID: 38790347 Free PMC article. Review.
-
Towards explainable interaction prediction: Embedding biological hierarchies into hyperbolic interaction space.PLoS One. 2024 Mar 21;19(3):e0300906. doi: 10.1371/journal.pone.0300906. eCollection 2024. PLoS One. 2024. PMID: 38512848 Free PMC article.
References
-
- Larget B, Simon DL. Markov Chain Monte Carlo Algorithms for the Bayesian Analysis of Phylogenetic Trees. Molecular Biology and Evolution. 1999;16:11. doi: 10.1093/oxfordjournals.molbev.a026160 - DOI
Publication types
MeSH terms
LinkOut - more resources
Full Text Sources
