. 2023 Apr 26;19(4):e1011320.
doi: 10.1371/journal.ppat.1011320. eCollection 2023 Apr.

An aquatic virus exploits the IL6-STAT3-HSP90 signaling axis to promote viral entry

Affiliations

An aquatic virus exploits the IL6-STAT3-HSP90 signaling axis to promote viral entry

Guoli Hou et al. PLoS Pathog. .

Erratum in

Abstract

Viral seasonality in the aquaculture industry is an important scientific issue for decades. While the molecular mechanisms underpinning the temperature-dependent pathogenesis of aquatic viral diseases remain largely unknown. Here we report that temperature-dependent activation of IL6-STAT3 signaling was exploited by grass carp reovirus (GCRV) to promote viral entry via increasing the expression of heat shock protein 90 (HSP90). Deploying GCRV infection as a model system, we discovered that GCRV induces the IL6-STAT3-HSP90 signaling activation to achieve temperature-dependent viral entry. Further biochemical and microscopic analyses revealed that the major capsid protein VP7 of GCRV interacted with HSP90 and relevant membrane-associated proteins to boost viral entry. Accordingly, exogenous expression of either IL6, HSP90, or VP7 in cells increased GCRV entry in a dose-dependent manner. Interestingly, other viruses (e.g., koi herpesvirus, Rhabdovirus carpio, Chinese giant salamander iridovirus) infecting ectothermic vertebrates have evolved a similar mechanism to promote their infection. This work delineates a molecular mechanism by which an aquatic viral pathogen exploits the host temperature-related immune response to promote its entry and replication, instructing us on new ways to develop targeted preventives and therapeutics for aquaculture viral diseases.


Conflict of interest statement

The authors have declared that no competing interests exist.

Figures

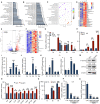
Fig 1
Fig 1. Temperature dependency of GCRV infection.
(A) Double-axis graph depicting the GCHD survey results from 46 fisheries in Hunan province in the last three years (2019–2021). The historical weather data for daily high (red line) and low (blue line) temperatures and the statistics of GCHD outbreaks were recorded on the left y-axis and right y-axis, respectively. (B) A double-axis graph depicting a natural-onset of GCHD outbreak in fish ponds in mid-September was conducted. The number of deaths (blue line) and water temperature (red line) were recorded on the left y-axis and right y-axis, respectively. (C) Grass carp were challenged with GCRV-AH528 (100 μL at 1.0 × 10⁶ TCID50 mL-1 per fish) by intraperitoneal injection at different temperatures. Liver and intestine by day 5 post-infection were collected for HE staining assay. The black arrow denotes vacuolization. Scale bar = 20 μm. (D) The Cytopathic Effect (CPE) and virus particles were observed by optical microscope and transmission electron microscope in CIK cells infected with GCRV (MOI = 5) under different temperatures (18°C, 28°C). Scale bar = 500 μm. (E) The relative GCRV genome replication from infected CIK cells under different temperatures (18°C, 28°C) was analyzed by RT-PCR with the VP4 primer pair. (F) Schematic of experimental design showing temperature-switch affects GCRV replication in CIK cells. (G) The relative GCRV genome replication from 18°C of infection switch to 28°C of infection was analyzed by RT-PCR. (H) The relative GCRV genome replication from 28°C of infection switch to 18°C of infection was analyzed by RT-PCR with the VP7 primer pair. Data were presented as mean ± SD from three independent experiments. Statistical analysis was performed using one-way ANOVA between different groups and the asterisk (*) indicates significant differences between groups. * p<0.05, **p<0.01, ***p<0.001.
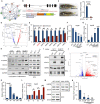
Fig 2
Fig 2. IL6-STAT3 signaling pathway mediates temperature-dependent GCRV infection.
(A-B) KEGG pathway enrichment analysis of DEGs from transcriptomic data related to CIK cells by temperature-switch treatment from 18°C to 28°C (NCBI SRA database accession number PRJNA862271) (A) and grass carp head kidney by GCRV infection (NCBI SRA database accession number PRJNA759556) (B). The top 20 significantly enriched pathways (ranked by p-value) are shown in the bar graph. (C) KEGG pathway enrichment analysis of transcriptomic data from grass carp head kidney by GCRV infection at 28°C was presented in the form of scatterplots based on enrichment factor and p-value. The enrichment factor is the ratio between the DEG number and the number of all genes in a certain gene enrichment term. The sizes of the dots denote the number of DEGs, while colors correspond to the p-value. (D) Heat map analysis of DEGs that were up-regulated in the GCRV-infected spleen tissue was summarized (NCBI SRA database accession number PRJNA759556). (E) Transcriptomic data of all genes differentially regulated from GCRV-infected spleen samples of grass carp (NCBI SRA database accession number PRJNA600033) were analyzed by volcano plot analysis. (F) Transcriptomic data from (E) profiling some upregulated pro-inflammatory genes were analyzed by heat map analysis. (G) CIK cells under temperature-switch treatment from 18°C to 28°C were harvested to analyze the expression of pro-inflammatory genes by RT-PCR. (H) CIK cells infected with GCRV (MOI = 5) under different temperatures (18°C, 28°C) were harvested to quantify the expression of IL6 by RT-PCR. (I-L) The relative proliferation of the GCRV genome (with the VP4 primer pair) and expression of IL6 in the spleen (I-J) and gills (K-L) of grass carp from different time points were quantified by RT-PCR. (M-N) CIK cells under temperature-switch treatment from 18°C to 28°C for 1 h were harvested to analyze the signal of STAT3 and the IL6-STAT3 axis transcription by Western blotting analysis (M) and RT-PCR (N), respectively. STAT3 phophorylation specific antibody (Y705) was probed to dictate the activation of STAT3. The density of the Western blot bands was quantified using ImageJ software. (O) CIK cells pre-treated with STAT3 inhibitor Stattic (1μM) were infected with GCRV (MOI = 5) at 28°C and harvested to analyze the relative viral genome level by RT-PCR with the VP7 primer pair. (P-Q) CIK cells pre-treated with different doses of STAT3 inhibitor Stattic (0.5 μM, 1 μM, 2 μM) were infected with GCRV (MOI = 5) at 28°C and harvested to analyze the expression of IL6 (P) and relative viral genome level (O) by RT-PCR with the VP7 primer pair. Data were presented as mean ± SD from three independent experiments. Statistical analysis was performed using one-way ANOVA between different groups and the asterisk (*) indicates significant differences between groups. * p<0.05, **p<0.01, ***p<0.001.
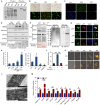
Fig 3
Fig 3. IL6-STAT3-HSP90 axis mediates temperature dependency of GCRV infection.
(A) Protein-protein interaction network of human STAT3 was analyzed online with the STRING database (http://string-db.org) under a ‘Creative Commons BY 4.0’ license (https://cn.string-db.org/cgi/access?footer_active_subpage=licensing). (B) Schematic diagram of constructing zebrafish STAT3 knockout mutant. (C) STAT3 gene expression in the STAT3-KO mutant was verified by RT-PCR. (D) Transcriptomic data of all genes differentially regulated from STAT3-KO mutant were collected to quantify the differentially regulated genes by volcano plot analysis (raw data in NCBI database accession number SRR3985375). (E) The expression of heat shock proteins from STAT3-WT and STAT3-KO mutants was validated by RT-PCR analysis. (F) CIK cells treated with different doses of STAT3 inhibitor Stattic (0.5 μM, 1 μM, 2 μM) were prepared to quantify the relative expression of HSP90 by RT-PCR analysis. (G) CIK cells transfected with different doses of STAT3-C plasmids were prepared to quantify the transcription of HSP90 by RT-PCR analysis. (H) CIK cells under different temperatures (18°C, 28°C) or temperature-switch treatment from 18°C to 28°C were prepared to analyze the subcellular fractionation of HSP90 and STAT3 by Western blotting. Integrin-αv and GAPDH served as the marker of the plasma membrane, and cytoplasm, respectively. Whole-cell-lysates were loaded as controls. (I) CIK cells under temperature-switch treatment from 18°C to 28°C were prepared for endogenous co-immunoprecipitation analysis with STAT3 antibody to examine the interaction between HSP90 and STAT3. IP and WCL indicate immunoprecipitation and whole-cell-lysates, respectively. (J) Volcano plot analysis of all genes differentially regulated from transcriptomic data in CIK cells under temperature-switch treatment from 18°C to 28°C. (K) Intestines of grass carp under temperature-switch treatment from 18°C to 28°C were prepared to quantify the relative expression of HSP90 by RT-PCR. (L) CIK cells infected with GCRV (MOI = 5) under different temperatures were prepared to analyze the relative expression of HSP90 by RT-PCR. (M) CIK/GCO cells under temperature-switch treatment from 18°C to 28°C or GCRV infection (MOI = 5) at 28°C were prepared to analyze the expression of HSP90 by Western blotting analysis. The density of the Western blot bands was quantified using ImageJ software. (N) CIK cells pre-treated with different doses (0.5 μM, 1 μM, 2 μM) of HSP90 inhibitor 17-AAG were infected with GCRV (MOI = 5) at 28°C and harvested to quantify the relative viral genome replication with the VP7 primer pair. Data were presented as mean ± SD from three independent experiments. Statistical analysis was performed using one-way ANOVA between different groups and the asterisk (*) indicates significant differences between groups. * p<0.05, **p<0.01, ***p<0.001.
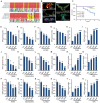
Fig 4
Fig 4. IL6-STAT3-HSP90 axis regulates GCRV entry.
(A) GCO/CIK cells infected with GCRV (MOI = 5) at different temperatures for 1 h were prepared to quantify the relative genome entry by RT-PCR with the VP7 primer pair. (B) CIK cells pre-treated with 1 μM of bazedoxifene or Stattic were infected with GCRV (MOI = 5) at 28°C followed by relative GCRV genome entry quantification by RT-PCR with the VP7 primer pair. (C-F) CIK cells pre-treated with different doses of Stattic, IL6 (plasmid transfection), PGE2, or VPA were infected with GCRV (MOI = 5) at 28°C for 1 h and harvested to analyze the relative viral genome entry by RT-PCR analysis with the VP7 primer pair. (G-H) CIK or GCO cells transfected with different doses of HSP90 plasmids were infected with GCRV (MOI = 5) for 1 h and harvested to quantify the relative viral genome entry by RT-PCR with the VP7 primer pair. (I-J) CIK cells pretreated with different doses (0.5 μM, 1 μM, 2 μM) of AUY922 or 17-AAG were infected with GCRV (MOI = 5) at 28°C for 1 h and harvested to quantify the relative viral genome entry by RT-PCR with the VP7 primer pair. (K-L) CIK cells grown at 18°C, 28°C, or 18°C pre-incubated with exogenous HSP90 were infected with GCRV (MOI = 5) for 1 h and harvested to analyze the relative viral entry level by RT-PCR (K) and Western blotting (L). (M) CIK cells transfected with control siRNA and three different HSP90 siRNAs were infected with GCRV (MOI = 5) for 1 h, followed by harvest for viral genome entry quantification by RT-PCR. (N-O) Transcriptomic data of CIK cells treated with 17-AAG (raw data in NCBI database accession number PRJNA862332) were prepared to analyze the differentially downregulated genes by heat map (N) and KEGG enrichment (O) analysis. Data were presented as mean ± SD from three independent experiments. Statistical analysis was performed using one-way ANOVA between different groups and the asterisk (*) indicates significant differences between groups. * p<0.05, **p<0.01, ***p<0.001.
Fig 5
Fig 5. HSP90 interacts with VP7 and STAT3 on the cellular membrane to promote GCRV entry.
(A) Recombinant protein VP5-HIS-EGFP and VP7-HIS-EGFP were purified using standard nickel-column affinity protocol to homogeneity and analyzed by SDS-PAGE. (B) Purified recombinant protein coupled with Ni beads was examined by optical microscopy analysis. (C) GCO cells were incubated with the purified recombinant protein VP5-HIS-EGFP /VP7-HIS-EGFP, and the binding between VP5/VP7 and GCO cells was analyzed by optical microscopy analysis. The empty vector was handled as a control. Scale bars denote 5 μm. (D) CIK cells were prepared for subcellular fractionation followed by pulldown analysis with purified his-tagged VP7/VP5. The precipitates were analyzed by Western blotting with the corresponding antibody. Ponceau S Staining served as a loading control. (E) CIK cell lysates were incubated with purified his-tagged VP7, The precipitates from the pulldown complex were analyzed by Western blotting with the corresponding antibody. EEA1 (early endosomal antigen 1) served as an early endosome marker. Ponceau S Staining served as a loading control. Pulldown analyses were conducted to determine the interaction between STAT3 and VP7 in CIK cells. IP and WCL indicate immunoprecipitation and whole-cell-lysates, respectively. (F) The direct interaction between VP7 and HSP90 was examined by far-Western blotting analysis in vitro. His tagged VP7 served as bait followed by his antibody to probe the HSP90 signal from the CIK lysates. (G) GCO, CIK, or 293T cells stably expressing tagged VP7 and HSP90 were prepared to analyze their colocalization by immunofluorescence analysis. Scale bars: 20 μm. (H) CIK cells pre-treated with different doses of VP7 were infected with GCRV at 28°C for 1 h and prepared to analyze the relative viral genome entry by RT-PCR analysis. (I) CIK cells pre-treated with VP7 or endocytosis pathway inhibitor were infected with GCRV at 28°C for 1 h and prepared to quantify the relative viral genome entry by RT-PCR. Cells pre-treated with Vec as a control. (J) CIK cells pre-treated with VP7 in the presence or absence of AUY922 were infected with GCRV at 28°C for 1 h and prepared to quantify relative viral genome entry by RT-PCR. (K) CIK cells transfected with VP7 or vector plasmids were prepared for live cell imaging with Nikon confocal laser microscope system. (L) CIK cells treated with purified VP7 protein were prepared to analyze the morphological and structural change by electron microscopy analysis. (M) CIK cells pre-treated with VP7 were infected with GCRV at 28°C for 1 h and prepared to quantify the relative expression of many plasma membrane-related genes by RT-PCR. Data were presented as mean ± SD from three independent experiments. Statistical analysis was performed using one-way ANOVA between different groups and the asterisk (*) indicates significant differences between groups. * p<0.05, **p<0.01, ***p<0.001.
Fig 6
Fig 6. IL6-STAT3-HSP90 axis mediates viral entry in aquatic ectotherms.
(A) Evolutionary conserveness analysis of STAT3 was conducted by multiple amino acids alignment of STAT3 from different species. The phosphorylation residue tyrosine 705 (Y705) which mediates the canonical STAT3 activation was highlighted in bold with dark shading. (B) Predicted three-dimensional structures of IL6-STAT3-HSP90 axis-related protein were performed with the I-TASSER program (https://zhanggroup.org/I-TASSER/) and visualized with the PyMOL program. (C) Koi (average weight 10 g) were intraperitoneally injected with KHV or PBS under different temperatures, and survival was monitored over 7 days. (D-I) CCB cells pre-treated with different doses of inhibitors or agonists (Stattic, bazedoxifene, AUY922, 17-AAG, PGE2, VPA) were infected with KHV (MOI = 5) at 22°C for 1 h and prepared to analyze the relative genome entry by RT-PCR with the ORF4L primer pair. (J-O) EPC cells pre-treated with different doses of inhibitors or agonists (Stattic, bazedoxifene, AUY922, 17-AAG, PGE2, VPA) were infected with SVCV (MOI = 5) at 22°C for 1 h and prepared to analyze the relative viral genome entry by RT-PCR analysis with the GP primer pair. (P-U) GSM cells pre-treated with different doses of inhibitors or agonists (Stattic, bazedoxifene, AUY922, 17-AAG, PGE2, VPA) were infected with GSIV (MOI = 5) at 22°C for 1 h and prepared to quantify the relative viral genome entry by RT-PCR with the MCP primer pair. Data were presented as mean ± SD from three independent experiments. Statistical analysis was performed using one-way ANOVA between different groups and the asterisk (*) indicates significant differences between groups. * p<0.05, **p<0.01, ***p<0.001.
Fig 7
Fig 7. Graphical abstract.
A model depicting the temperature-dependent activation of the IL6-STAT3-HSP90 signaling axis is exploited by aquatic viruses to facilitate viral entry into host cells. Temperature stress induces IL6-gp130 mediated P-STAT3 activation, which translocates into the nucleus to promote the transcription of pro-inflammatory cytokines (e.g., IL6, TNF-α) and heat-shock-related chaperone molecule HSP90. HSP90 is mainly positioned at the plasma membrane and is capable of bridging the interaction between viral proteins and host receptors to promote viral entry.

Similar articles

Cited by

References

    1. Kajan GL, Doszpoly A, Tarjan ZL, Vidovszky MZ, Papp T. Virus-Host Coevolution with a Focus on Animal and Human DNA Viruses. J Mol Evol. 2020;88(1):41–56. Epub 2019/10/11. doi: 10.1007/s00239-019-09913-4 . - DOI - PMC - PubMed
    1. Yang Q, Shu HB. Deciphering the pathways to antiviral innate immunity and inflammation. Adv Immunol. 2020;145:1–36. doi: 10.1016/bs.ai.2019.11.001 Epub 2019 Dec 3. . - DOI - PubMed
    1. Kikkert M. Innate Immune Evasion by Human Respiratory RNA Viruses. Journal of Innate Immunity. 2020;12(1):4–20. doi: 10.1159/000503030 - DOI - PMC - PubMed
    1. Harrison AR, Moseley GW. The Dynamic Interface of Viruses with STATs. Journal of Virology. 2020;94(22). doi: 10.1128/JVI.00856-20 - DOI - PMC - PubMed
    1. Ezeonwumelu IJ, Garcia-Vidal E, Ballana E. JAK-STAT Pathway: A Novel Target to Tackle Viral Infections. Viruses-Basel. 2021;13(12). doi: 10.3390/v13122379 - DOI - PMC - PubMed

Publication types