. 2023 Sep 26;7(18):5409-5420.
doi: 10.1182/bloodadvances.2022008462.

Mecom mutation related to radioulnar synostosis with amegakaryocytic thrombocytopenia reduces HSPCs in mice

Affiliations

Mecom mutation related to radioulnar synostosis with amegakaryocytic thrombocytopenia reduces HSPCs in mice

Koki Nagai et al. Blood Adv. .

Abstract

Radioulnar synostosis with amegakaryocytic thrombocytopenia (RUSAT) is an inherited bone marrow failure syndrome characterized by the congenital fusion of the forearm bones. RUSAT is largely caused by missense mutations that are clustered in a specific region of the MDS1 and EVI1 complex locus (MECOM). EVI1, a transcript variant encoded by MECOM, is a zinc finger transcription factor involved in hematopoietic stem cell maintenance that induce leukemic transformation when overexpressed. Mice with exonic deletions in Mecom show reduced hematopoietic stem and progenitor cells (HSPCs). However, the pathogenic roles of RUSAT-associated MECOM mutations in vivo have not yet been elucidated. To investigate the impact of the RUSAT-associated MECOM mutation on the phenotype, we generated knockin mice harboring a point mutation (translated into EVI1 p.H752R and MDS1-EVI1 p.H942R), which corresponds to an EVI1 p.H751R and MDS1-EVI1 p.H939R mutation identified in a patient with RUSAT. Homozygous mutant mice died at embryonic day 10.5 to 11.5. Heterozygous mutant mice (Evi1KI/+ mice) grew normally without radioulnar synostosis. Male Evi1KI/+ mice, aged between 5 and 15 weeks, exhibited lower body weight, and those aged ≥16 weeks showed low platelet counts. Flow cytometric analysis of bone marrow cells revealed a decrease in HSPCs in Evi1KI/+ mice between 8 and 12 weeks. Moreover, Evi1KI/+ mice showed delayed leukocyte and platelet recovery after 5-fluorouracil-induced myelosuppression. These findings suggest that Evi1KI/+ mice recapitulate the bone marrow dysfunction in RUSAT, similar to that caused by loss-of-function Mecom alleles.


Conflict of interest statement

Conflict-of-interest disclosure: The authors declare no competing financial interests.

Figures

None
Graphical abstract
Figure 1.
Figure 1.
Generation of mutant mice harboring the point mutation translated into EVI1 H752R and MDS1-EVI1 H942R in mice, corresponding to EVI1 H751R and MDS1-EVI1 H939R in humans. (A) The point mutation is located in the eighth zinc finger motifs of EVI1 and MDS1-EVI1. The sequence of the eighth zinc finger motif is given in a box. “C” and “H,” shaded in a gray, bind to a zinc ion. EVI1 H751 in humans, MDS1-EVI1 H939 in humans, EVI1 H752 in mice, and MDS1-EVI1 in mice are represented in red letters. (B) Overexpression of C-terminal FLAG-tagged wild-type or mutant hEVI1/mEVI1 in NIH3T3 cells. (C) Luciferase assay for assessing the effects of wild-type or mutant hEVI1/mEVI1 on AP-1 and TGF-β signaling. pCAGGS empty vector (mock) indicates the effectiveness of newborn calf serum or TGF-β1 stimulation. The relationship between the reactions against the stimulation between wild-type and mEVI1 H752R resembles that between wild-type and hEVI1 H751R. Representative data from 3 experiments performed in triplicates are shown. Values are the mean ± standard error of the mean (SEM) of 3 samples of the representative experiment. Underlined numbers denote the P value (2-tailed Welch t test). Threshold significance level, P = .05.
Figure 2.
Figure 2.
Comparison between Evi1KI/+and Evi1+/+mice. (A) External morphology of Evi1+/+ and Evi1KI/+ mice. Images of 10-week-old male littermates. Gross appearance, face, left forelimb, and left hindlimb of Evi1KI/+ mice compared with those of Evi1+/+ mice. There are no external morphological abnormalities. (B) Representative embryos in their yolk sacs at E10.5. The Evi1KI/KI embryo has an avascular yolk sac. Bars represent 2.4 mm. (C) Representative Evi1+/+, Evi1KI/+, and Evi1KI/KI littermates at E10.5. The Evi1KI/KI embryo has a flattened head and poor vascularization. Its size is almost the same as the size of Evi1+/+ and Evi1KI/+ mice. Bars represent 1.2 mm.
Figure 3.
Figure 3.
Comparison between Evi1KI/+and Evi1+/+mice. (A) Body weight of male and female Evi1+/+ and Evi1KI/+ mice. Values are the mean ± SEM of each group (male Evi1+/+, n = 9; male Evi1KI/+, n = 8; female Evi1+/+, n = 10; and female Evi1KI/+, n = 6). In male mice aged between 5 and 7 weeks, Evi1KI/+ mice had significantly lower body weights than Evi1+/+ mice. In female mice aged 5 weeks, Evi1KI/+ mice had significantly lower body weights than Evi1+/+ mice. (B) The photograph shows the right palm of Evi1+/+ and Evi1KI/+ mice. D3/palm was calculated by dividing D3 length by palm length. D3/palm of Evi1+/+ and Evi1KI/+ age- and sex-matched littermates (Evi1+/+, n = 7; Evi1KI/+, n = 7). There is no significant difference between Evi1+/+ and Evi1KI/+ age- and sex-matched littermates. Threshold significance level, P = .05 (2-tailed Welch t test). Underlined numbers denote the P value. Values are the mean ± SEM of each group. WT, Evi1+/+ mice; KI, Evi1KI/+ mice.
Figure 4.
Figure 4.
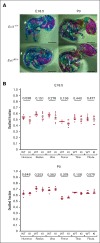
Evi1KI/+mice show mild ossification delay. (A) Alcian blue and Alizarin red staining of Evi1+/+ mice and Evi1KI/+ mice at E18.5 and P0. Bars represent 5 mm. The ossified fraction was used to evaluate ossification, based on the study by Chang et al. (B) Ossification of Evi1+/+ and Evi1KI/+ mice. At E18.5, although only the comparison of the humeral ossification was statistically significant, Evi1KI/+ mice (n = 7) exhibited delayed ossification compared with Evi1+/+ mice (n = 8). At P0, there was no significant difference between the ossification of Evi1+/+ mice (n = 7) and Evi1KI/+ mice (n = 6). Threshold significance level, P = .05 (2-tailed Welch t test). Underlined numbers denote the P value. Values are the mean ± SEM of each group. WT, Evi1+/+ mice; KI, Evi1KI/+ mice.
Figure 5.
Figure 5.
Evi1KI/+mice show decreased platelet count with age. (A) Peripheral blood cells of Evi1+/+ and Evi1KI/+ age- and sex-matched littermates (Evi1+/+, n = 10; Evi1KI/+, n = 10). The platelet count of Evi1KI/+ mice was significantly lower than that of Evi1+/+ mice at 16, 30, 40, and 50 weeks of age. Threshold significance level, P = .05 (2-tailed Welch t test). Underlined numbers denote the P value. Values are the mean ± SEM of each group.
Figure 6.
Figure 6.
Evi1KI/+mice show impaired HSPCs. (A) Flow cytometric analysis of HSPCs. BMCs were obtained from the bilateral femur and tibia of Evi1+/+ and Evi1KI/+ age- and sex-matched littermates. The LSK compartment of Evi1KI/+ mice was visually reduced compared with that of Evi1+/+ mice. Representative data from 5 experiments are shown. (B) The number of LSK cells and their components. The LSK cell count of Evi1KI/+ mice (n = 5) was significantly lower than that of Evi1+/+ mice (n = 5). (C) Flow cytometric analysis of myeloid progenitor cells. The LK compartment of Evi1KI/+ mice resembled that of Evi1+/+ mice. Representative data from 5 experiments are shown. (D) The number of LK cells and its components. There was no significant difference between the number of LK cells and their components of Evi1KI/+ mice (n = 5) and those of Evi1+/+ mice (n = 5). Threshold significance level, P = .05 (2-tailed Welch t test). Underlined numbers denote the P value. Values are the mean ± SEM of each group. WT, Evi1+/+ mice; KI, Evi1KI/+ mice.
Figure 7.
Figure 7.
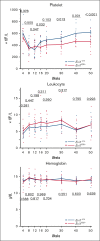
Evi1KI/+mice show low platelet count and delayed leukocyte and platelet recovery from FU treatment. The peripheral blood cells of Evi1+/+ and Evi1KI/+ age- and sex-matched littermates after FU administration (Evi1+/+, n = 7 vs Evi1KI/+, n = 7). The platelet and leukocyte count recovery of Evi1KI/+ mice was slow and delayed. Platelet count rebound of Evi1KI/+ mice was milder than that of Evi1+/+ mice. Values are the mean ± SEM of each group. Threshold significance level, P = .05 (2-tailed Welch t test).

Similar articles

Cited by

References

    1. Bluteau O, Sebert M, Leblanc T, et al. A landscape of germ line mutations in a cohort of inherited bone marrow failure patients. Blood. 2018;131(7):717–732. - PubMed
    1. Germeshausen M, Ancliff P, Estrada J, et al. MECOM-associated syndrome: a heterogeneous inherited bone marrow failure syndrome with amegakaryocytic thrombocytopenia. Blood Adv. 2018;2(6):586–596. - PMC - PubMed
    1. Lord SV, Jimenez JE, Kroeger ZA, et al. A MECOM variant in an African American child with radioulnar synostosis and thrombocytopenia. Clin Dysmorphol. 2018;27(1):9–11. - PubMed
    1. Niihori T, Ouchi-Uchiyama M, Sasahara Y, et al. Mutations in MECOM, encoding oncoprotein EVI1, cause radioulnar synostosis with amegakaryocytic thrombocytopenia. Am J Hum Genet. 2015;97(6):848–854. - PMC - PubMed
    1. Ripperger T, Hofmann W, Koch JC, et al. MDS1 and EVI1 complex locus (MECOM): a novel candidate gene for hereditary hematological malignancies. Haematologica. 2018;103(2):e55–e58. - PMC - PubMed

Publication types

Substances

Supplementary concepts