. 2023 Jul 5;111(13):2051-2064.e6.
doi: 10.1016/j.neuron.2023.04.005. Epub 2023 Apr 25.

Maintenance of a short-lived protein required for long-term memory involves cycles of transcription and local translation

Affiliations

Maintenance of a short-lived protein required for long-term memory involves cycles of transcription and local translation

Sulagna Das et al. Neuron. .

Abstract

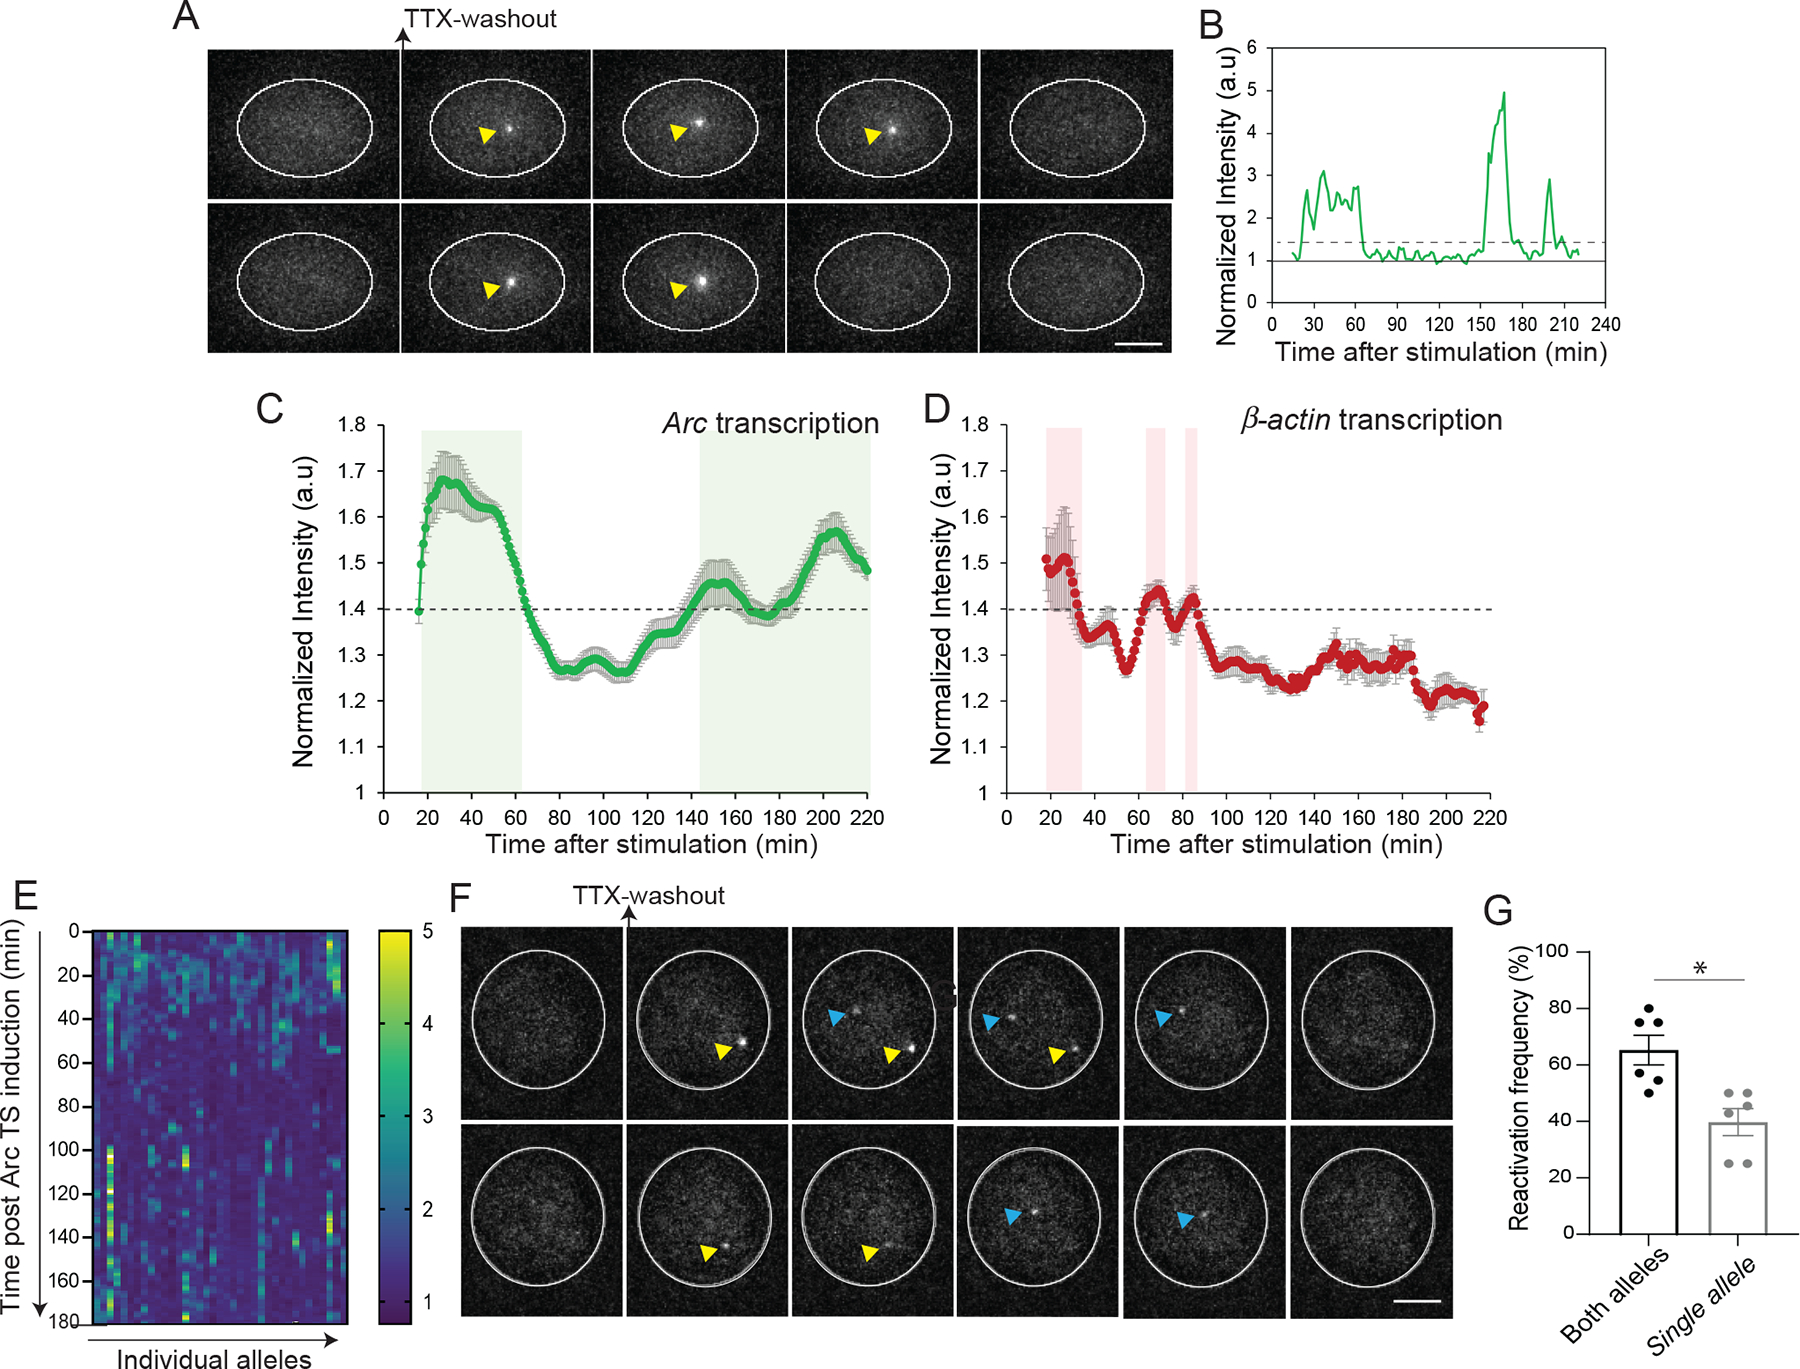
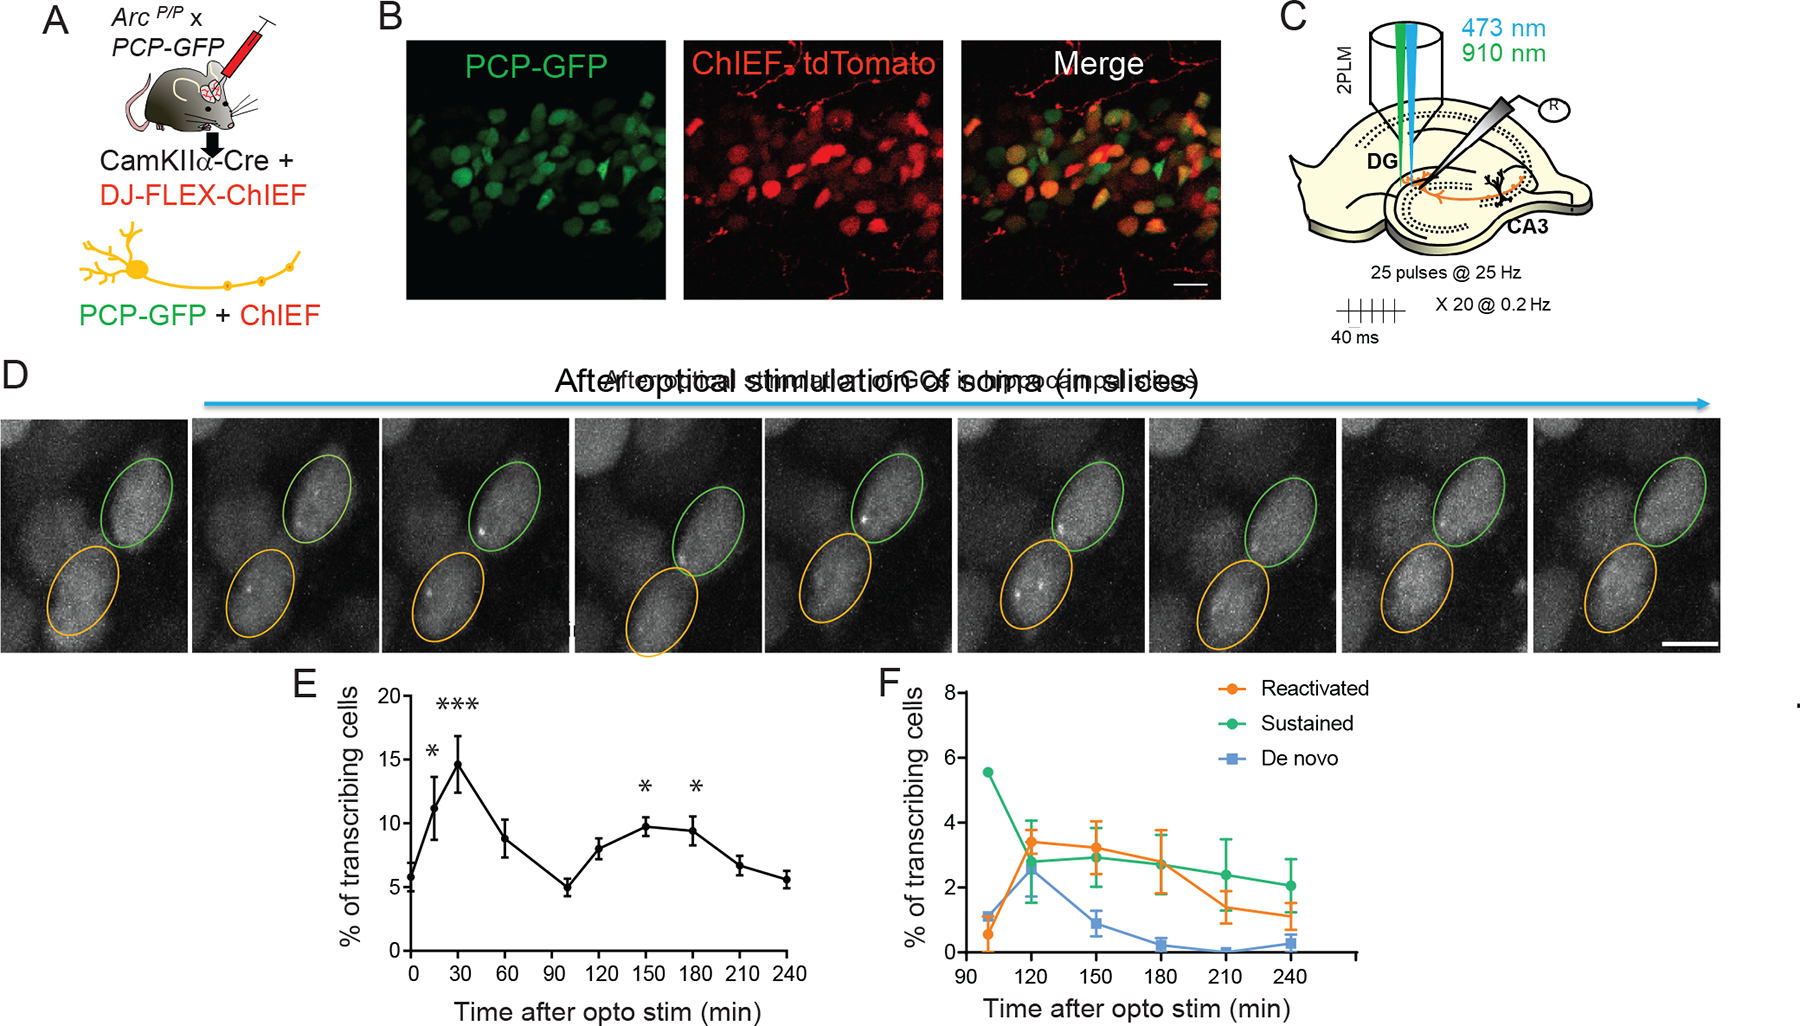
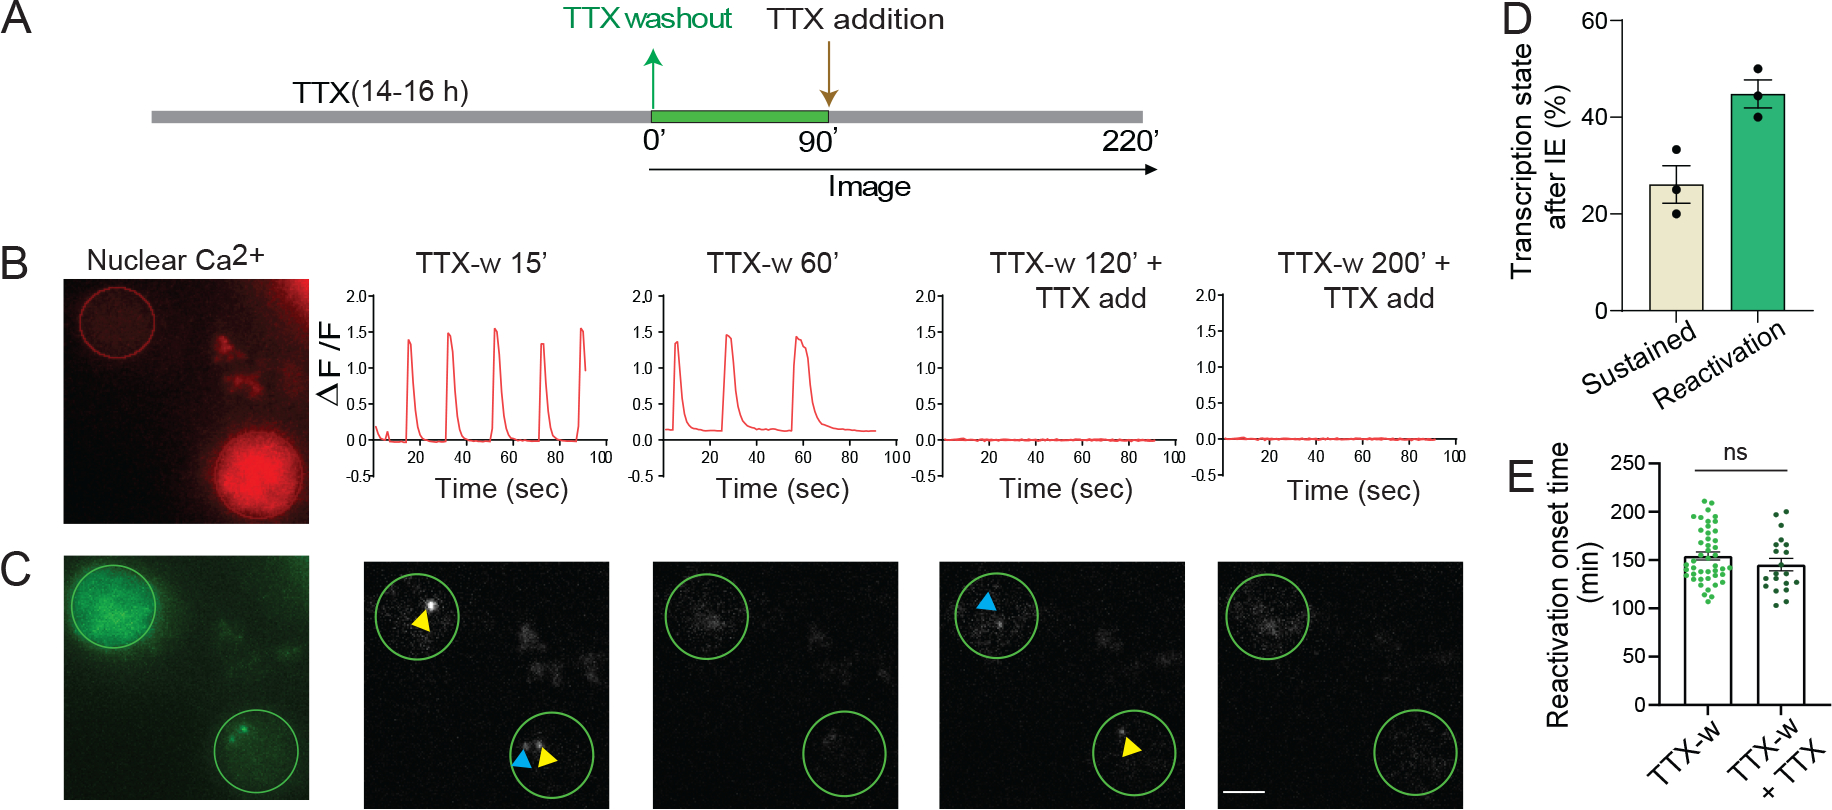
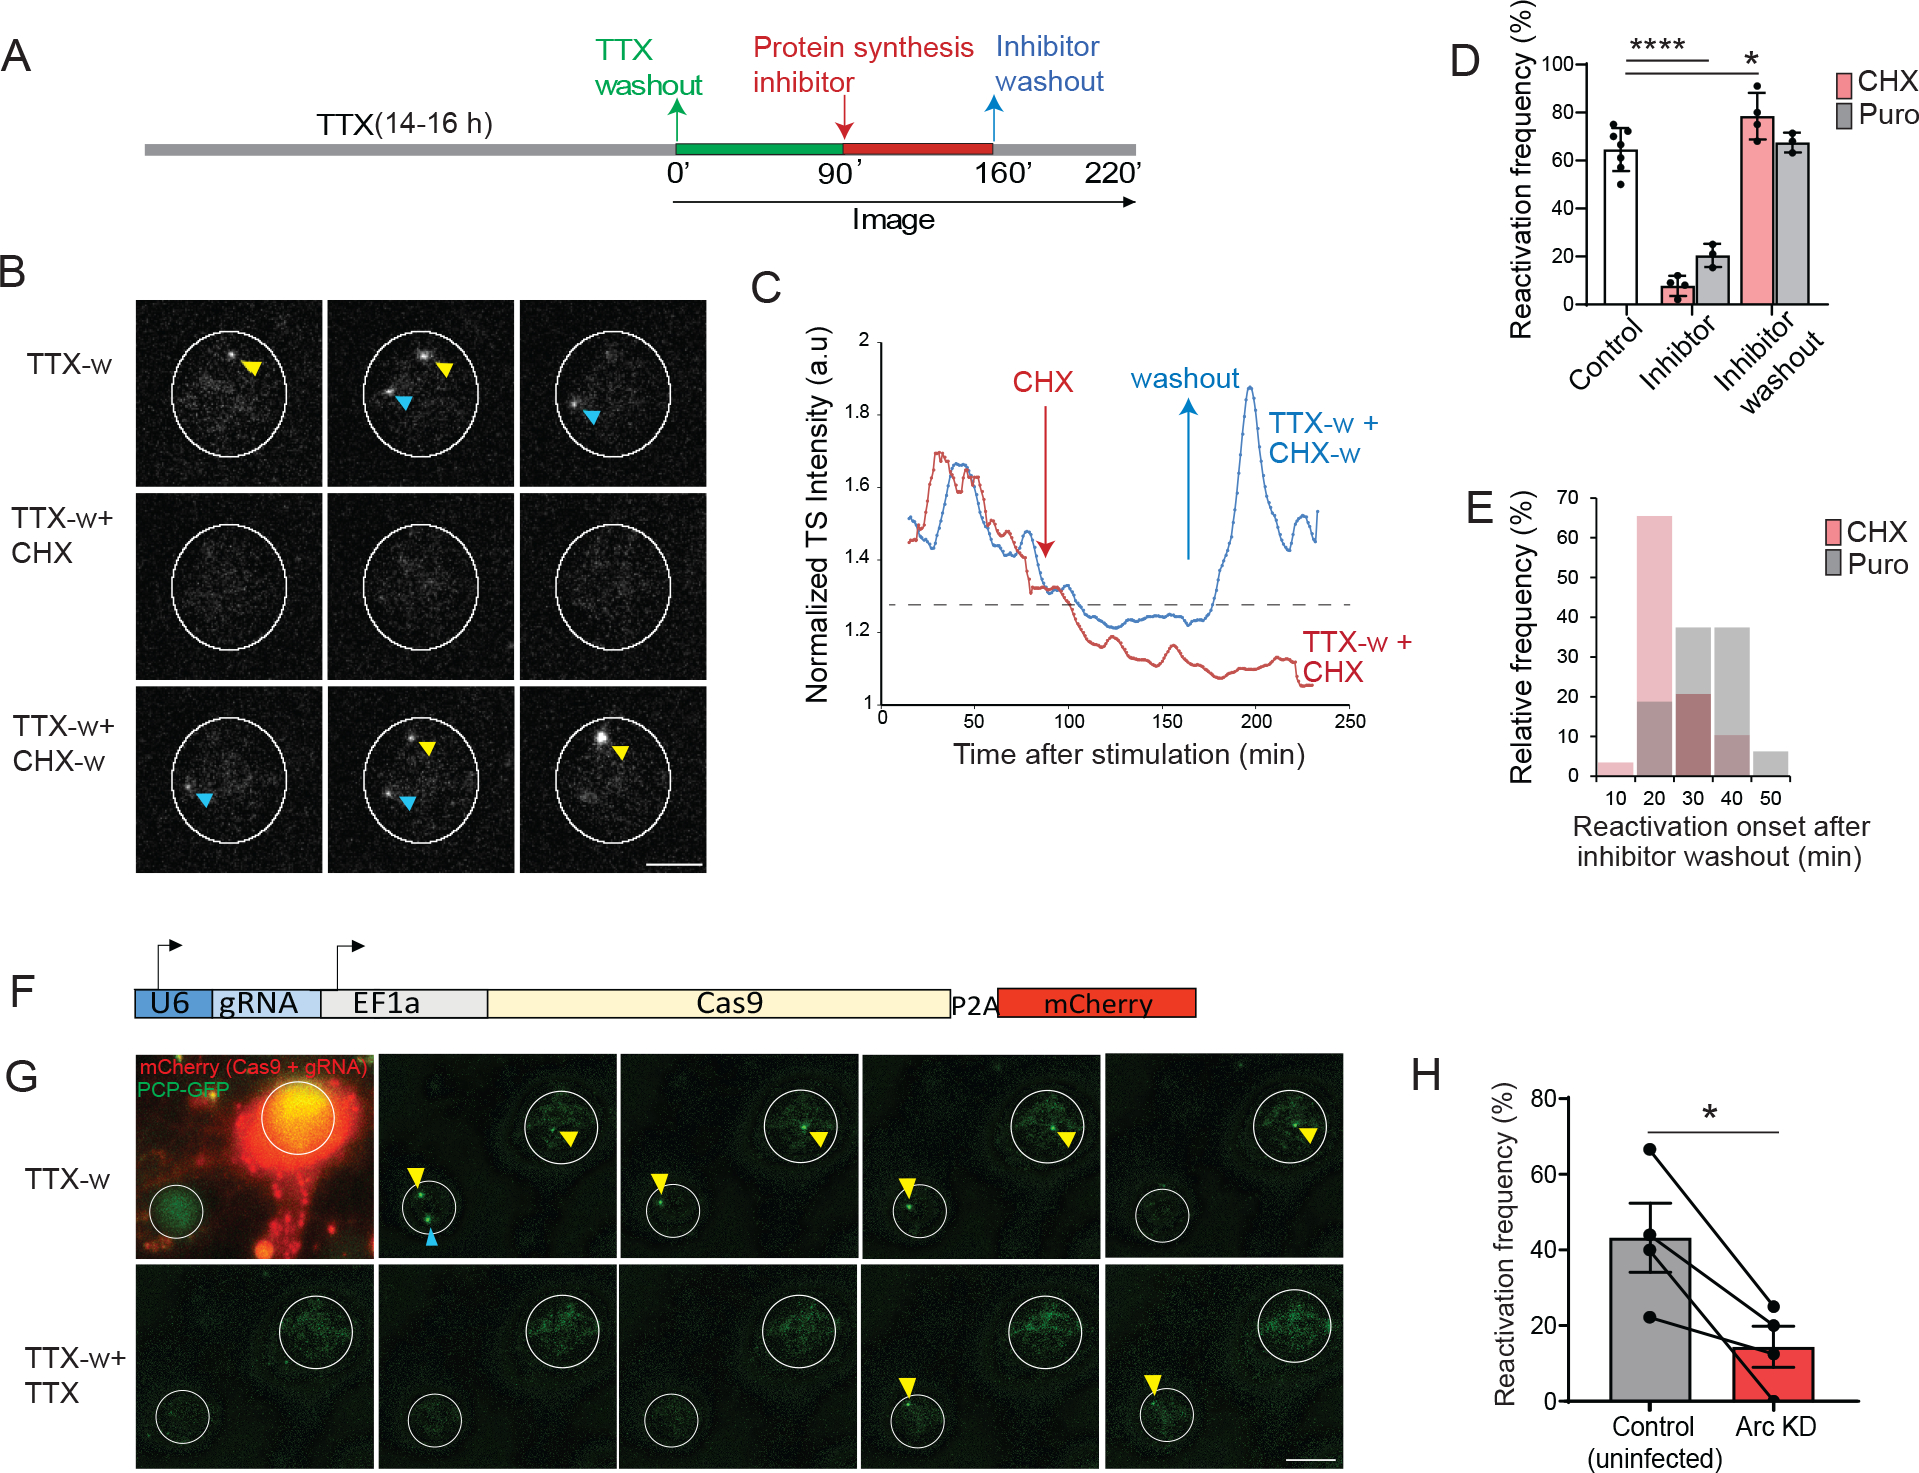
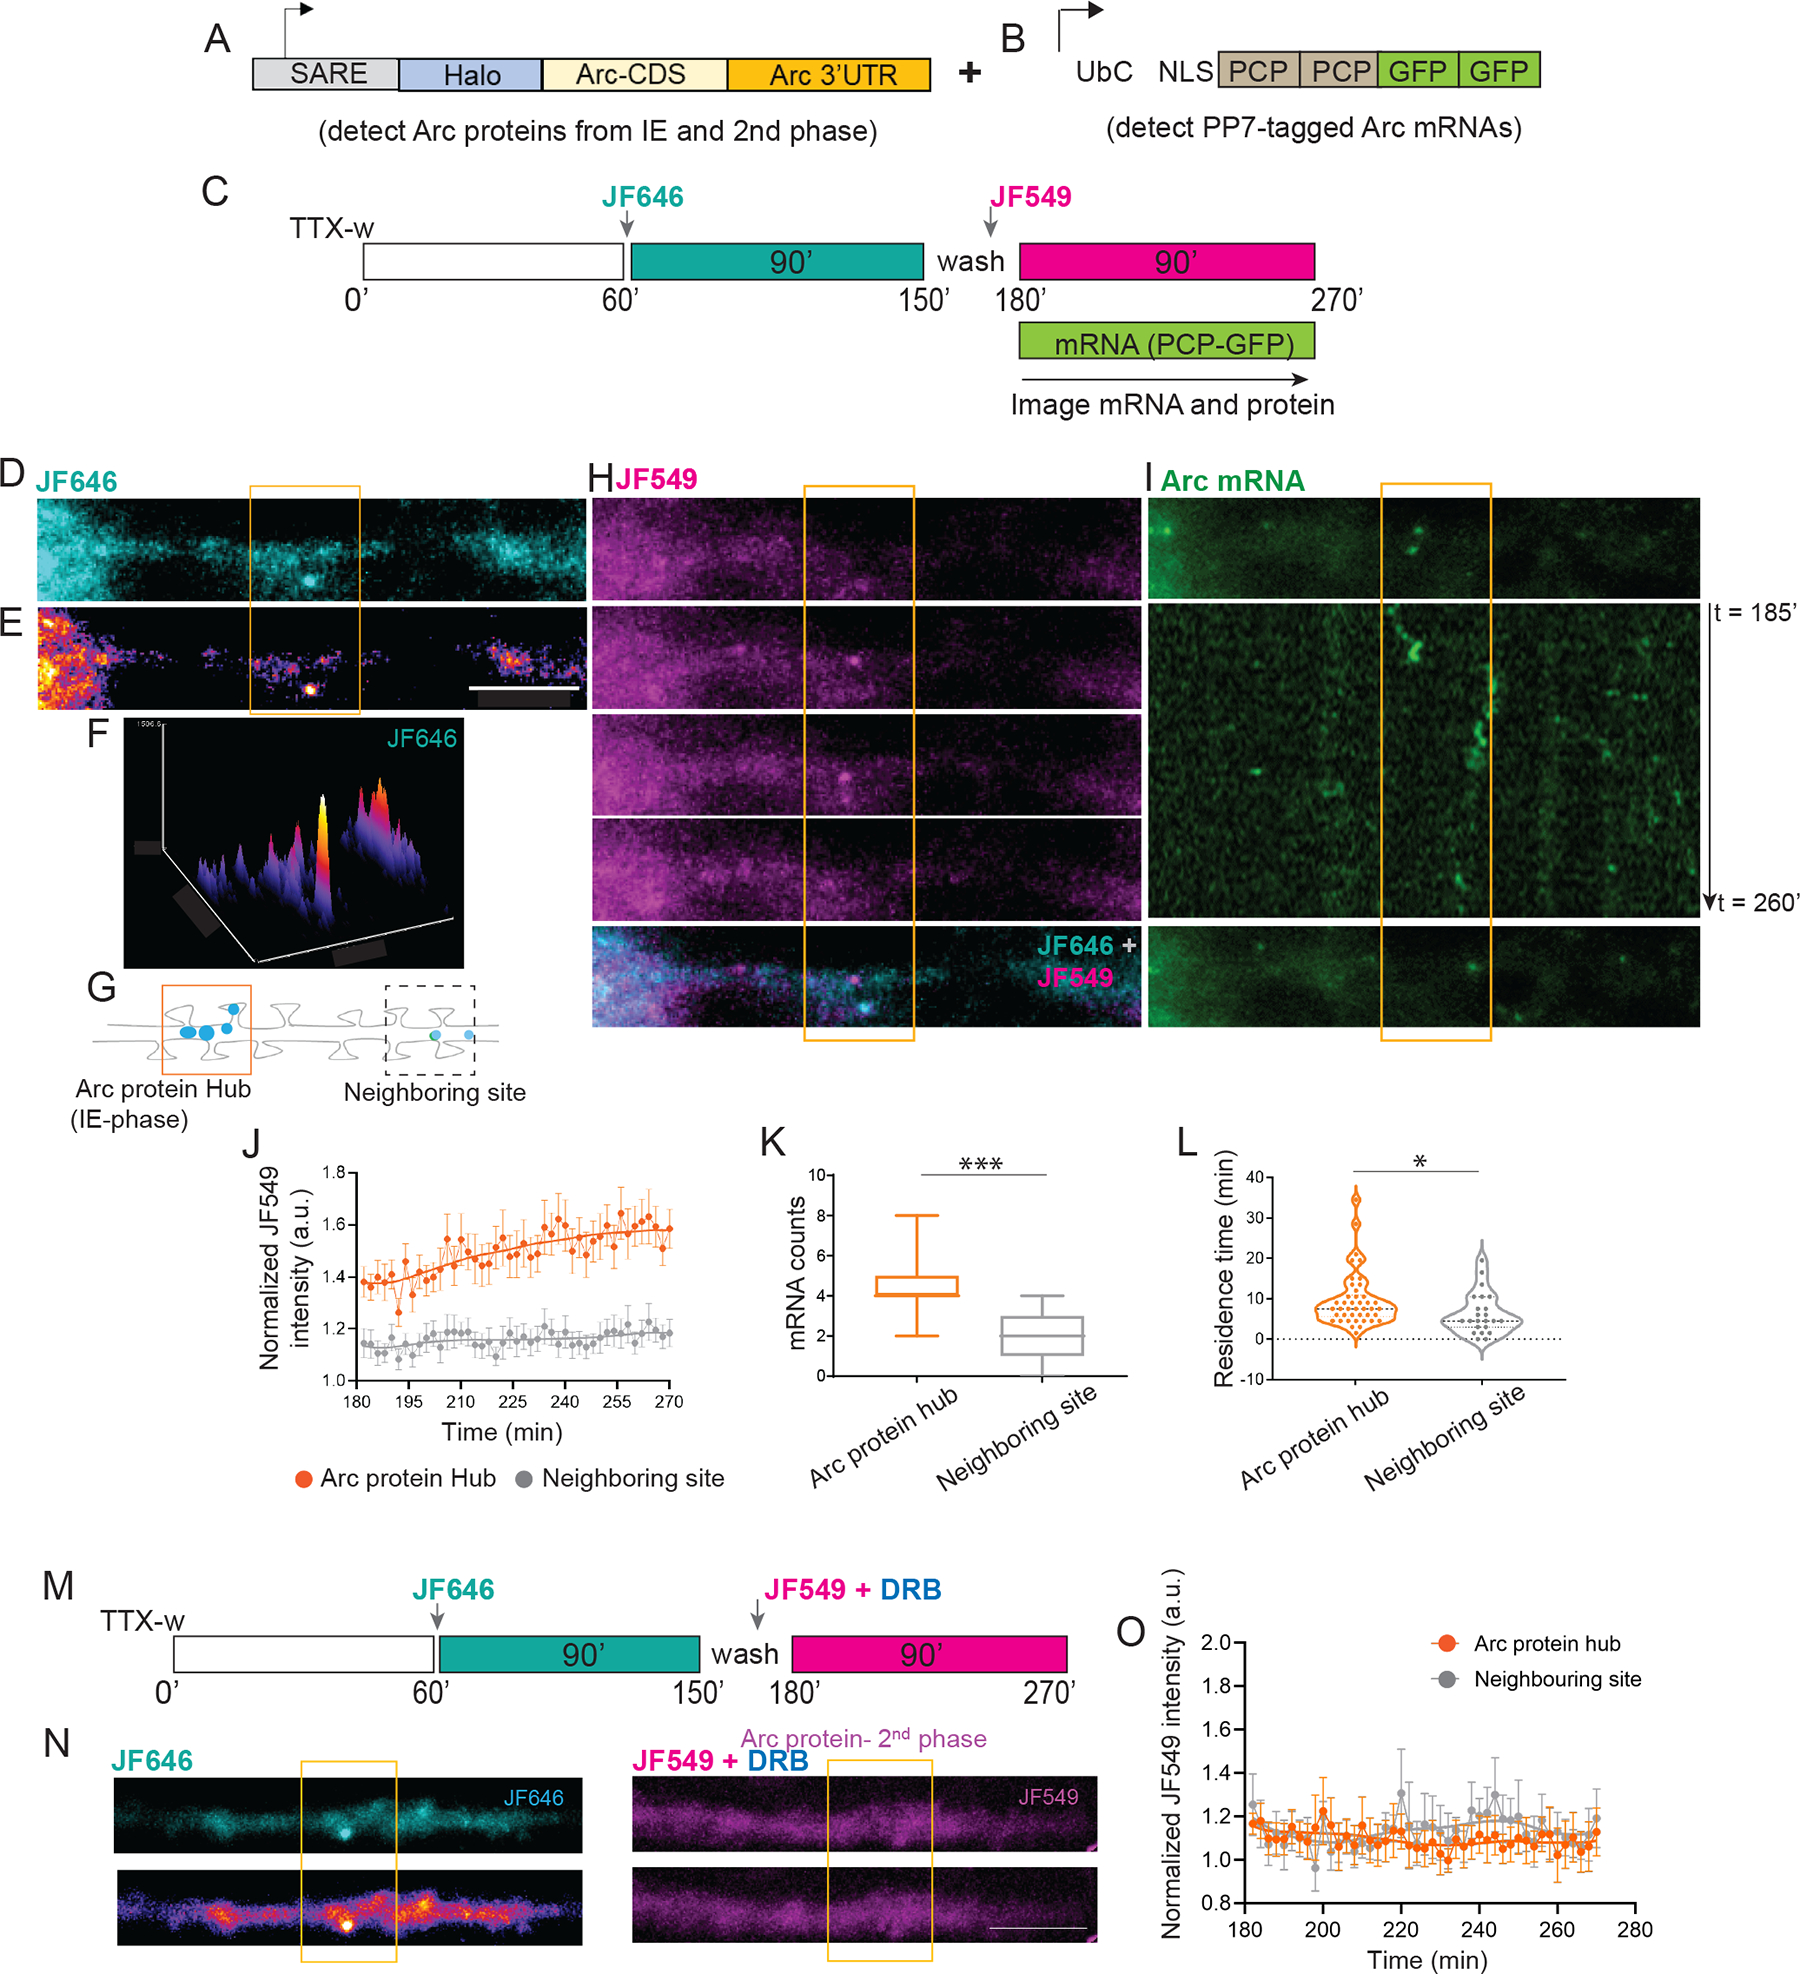
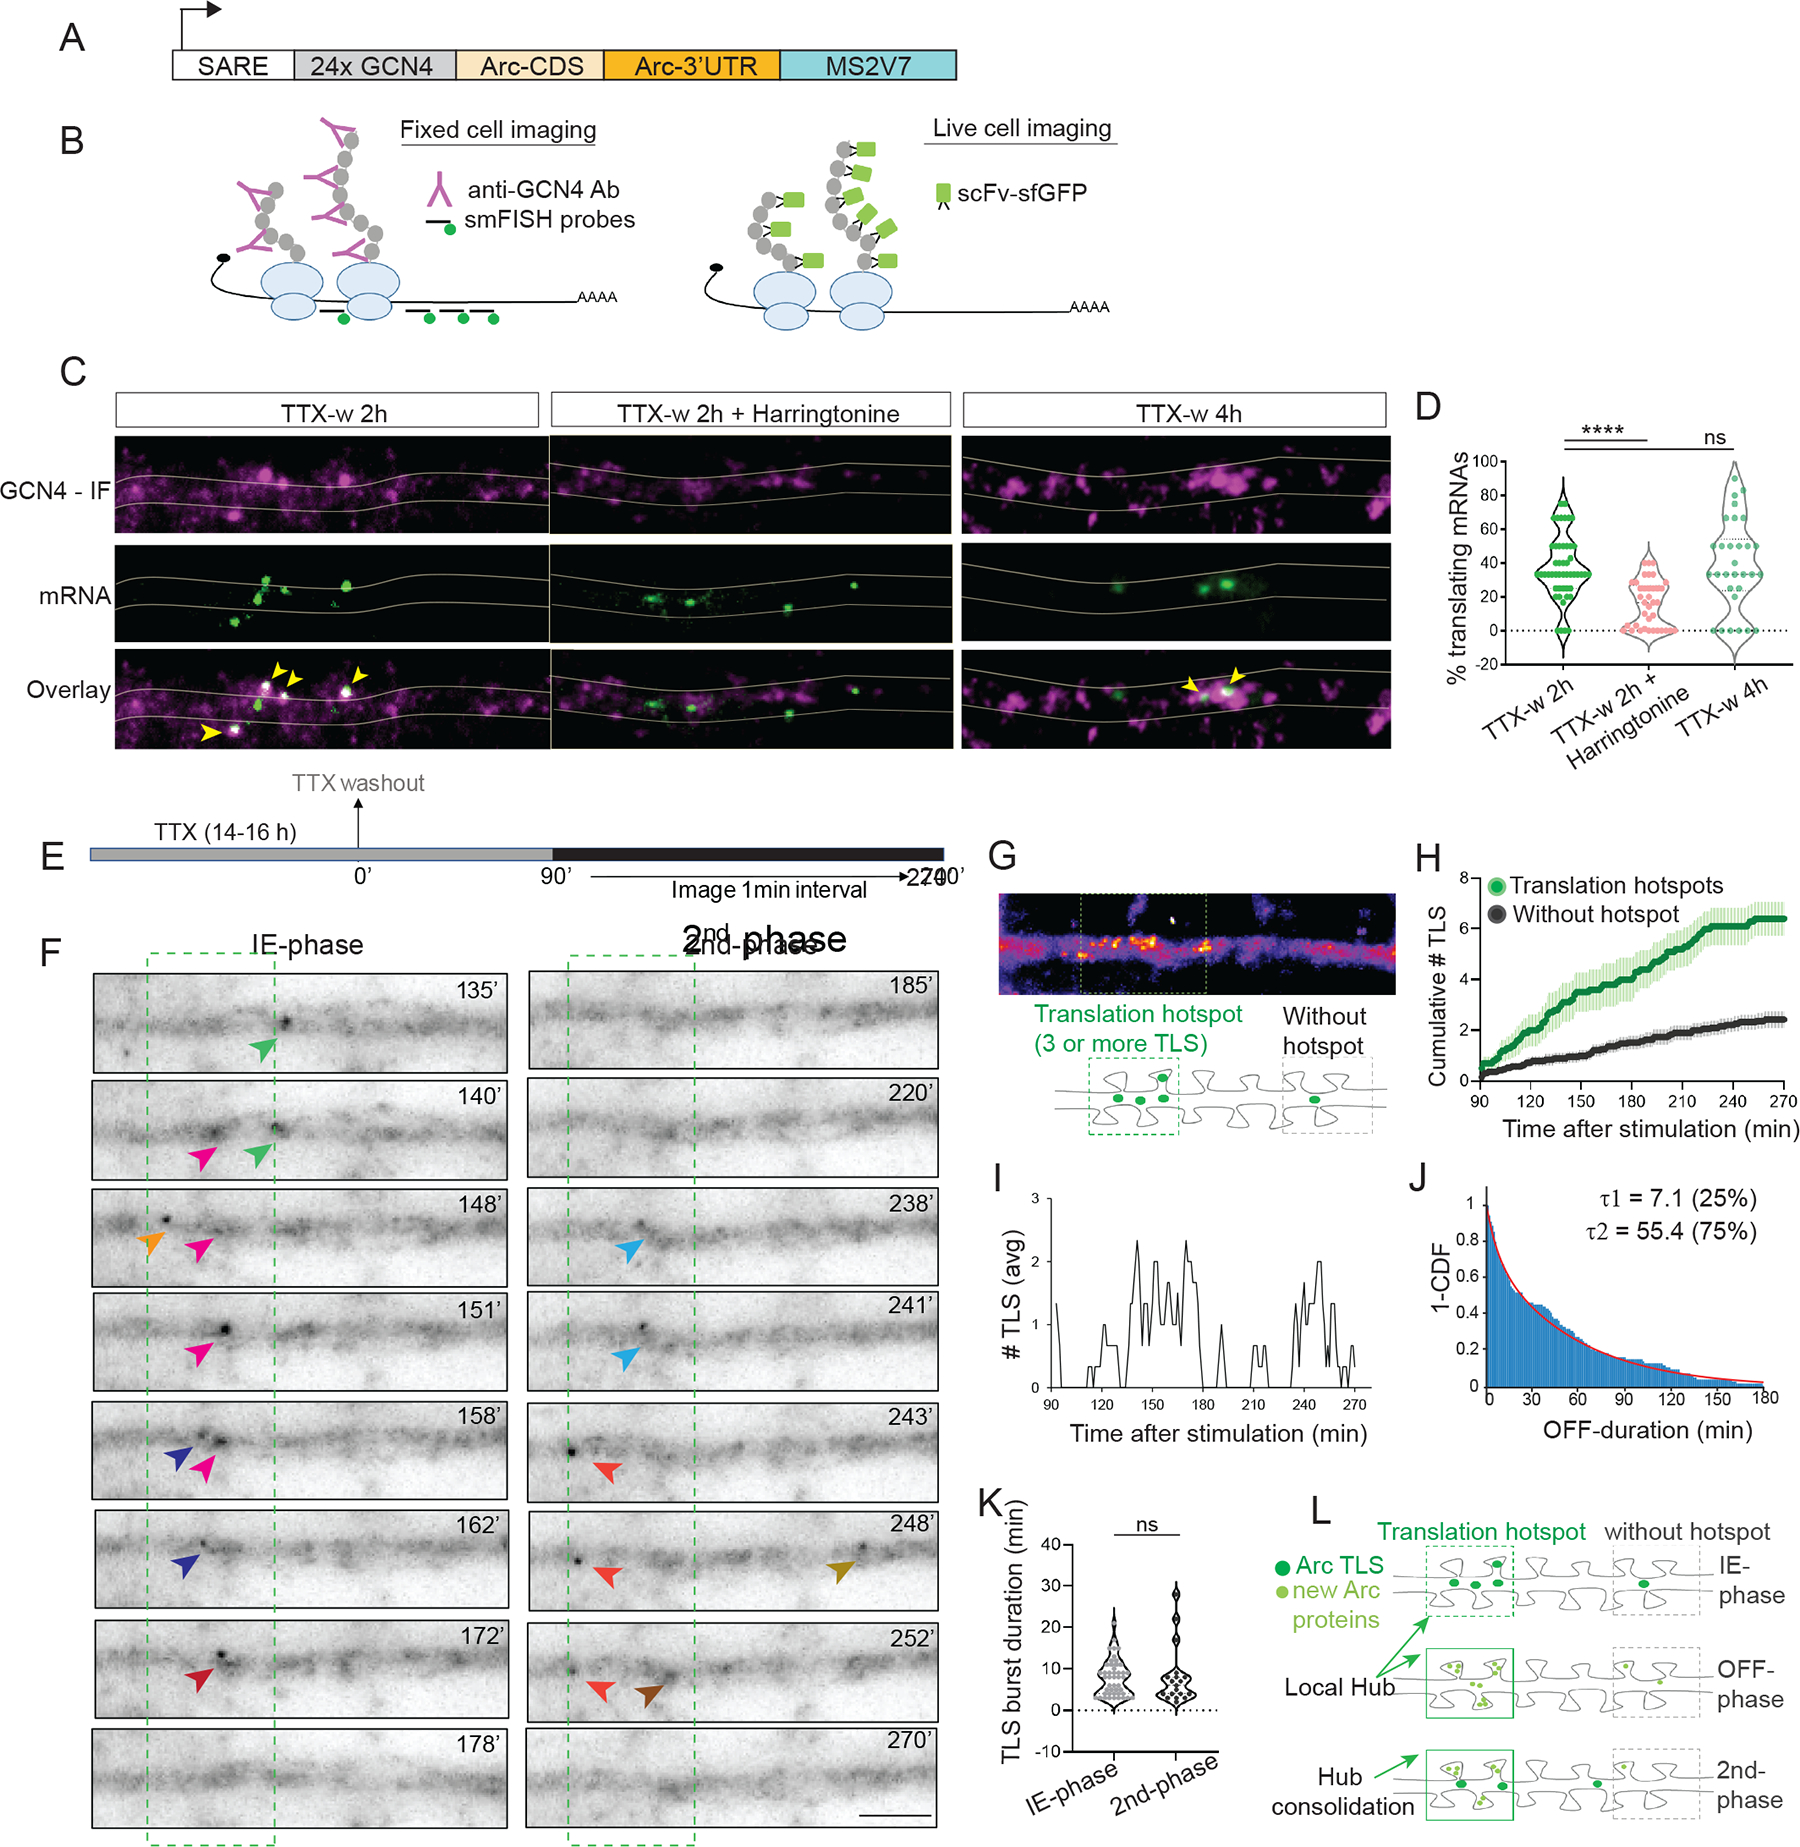
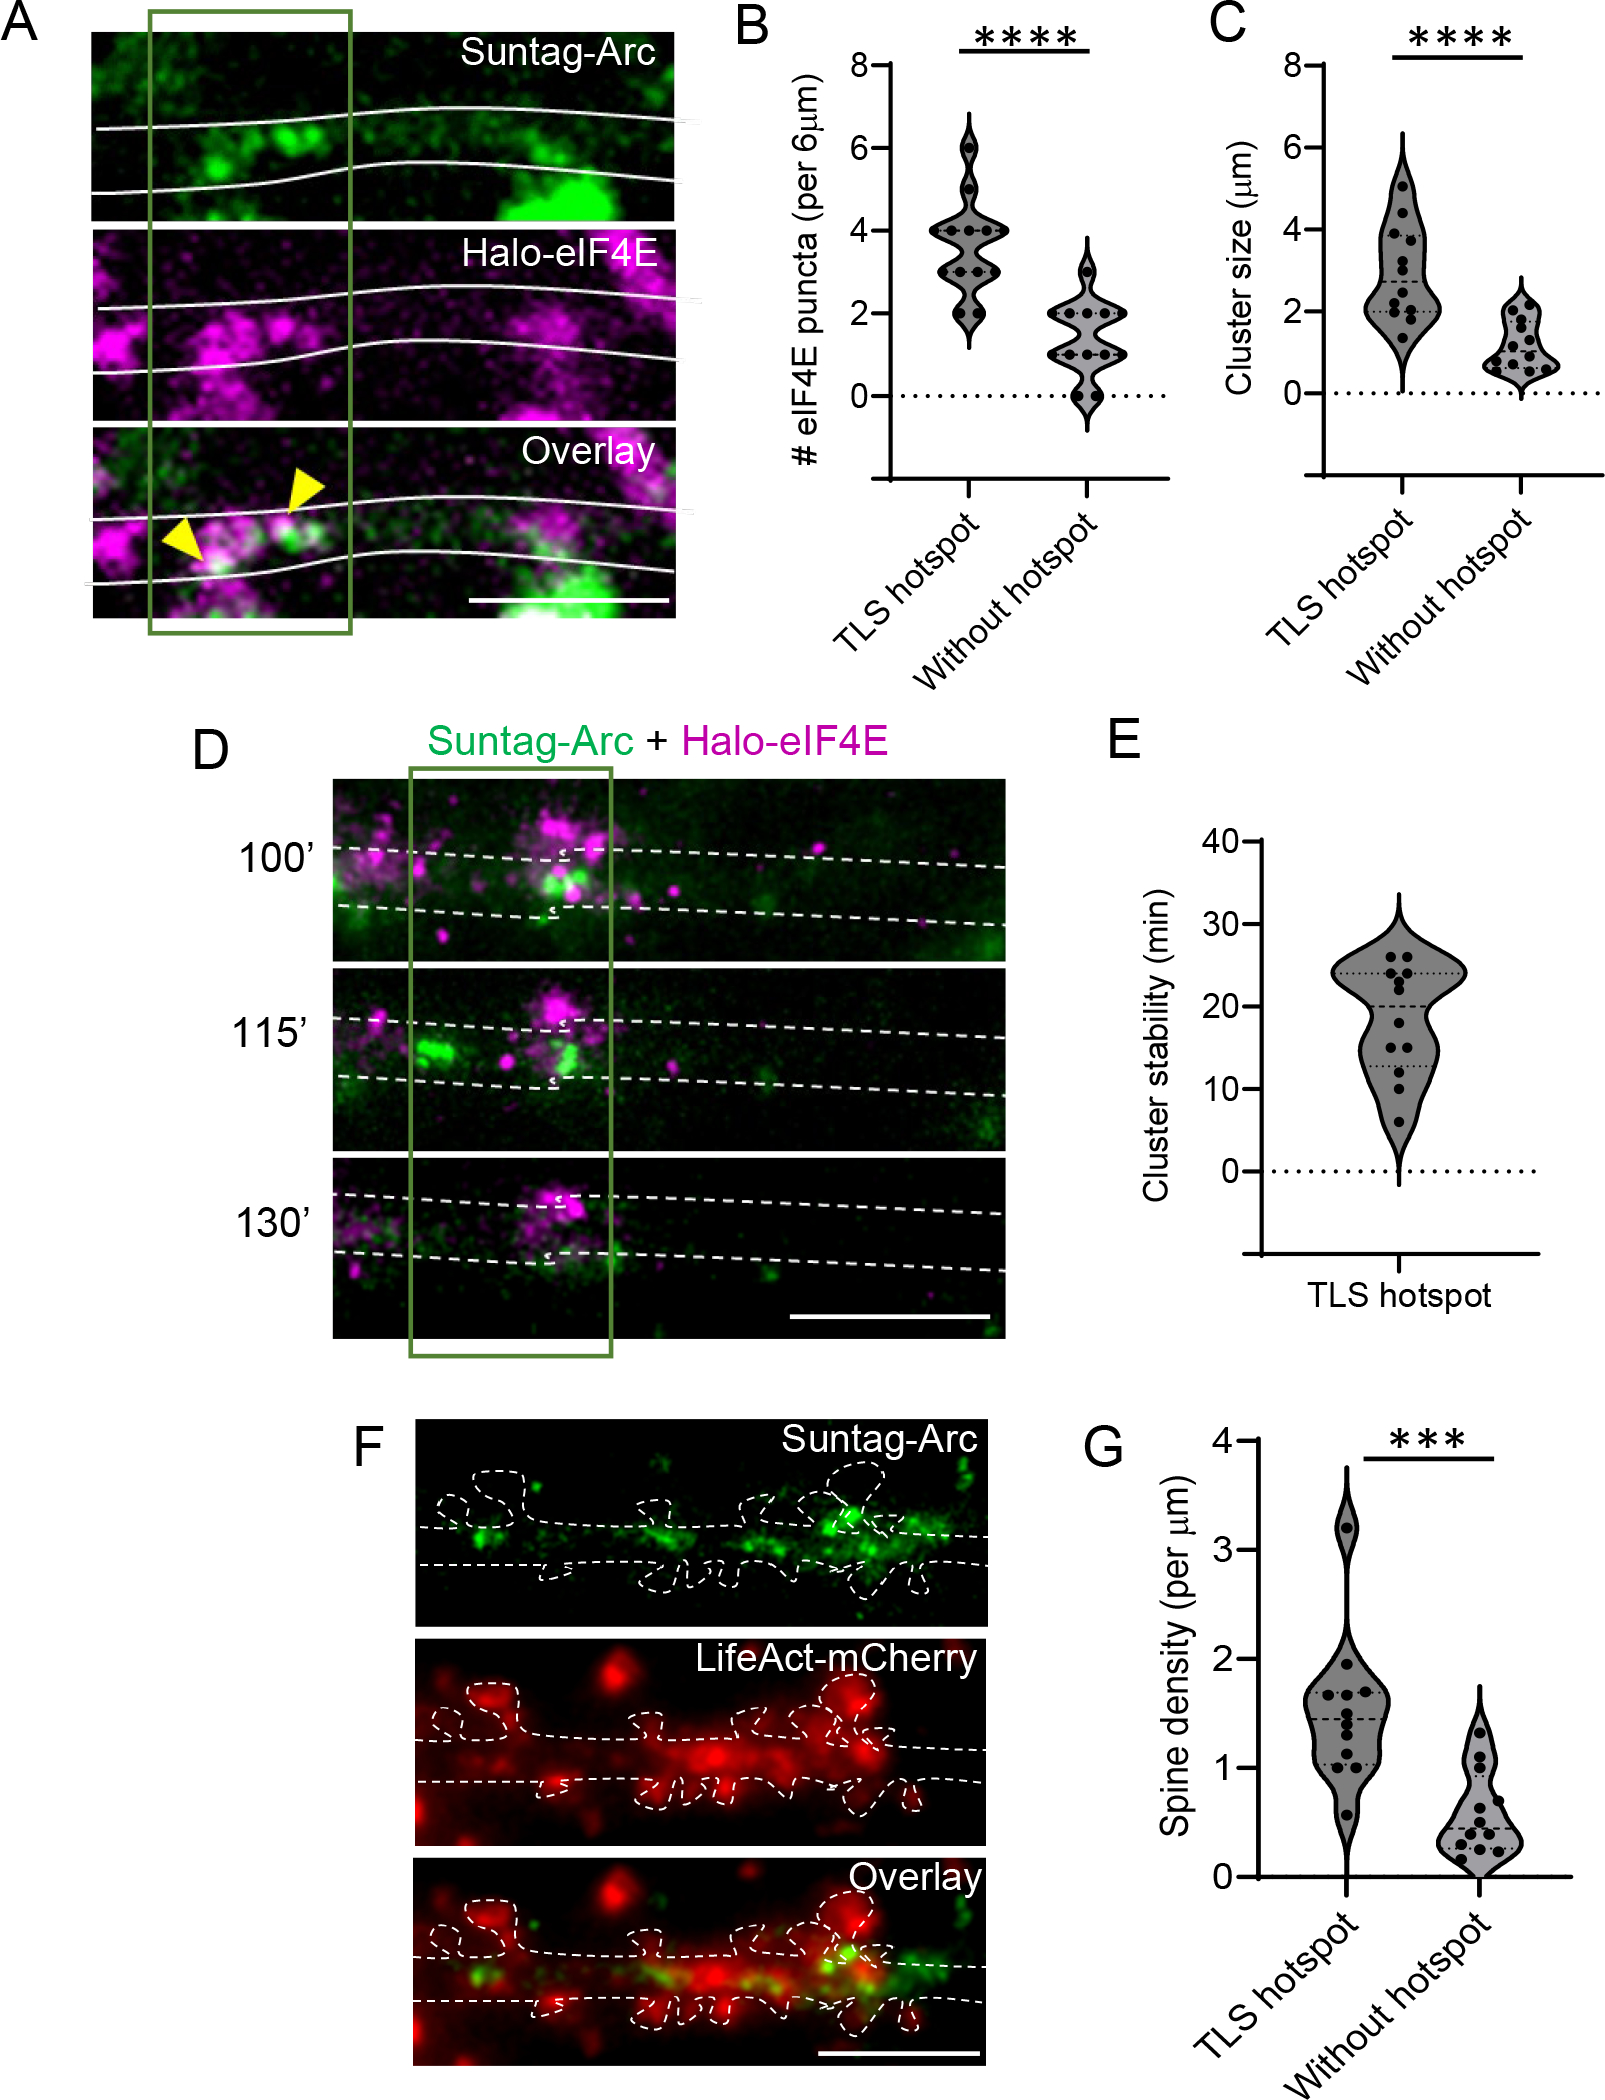
Activity-dependent expression of immediate early genes (IEGs) is critical for long-term synaptic remodeling and memory. It remains unknown how IEGs are maintained for memory despite rapid transcript and protein turnover. To address this conundrum, we monitored Arc, an IEG essential for memory consolidation. Using a knockin mouse where endogenous Arc alleles were fluorescently tagged, we performed real-time imaging of Arc mRNA dynamics in individual neurons in cultures and brain tissue. Unexpectedly, a single burst stimulation was sufficient to induce cycles of transcriptional reactivation in the same neuron. Subsequent transcription cycles required translation, whereby new Arc proteins engaged in autoregulatory positive feedback to reinduce transcription. The ensuing Arc mRNAs preferentially localized at sites marked by previous Arc protein, assembling a "hotspot" of translation, and consolidating "hubs" of dendritic Arc. These cycles of transcription-translation coupling sustain protein expression and provide a mechanism by which a short-lived event may support long-term memory.

Keywords: Arc; cyclical gene expression; immediate early genes; local translation; long-term memory; memory consolidation; protein hubs; single mRNA imaging; transcription; translation hotspots.


Conflict of interest statement

Declaration of interests The authors declare no competing interests.

Figures

Figure 1:
Figure 1:. Reactivation of Arc transcription drives subsequent transcription cycle.
(A) Representative images showing the PCP-GFP labeled nucleus of a single neuron. Arc transcribing alleles (yellow arrows) after evoked activity upon TTX-washout. (B) Intensity trace of the transcribing Arc allele in A. Solid line shows normalization to nuclear background. Dashed line indicates threshold for inclusion criteria as active transcription. (C) Average intensity trace of Arc transcription from multiple neurons. Shaded areas indicate active transcription (n= 58 neurons from 6 independent experiments). (D) Average intensity trace of β-actin transcription from MBS-tagged β-actin allele after TTX-w. Dashed line indicates threshold for inclusion criteria as active transcription. n = 22 cells from 3 independent experiments. (E) Heat map of transcription from individual Arc alleles after induction. Each column shows a single allele, and the rows represent time. Warmer colors indicate higher transcription amplitude. IE-activation is followed by shutdown (darker colors) and then reactivation (warmer colors). n = 37 alleles, 5 independent experiments. (F) Representative images showing IE- and reactivation of both Arc alleles albeit with different onset times. Arrows indicate transcribing alleles. (G) Frequency of reactivation from both alleles or from a single Arc allele (n = 45 neurons, 6 independent experiments, each circle represents one experiment). Scale bar is 5 μm. Error bars indicate SEM.
Figure 2:
Figure 2:. Cycles of Arc transcription in the dentate gyrus.
(A) Approach for Cre-dependent expression of PCP-GFP and ChIEF in the same neuron by injecting a cocktail of two viruses-CaMKIIα-Cre and DJ-FLEX-ChIEF-mCherry to the dentate gyrus of Arc-PBS x PCP-GFP mice. (B) Image showing co-expression of PCP-GFP and ChIEF-mCherry in the same granule cells of DG. (C) Stimulation paradigm for ChIEF (473nm) and two-photon imaging of GCs (910 nm illumination). (D) Representative images of two GC nuclei displaying transcription after optical stimulation. Orange outline shows neuron with transcriptional reactivation, green outline displays sustained activation. Scale bar 10 μm. (E) Total percentage of transcribing GC neurons after optical stimulation revealed two cycles (14.6 ± 2.2 % at 30 min, 9.7 ± 0.74 % at 150 min, 9.1 ± 0.9 % at 180 min, *** p = 0.003 at 30 min, *p = 0.01 at 150 min, *p= 0.04 at 180 min, compared to baseline 0 min, one-way ANOVA). (F) Distribution of the different transcriptional states during the second cycle (100 min post stimulation). n = 5 slices, 5 animals.
Figure 3:
Figure 3:. Reactivation of Arc transcription is independent of Ca2+ rise.
(A) Schematic of stimulation paradigm. (B-C) Neurons co-expressing red-shifted NLS-jRGECO1a and PCP-GFP were imaged for nuclear Ca2+ levels and Arc transcription. Nuclear CaTs triggered by TTX-w ceased after reapplying TTX (B). Imaging TS in the same neuron showed reactivation even after TTX addition (C). (D) Different transcriptional states after TTX reapplication in neurons activated in IE-phase (n = 43 neurons from 3 independent experiments). Delayed transcription induction was not observed. (E) Comparison of reactivation onset times (n = 20 neurons for TTX-w + TTX; 45 neurons for TTX-w, p = 0.24, unpaired t-test). Error bars indicate SEM. p > 0.05 non-significant. Scale bar 5μm.
Figure 4:
Figure 4:. Autoregulatory feedback by new protein synthesis reactivates Arc transcription.
(A) Schematic of stimulation paradigm to monitor the effect of protein synthesis. Inhibitor of protein synthesis (CHX, 50 μg/ml or Puromycin 50 μg/ml) was added at 90 min (TTX-w + CHX or TTX-w + Puro). In another set of experiments, inhibitor was incubated for 70 min and then washed out (TTX-w + CHX-w; TTX-w + Puro-w). (B) Representative images showing IE-transcription from both alleles, followed by shutdown maintained with CHX addition. Washout of CHX restored transcription. (C) Intensity trace of transcribing alleles from two conditions-CHX addition (TTX-w + CHX), and washout (TTX-w + CHX-w). (D) Percentage of reactivation across conditions, each circle represents one experiment (TTX-w vs TTX-w + CHX, TTX-w vs TTX-w + Puro **** p < 0.001; TTX-w vs TTX-w + CHX-w, * p = 0.02; TTX-w vs TTX-w + Puro-w, p = 0.98, two-way ANOVA; n = 21 neurons for TTX-w + CHX, n = 47 neurons for TTX-w + CHX-w, n = 26 neurons for TTX-w + Puro and TTX-w + Puro-w from 3 independent experiments, TTX-w from Figure 1E). (E) Frequency distribution of reactivation onset times after translation inhibitor washout (Median = 20 min for CHX-w, 31.5 min for Puro-w). (F) All-in one lentiviral construct used for Arc KD. (G) Representative images showing neurons expressing PCP-GFP with or without Cas9 + gRNA (mCherry). Note that the IE-transcription occurred in both neurons (arrows indicate TS). Neuron with Arc KD do not exhibit reactivation (after TTX reapplication at 90 min). (H) Quantification of transcriptional reactivation frequency (n = 26 neurons for control, n= 24 neurons for Arc KD from 4 independent experiments. * p = 0.03, paired t-test). Error bars represent SEM. **** denotes p < 0.001, * denotes p < 0.05. Scale bar 10μm.
Figure 5:
Figure 5:. Detection of Arc protein hubs in dendrites and accumulation of mRNAs in the hubs.
(A) Schematic of the Halo-Arc reporter to detect proteins from the two cycles. (B) PCP-GFP construct to visualize endogenous Arc mRNAs. A cocktail of lentiviruses expressing A and B was used to image Arc proteins and mRNAs in the same neuron. (C) Schematic of JF646/JF549 labeling timeline after stimulation. Arc mRNAs and proteins from the second cycle were imaged 3 hr onwards. (D-E) Representative image indicating dendritic Arc protein from first cycle (JF646). Differential intensity of JF646 signal shown in E. (F) Intensity profile of JF646 intensity showed distinct peaks along the dendrite. (G) A 6 μm segment around the local maxima in F was used to designate Arc protein hub from IE-stage (orange outline). A ROI of same dimension was used for a neighboring site (dashed outline). (H) Time lapse imaging of Arc proteins synthesized in the second phase (JF549). Bottom panel shows a merged image of JF549 with JF646, indicating close proximity of both puncta within the hub. (I) Single molecule imaging of Arc mRNAs in the same dendrite shows localization in the hub. Middle panel shows a kymograph, number of localized mRNAs indicated. (J) Normalized intensity trace of new Arc protein (JF549 signal) over time in hub versus neighboring site as defined in G. (K) Comparison of Arc mRNA counts populating the hubs vs neighboring sites (*** p = 0.002, Wilcoxon signed rank test). (L) Comparison of the residence times of Arc mRNAs in the hubs vs neighboring sites (* p = 0.029, unpaired t-test). n =12 neurons from 3 independent experiments (J, K). n = 43 mRNAs for hub versus n = 23 mRNAs for neighboring site (L). (M) Labeling scheme of Arc proteins after blocking the second transcription cycle with DRB. (N) Representative images show JF646 and JF549 label in the same dendrite. Lack of distinct JF549 puncta was observed with DRB treatment. (O) Normalized intensity trace of new Arc protein (JF549 signal) in the Arc hub versus in neighboring site. n =10 dendrites from 2 independent experiments. Scale bar is 6 microns. *** denotes p < 0.005, * denotes p < 0.05. Error bars represent SEM. Scale bar is 6 μm.
Figure 6:
Figure 6:. Long-term imaging of Arc translation reveals hotspots and biphasic dynamics
(A) Schematic of the Suntag-Arc translation reporter. The reporter is driven by SARE (activity-regulated promoter) and contains the 24X GCN4 epitopes (Suntag) upstream of the Arc CDS and followed by the 3′ UTR and stem loops MS2V7. (B) Translating mRNAs are detected by fixed-cell imaging with antibodies against GCN4 and by smFISH with probes against GCN4 and stem loop sequence. In live cells, translation sites (TLS) are detected by binding of the single chain antibody against GCN4 (scFV) fused to superfolder GFP (sfGFP). (C) Images of dendrites showing both nascent peptides and mRNAs in stimulated and after inhibition with Harringtonine. Co-localization of IF-smFISH spots indicate translating mRNAs (yellow arrows). (D) Comparison of translating mRNAs after stimulation and translation inhibition (TTX-w 2h vs TTX-w 2h + Harringtonine, **** p < 0.001, TTXw 2h vs TTXw 4h, p = 0.23, one-way ANOVA; n = 49 dendrites for TTX-w 2h, n = 34 dendrites for TTX-w 4h, n = 37 dendrites for TTX-w + Harringtonine from 2 independent experiments). (E) Stimulation and imaging paradigm to capture long-term dynamics of Arc TLS. (F) Time-lapse images from a dendrite show de novo Arc translation (arrows). Different colors represent different translation sites. Time was binned into two 90 min segments to represent IE (90–180 min) and second (181–270 min) phase. (G) A time-projected image of (F) shows spatial clustering of TLS to form a translation hotspot. Schematic in lower panel shows inclusion criterion for a hotspot. (H) Cumulative TLS count in hotspots versus regions without hotspots (n = 20 dendrites, 3 independent experiments). (I) Average TLS counts show biphasic dynamics. (J) Inverse cumulative distribution of time duration without de novo translation (OFF-period) fitted to a 2-component exponential. Relative percentage of events in τ1, τ2 indicated (n = 90 events). (K) Duration of each translation event during the IE and second phase (p = 0.5, Kolmogorov-Smirnov test, n= 46 events in IE, n=20 events in second phase). (L) Proposed model of Arc hub formation and maintenance by local translation in the hotspots. Arc translation in hotspots (IE-phase) increases local protein density to form the “hubs”. During the OFF-phase, translation is low due to limited mRNA availability. Transcriptional reactivation supplies new mRNAs, which visit the hubs resulting in a second translation phase, thereby consolidating the hub. Error bars indicate SEM. **** denotes p < 0.001, * denotes p < 0.05, ns for p > 0.05.
Figure 7:
Figure 7:. Arc translation hotspots display clustering of eIF4E and situated in dendritic regions with high spine density
(A) Representative image showing de novo Arc translation (green) and JF646-labeled Halo-eIF4E (magenta). Arrows indicate co-localization. Dark green outline indicates the TLS hotspot, with evident clustering of Halo-eIF4E. (B - C) Comparison of eIF4E puncta number (B) and the total size of eIF4E clusters (C) in the TLS hotspot versus a neighboring non-hotspot dendritic region (p < 0.001, paired t-test, n= 12 dendrites from 4 experiments). (D) Time-lapse images from a dendrite with overlay of Arc TLS (green) and JF646-labeled Halo-eIF4E (magenta) post stimulation (min). Images time-averaged for 5 min. (E) Stability of Halo-eIF4E cluster in the hotspot measured as persistence time (min). (F) Image of a dendritic segment and associated spines (red, LifeAct - mCherry) showing Arc TLS clustering (green puncta) in regions with high spine density. (G) Quantification of spine density in TLS hotspot versus neighboring region without hotspot (p = 0.001, paired t-test, n =12 dendrites from 3 experiments). Scale bar is 6 microns. ***p < 0.005, **** denotes p < 0.001.

References

    1. Asok A, Leroy F, Rayman JB, and Kandel ER (2019). Molecular Mechanisms of the Memory Trace. Trends in neurosciences 42, 14–22. 10.1016/j.tins.2018.10.005. - DOI - PMC - PubMed
    1. Bailey CH, Kandel ER, and Harris KM (2015). Structural Components of Synaptic Plasticity and Memory Consolidation. Cold Spring Harbor perspectives in biology 7, a021758. 10.1101/cshperspect.a021758. - DOI - PMC - PubMed
    1. Alberini CM, and Kandel ER (2014). The regulation of transcription in memory consolidation. Cold Spring Harbor perspectives in biology 7, a021741. 10.1101/cshperspect.a021741. - DOI - PMC - PubMed
    1. Wang DO, Kim SM, Zhao Y, Hwang H, Miura SK, Sossin WS, and Martin KC (2009). Synapse- and stimulus-specific local translation during long-term neuronal plasticity. Science 324, 1536–1540. 10.1126/science.1173205. - DOI - PMC - PubMed
    1. Richter JD, and Klann E (2009). Making synaptic plasticity and memory last: mechanisms of translational regulation. Genes Dev 23, 1–11. 10.1101/gad.1735809. - DOI - PubMed

Publication types

Substances

LinkOut - more resources