. 2023 Jun 6;35(6):1057-1071.e12.
doi: 10.1016/j.cmet.2023.04.003. Epub 2023 Apr 25.

Integrative genetic analysis identifies FLVCR1 as a plasma-membrane choline transporter in mammals

Affiliations

Integrative genetic analysis identifies FLVCR1 as a plasma-membrane choline transporter in mammals

Timothy C Kenny et al. Cell Metab. .

Abstract

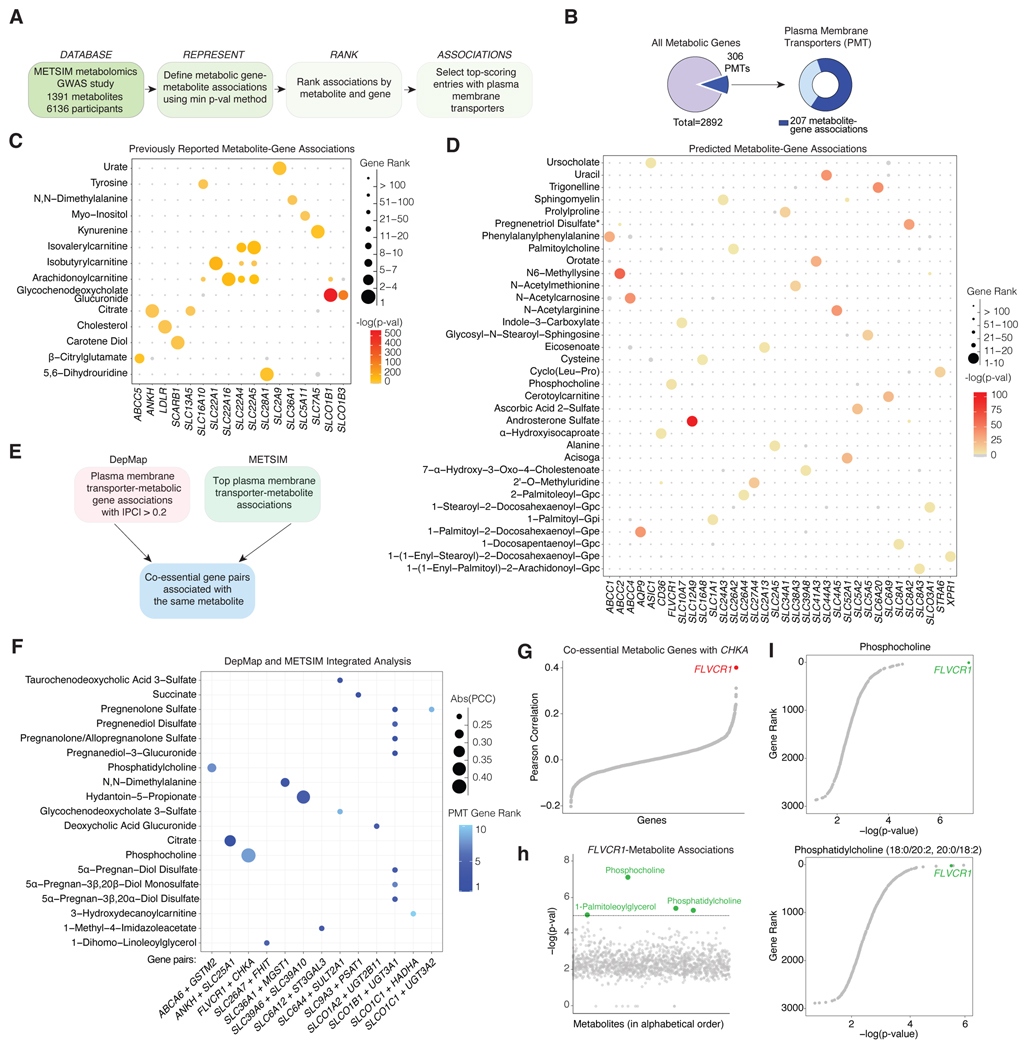
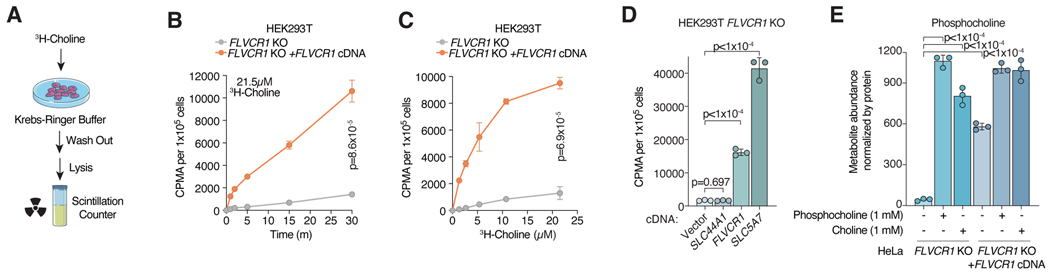
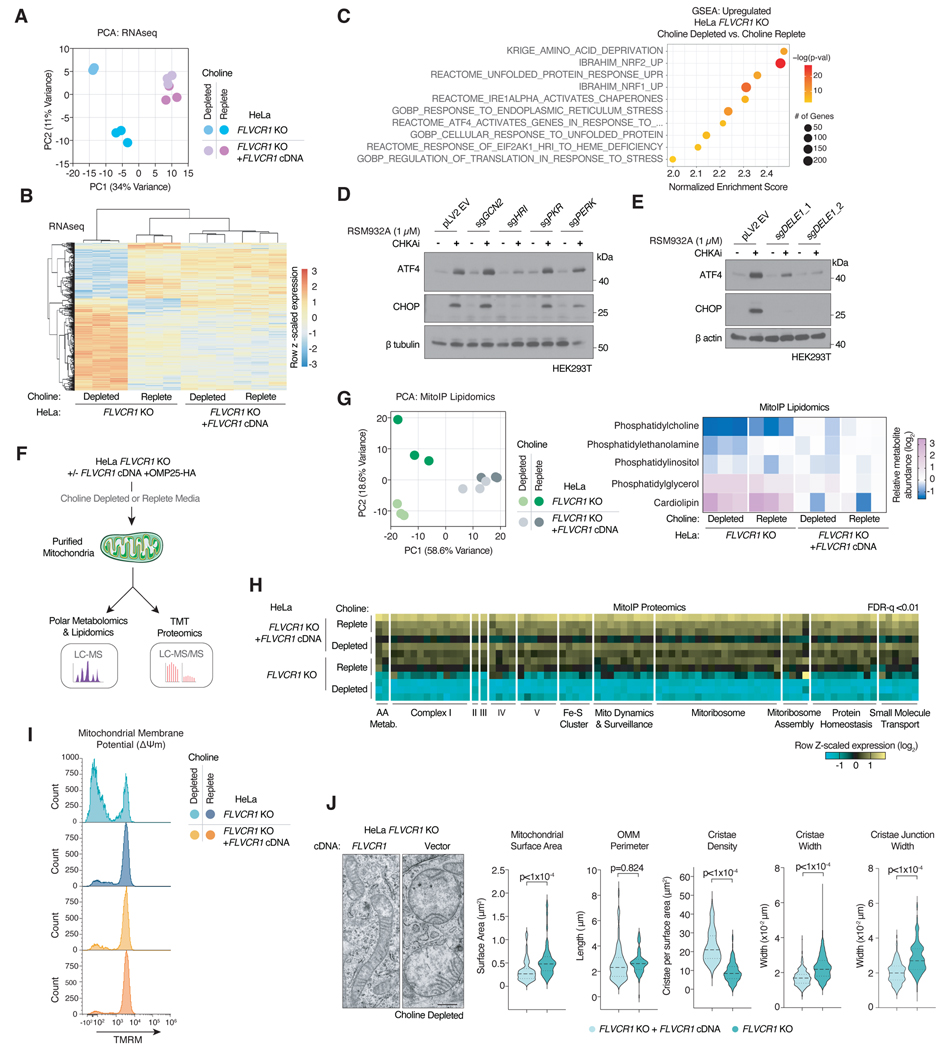
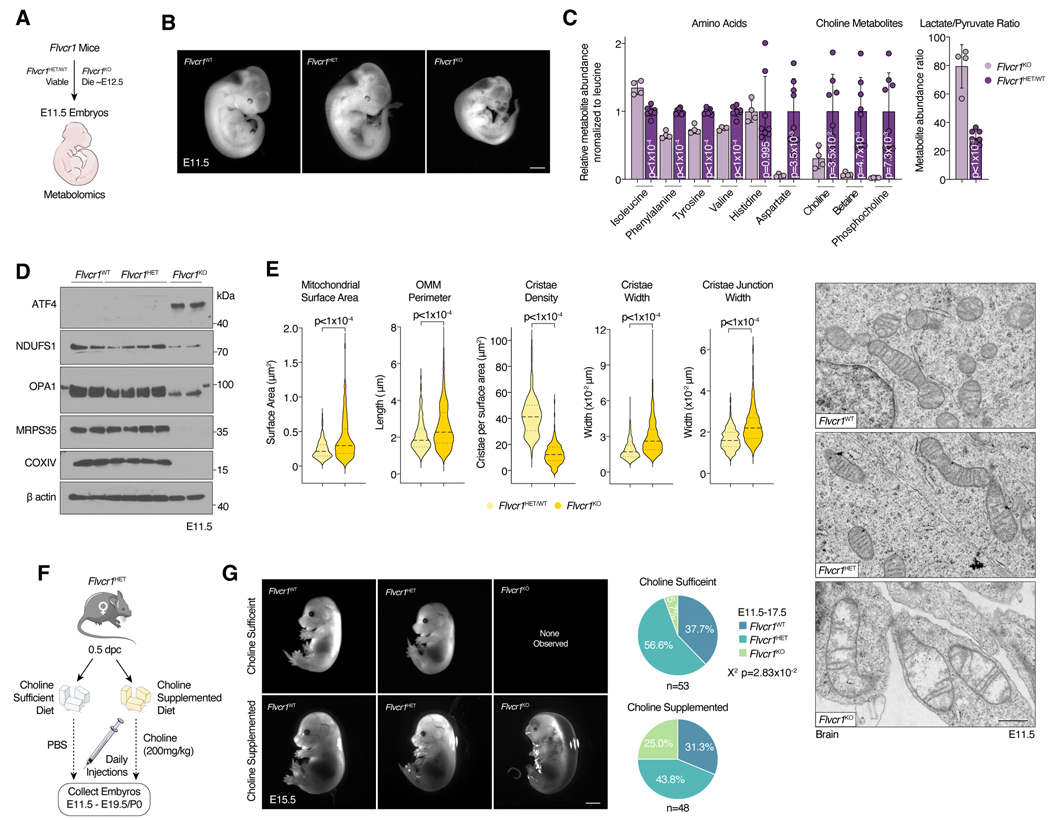
Genome-wide association studies (GWASs) of serum metabolites have the potential to uncover genes that influence human metabolism. Here, we combined an integrative genetic analysis that associates serum metabolites to membrane transporters with a coessentiality map of metabolic genes. This analysis revealed a connection between feline leukemia virus subgroup C cellular receptor 1 (FLVCR1) and phosphocholine, a downstream metabolite of choline metabolism. Loss of FLVCR1 in human cells strongly impairs choline metabolism due to the inhibition of choline import. Consistently, CRISPR-based genetic screens identified phospholipid synthesis and salvage machinery as synthetic lethal with FLVCR1 loss. Cells and mice lacking FLVCR1 exhibit structural defects in mitochondria and upregulate integrated stress response (ISR) through heme-regulated inhibitor (HRI) kinase. Finally, Flvcr1 knockout mice are embryonic lethal, which is partially rescued by choline supplementation. Altogether, our findings propose FLVCR1 as a major choline transporter in mammals and provide a platform to discover substrates for unknown metabolite transporters.

Keywords: FLVCR1; PCARP; choline; metabolism; mitochondria; phosphatidylcholine.


Conflict of interest statement

Declaration of interests K.B. is scientific advisor to Nanocare Pharmaceuticals and Atavistik Bio.

Figures

Figure 1.
Figure 1.. An integrative genetic analysis associates serum metabolites to membrane transporters in humans.
a) Schematic showing the pipeline for the METSIM analysis. b) Summary of the METSIM analysis of 2892 metabolic genes queried for metabolite associations. Pie chart representing the number of plasma membrane transporters (PMT) for which a metabolite association was found c) Bubble plot of top-scoring metabolite-PMT associations previously reported. d) Bubble plot of undescribed metabolite-PMT associations for which the PMT had only a single significant metabolite association. Bubble color corresponds to the -log(p-val) of the association between the indicated metabolite and PMT. Bubble size represents the rank of the gene (ordered by -log(p-val) across all the analyzed metabolic genes with 1 corresponding the strongest association for the corresponding metabolite. e) Schematic showing the workflow of the integrated METSIM and DEPMAP analysis. f) Bubble plot of the integrated analysis of DepMAP and METSIM datasets. Data shown are the co-essential gene pairs with the absolute value of Pearson Correlation Coefficient (|PC|) > 0.2 computed from DepMAP CRISPR Chronos Scores that share a significant metabolite based on METSIM analysis. Bubble size represents |PC|. Bubble color corresponds to the rank of PTM for the corresponding metabolite. g) Pearson Correlation between CHKA and metabolic genes computed from CRISPR DepMAP Chronos. h) METSIM metabolite-FLVCR1 associations displayed as log(p-val) of the top-scoring marker for the given metabolite within the defined FLVCR1 genomic region vs. metabolites in alphabetical order. The dotted line indicates the significance threshold of -log(p-val) = 5. i) Associations between metabolic genes and phosphocholine or phosphatidylcholine (18:0/20:2, 20:0/18:2). Data are plotted as metabolic gene rank for the given metabolite vs. -log(p-val) of the top-scoring marker of the metabolite within the defined gene region.
Figure 2.
Figure 2.. FLVCR1 loss impairs choline metabolism in human cells
a) Volcano plot showing the log2 fold change in metabolite abundance versus -log10(q value) from FLVCR1-knockout HEK293T and HeLa cells expressing a vector control or FLVCR1 cDNA cultured in choline depleted media for 24 hours. The dotted line indicates the significance threshold of FDR q<1% (-log10(q value) = 2). Statistical significance was determined by multiple two-tailed unpaired t-tests with discovery determined using the Two-stage linear step-up procedure of Benjamini, Krieger and Yekutieli. b) Molecular structure of choline and schematic for tracing of [1,2-13C2]Choline into downstream metabolites. Metabolite abundance of c) phosphocholine, d) betaine and e) glycerophosphocholine after incubation with [1,2-13C2]Choline for the indicated timepoints in FLVCR1-knockout HEK293T cells expressing a control vector or FLVCR1 cDNA. Bars represent mean ± standard deviation; n = 3. Statistical significance determined by two-tailed unpaired t-test and displayed p-values compare M+2 metabolite abundance between FLVCR1 KO and FLVCR1 KO +FLVCR1 cDNA at corresponding timepoints. f) Lipidomics analysis of FLVCR1-knockout HEK293T cells expressing a control vector or FLVCR1 cDNA cultured in choline depleted media for 24 hours. Dot plot of individual lipid species of FLVCR1-knockout cells relative to FLVCR1 KO +FLVCR1 cDNA cells and grouped by lipid class – phosphatidylcholine (PC), phosphatidylethanolamine (PE), phosphatidylserine (PS), and triglyceride (TG). Dotted line represents lipid species abundance of FLVCR1 KO +FLVCR1 cDNA cells. Median log2 fold change of FLVCR1 KO cells denoted by black line for each lipid class; n = 3. g) LipidTOX staining of FLVCR1-knockout HEK293T cells expressing a control vector or FLVCR1 cDNA. Scale bar = 5μm. Violin plot showing quantification of mean fluorescence intensity per cell. Statistical significance was determined by two-tailed unpaired t-test. n = 28 cells FLVCR1 KO; n = 39 cells FLVCR1 KO +FLVCR1 cDNA.
Figure 3.
Figure 3.. FLVCR1 mediates choline import in mammalian cells.
a) Schematic for radioactive choline uptake assays using 3H-choline. b) Uptake of [Methyl-3H]-Choline in FLVCR1-knockout HEK293T cells expressing a vector control or FLVCR1 cDNA incubated for indicated timepoint. Data represented as mean ± standard deviation and normalized by seeded cell number; n = 3. Statistical significance was determined by multiple two-sided unpaired t-tests with correction for multiple comparisons using the Holm-Sidak method. t=1 minute p=1.3×10⁻³; t =2 minutes p=2.3×10⁻⁵, t=5 minutes, 15 minutes, and 30 minutes p<1×10⁻⁶. c) Uptake of [Methyl-3H]-Choline in FLVCR1-knockout HEK293T cells expressing a vector control or FLVCR1 cDNA incubated with indicated dose for 30 minutes. Data represented as mean ± standard deviation and normalized by seeded cell number; n = 3. Statistical significance was determined by multiple two-sided unpaired t-tests with correction for multiple comparisons using the Holm-Sidak method. 1.34μM p=6×10⁻⁶; 2.69μM, 5.38μM, 10.75μM, and 21.5μM p<1×10⁻⁶. d) Uptake of 21.5μM [Methyl-3H]-Choline in FLVCR1-knockout HEK293T cells expressing an empty vector (EV) control, SLC44A1, FLVCR1, or SLC5A7 cDNA for 30 minutes. Data represented as mean ± standard deviation and normalized by seeded cell number; n = 3. Statistical significance determined by two-tailed unpaired t-test. e) Phosphocholine abundance in FLVCR1-knockout HeLa cells expressing a vector control or FLVCR1 cDNA after incubation with 1mM phosphocholine or 1mM choline for 24 hours. Bars represent mean ± standard deviation; n = 3. Statistical significance determined by two-tailed unpaired t-test.
Figure 4.
Figure 4.. Metabolic pathways that compensate for FLVCR1 loss.
a) Log2 fold change in cell number of FLVCR1-knockout HeLa cells expressing a vector control or FLVCR1 cDNA grown in choline depleted or choline replete media supplemented with 1% dialyzed FBS (dFBS). Bars represent mean ± standard deviation; n = 6. Statistical significance determined by two-tailed unpaired t-test. b) Schematic of the metabolism-focused CRISPR genetic screens in FLVCR1-knockout HEK293T cells expressing a vector control or FLVCR1 cDNA cultured with or without 1mM choline supplementation. c) CRISPR gene scores in FLVCR1-knockout HEK293T cells expressing a vector control (y-axis) or FLVCR1 cDNA (x-axis). Top scoring hits color coded and previously reported potential choline transporters highlighted in gray. Pearson correlation coefficient, two-sided. d) CRISPR gene scores in FLVCR1-knockout HEK293T cells expressing a vector control and supplemented with 1mM choline (y-axis) or FLVCR1 cDNA (x-axis). Pearson correlation coefficient, two-sided. e) Comparison of gene score ranks from CRISPR screens. FLVCR1-knockout HEK293T cells expressing a vector control vs. FLVCR1 cDNA (x-axis) and FLVCR1-knockout HEK293T cells expressing a vector control grown with or without 1mM choline supplementation (y-axis). f) Individual sgRNA scores targeting FLVCR2, PCYT1A, CHKA, or PCTY2 in FLVCR1-knockout HEK293T cells expressing a vector control (color) or FLVCR1 cDNA (black). G) Phylogenetic tree of FLVCR1 homologs across model organisms (derived from TreeFam). h) Phosphocholine abundance in FLVCR1-knockout HEK293T cells expressing an empty vector control, SLC44A1, FLVCR2, FLVCR1, or SLC5A7 cDNA. Bars represent mean ± standard deviation; n = 3. Statistical significance determined by two-tailed unpaired t-test. i) Phosphocholine abundance in FLVCR1-knockout HEK293T cells expressing an empty vector control, FLVCR1, or CG1358 cDNA. Bars represent mean ± standard deviation; n = 3. Statistical significance determined by two-tailed unpaired t-test. j) Schematic of phospholipid synthesis reactions and salvage pathway. Scoring genes from CRISPR screens which are essential in FLVCR1-knockout cells and rescued with choline supplementation are highlighted with color.
Figure 5.
Figure 5.. FLVCR1-mediated choline uptake is required for mitochondrial homeostasis.
a) Principal component analysis (PCA) of RNA-Seq from FLVCR1-knockout HeLa cells expressing a vector control or FLVCR1 cDNA cultured in choline depleted or choline replete media for 24 hours. b) Heat map of differentially expressed genes from RNA-Seq of FLVCR1-knockout HeLa cells expressing a vector control or FLVCR1 cDNA cultured in choline depleted or choline replete media for 24 hours. c) Gene set enrichment analysis (GSEA) of significantly upregulated transcripts in FLVCR1-knockout HeLa cells expressing an empty vector control in choline depleted media vs. FLVCR1-knockout HeLa cells + FLVCR1 cDNA in choline depleted media. d) Immunoblotting of indicated proteins in HEK293T cells expressing an empty vector control (pLV2 EV) or sgRNA targeting GCN2, HRI, PKR, or PERK and treated with CHKA inhibitor RSM932A (1μM) or vehicle for 24 hours. e) Immunoblotting of indicated proteins in HEK293T cells expressing an empty vector control (pLV2 EV) or two different sgRNA targeting DELE1 and treated with CHKA inhibitor RSM932A (1μM) or vehicle for 24 hours. f) Schematic for proteomic and polar metabolomic/lipidomic profiling of mitochondria from FLVCR1-knockout HeLa cells expressing an empty vector control or FLVCR1 cDNA and after extended culture in choline depleted and replete conditions. g) Principal component analysis (PCA) of mitochondrial lipidomics from FLVCR1-knockout HeLa cells expressing a vector control or FLVCR1 cDNA. Heatmap of mitochondrial lipid species. h) Heatmap of most differentially expressed mitochondrial proteins organized by ontology from FLVCR1-knockout HeLa cells expressing a vector control or FLVCR1 cDNA cultured in choline depleted or choline replete media. Statistical significance was determined by an ANOVA test with a permutation-based FDR q<1% considered significant. i) Flow cytometry of mitochondrial membrane potential (ΔΨm) as measured by TMRM in FLVCR1-knockout HeLa cells expressing an empty vector control or FLVCR1 cDNA and after extended culture in choline depleted and replete conditions. j) Representative electron micrographs of the mitochondria of FLVCR1-knockout HeLa cells expressing an empty vector control or FLVCR1 cDNA after extended culture in choline depleted conditions (Left). Scale bar = 0.5μm. Violin plots of mitochondrial surface area, outer mitochondrial membrane (OMM) perimeter, cristae density, cristae width, and cristae junction width calculated from electron micrographs. Statistical significance was determined by two-tailed unpaired t-test. n = 107 mitochondria, n = 444 cristae, n = 255 cristae junctions FLVCR1 KO cells; n = 68 mitochondria, n = 303 cristae, n = 183 cristae junctions FLVCR1 KO +FLVCR1 cDNA cells.
Figure 6.
Figure 6.. Flvcr1 mediated choline transport is essential for murine development
a) Schematic of Flvcr1 mice used for whole embryo metabolomics. b) Representative images of embryos of indicated genotypes at E11.5. Scale bar = 1mm. c) Metabolite levels or ratio normalized by endogenous leucine between Flvcr1KO (n = 4) and Flvcr1HET (n = 6) plus Flvcr1WT (n = 2) E11.5 embryos. Bars represent mean ± standard deviation. Statistical significance determined by two-tailed unpaired t-test. d) Immunoblotting of indicated proteins in Flvcr1WT, Flvcr1HET, and Flvcr1KO whole E11.5 embryos. e) Violin plots of mitochondrial surface area, outer mitochondrial membrane (OMM) perimeter, cristae density, cristae width, and cristae junction width calculated from electron micrographs. Statistical significance was determined by two-tailed unpaired t-test. Flvcr1WT (n = 2) and Flvcr1HET (n = 1) embryos: n = 143 mitochondria, n = 662 cristae, n = 287 cristae junctions. Flvcr1KO (n = 2) embryos: n = 134 mitochondria, n = 535 cristae, n = 378 cristae junctions. Representative electron micrographs of the mitochondria of the brain of E11.5 embryos of indicated genotypes (Right). Scale bar = 0.5μm. f) Schematic of supplementation experiments performed on Flvcr1HET females at 0.5 days post coitus (dpc) with Flvcr1HET males and analysis of embryos E11.5-E19.5/P0. g) Representative images of embryos of indicated genotypes treated with choline sufficient or choline supplemented diets and injections at E15.5. Scale bar = 2.5mm. Pie charts displaying the genotypes of embryos collected E11.5–17.5 from choline sufficient or choline supplemented groups. Choline sufficient n = 53 embryos; Choline supplemented n = 48embryos. Chi-square test.

Comment in

References

    1. Neal B., Perkovic V., Mahaffey KW., de Zeeuw D., Fulcher G., Erondu N., Shaw W., Law G., Desai M., and Matthews DR. (2017). Canagliflozin and Cardiovascular and Renal Events in Type 2 Diabetes. New England Journal of Medicine 377, 644–657. 10.1056/NEJMOA1611925/SUPPL_FILE/NEJMOA1611925_DISCLOSURES.PDF. - DOI - PubMed
    1. Mann JJ (2005). The Medical Management of Depression. - PubMed
    1. César-Razquin A, Snijder B, Frappier-Brinton T, Isserlin R, Gyimesi G, Bai X, Reithmeier RA, Hepworth D, Hediger MA, Edwards AM, et al. (2015). A Call for Systematic Research on Solute Carriers. Cell 162, 478–487. 10.1016/J.CELL.2015.07.022. - DOI - PubMed
    1. Yin X, Chan LS, Bose D, Jackson AU, VandeHaar P, Locke AE, Fuchsberger C, Stringham HM, Welch R, Yu K, et al. (2022). Genome-wide association studies of metabolites in Finnish men identify disease-relevant loci. Nature Communications 2022 13:1 13, 1–14. 10.1038/s41467-022-29143-5. - DOI - PMC - PubMed
    1. Goldstein JL, and Brown MS (1974). Binding and Degradation of Low Density Lipoproteins by Cultured Human Fibroblasts: COMPARISON OF CELLS FROM A NORMAL SUBJECT AND FROM A PATIENT WITH HOMOZYGOUS FAMILIAL HYPERCHOLESTEROLEMIA. Journal of Biological Chemistry 249, 5153–5162. 10.1016/S0021-9258(19)42341-7. - DOI - PubMed

Publication types