. 2023 Jul:111:277-291.
doi: 10.1016/j.bbi.2023.04.008. Epub 2023 Apr 24.

Conserved and cell type-specific transcriptional responses to IFN-γ in the ventral midbrain

Affiliations

Conserved and cell type-specific transcriptional responses to IFN-γ in the ventral midbrain

Benjamin D Hobson et al. Brain Behav Immun. 2023 Jul.

Abstract

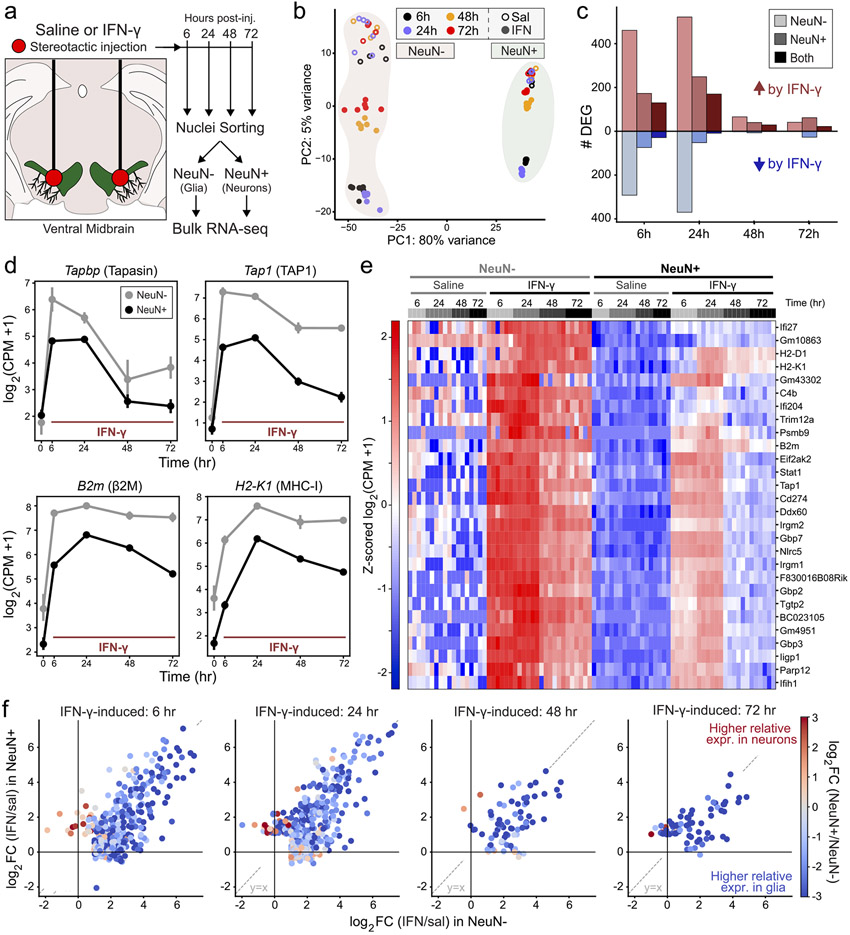
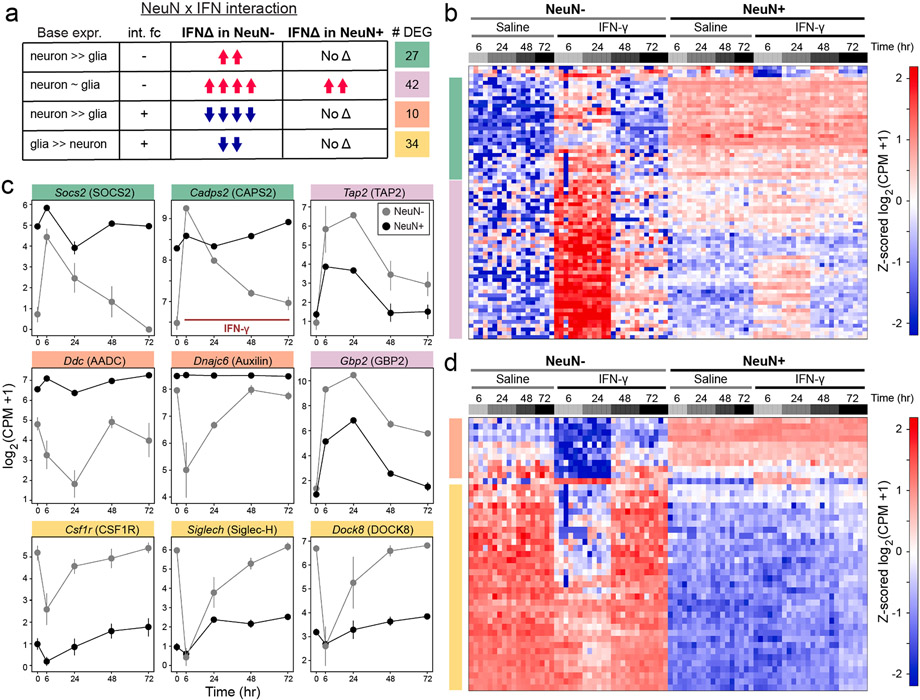
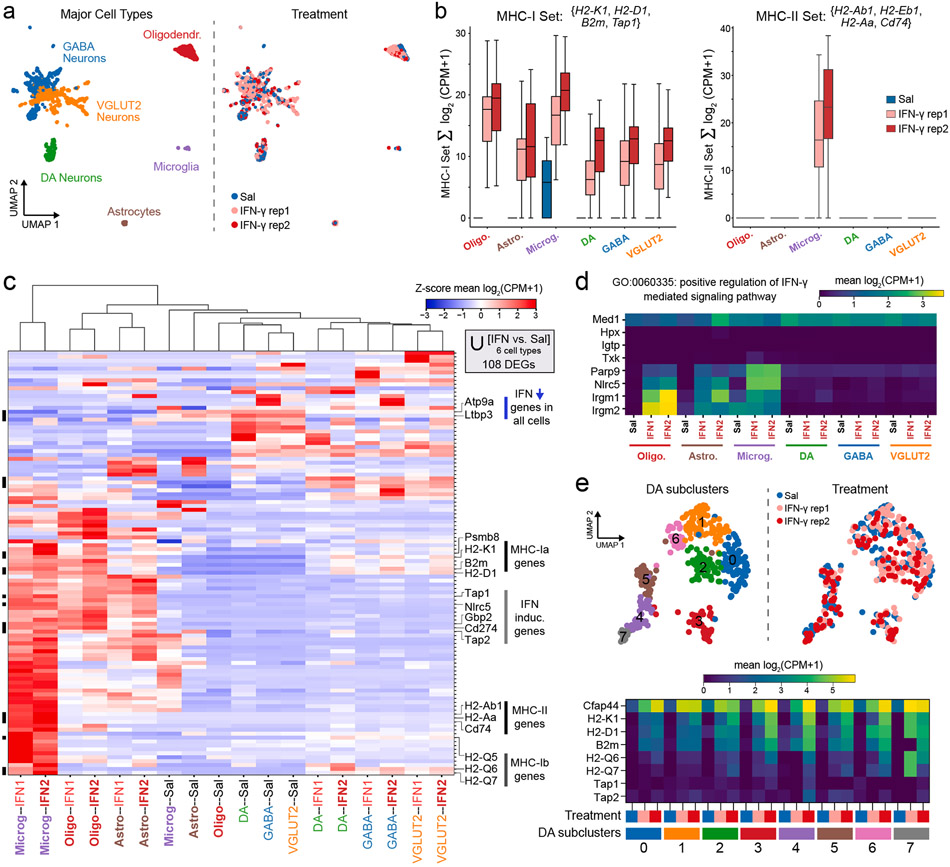
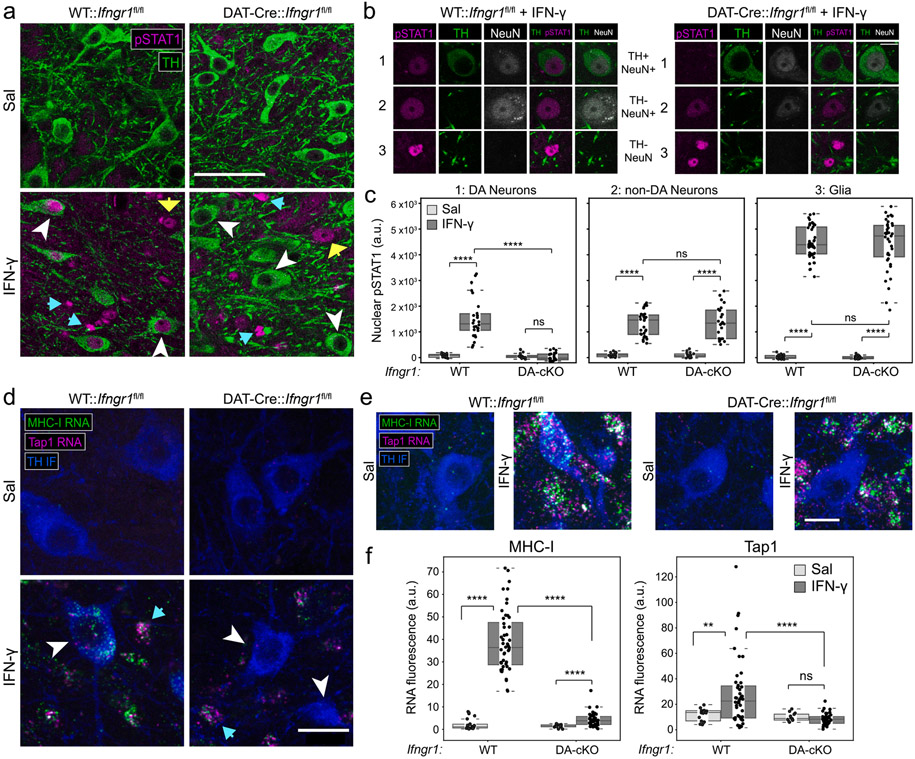
Dysregulated inflammation within the central nervous system (CNS) contributes to neuropathology in infectious, autoimmune, and neurodegenerative disease. With the exception of microglia, major histocompatibility complex (MHC) proteins are virtually undetectable in the mature, healthy central nervous system (CNS). Neurons have generally been considered incapable of antigen presentation, and although interferon gamma (IFN-γ) can elicit neuronal MHC class I (MHC-I) expression and antigen presentation in vitro, it has been unclear whether similar responses occur in vivo. Here we directly injected IFN-γ into the ventral midbrain of mature mice and analyzed gene expression profiles of specific CNS cell types. We found that IFN-γ upregulated MHC-I and associated mRNAs in ventral midbrain microglia, astrocytes, oligodendrocytes, and GABAergic, glutamatergic, and dopaminergic neurons. The core set of IFN-γ-induced genes and their response kinetics were similar in neurons and glia, but with a lower amplitude of expression in neurons. A diverse repertoire of genes was upregulated in glia, particularly microglia, which were the only cells to undergo cellular proliferation and express MHC classII (MHC-II) and associated genes. To determine if neurons respond directly via cell-autonomous IFN-γ receptor (IFNGR) signaling, we produced mutant mice with a deletion of the IFN-γ-binding domain of IFNGR1 in dopaminergic neurons, which resulted in a complete loss of dopaminergic neuronal responses to IFN-γ. Our results demonstrate that IFN-γ induces neuronal IFNGR signaling and upregulation of MHC-I and related genes in vivo, although the expression level is low compared to oligodendrocytes, astrocytes, and microglia.


Conflict of interest statement

Declaration of Competing Interest The authors declare that they have no known competing financial interests or personal relationships that could have appeared to influence the work reported in this paper.

Figures

Fig. 1.
Fig. 1.
Core transcriptional responses to IFN-γ are conserved in neurons but are lower in magnitude compared to glia (a) Experimental schematic for NeuN−/NeuN + RNA-seq after injection of saline or IFN-γ in the midbrain of WT C57BL/6J mice. (b) Principal component analysis (PCA) of RNA-seq UMI counts normalized with DESeq2 variance stabilizing transformation. Each point represents a bulk RNA-seq replicate of ~ 1000 sorted nuclei (n = 4–6 replicates each of NeuN− or NeuN + nuclei from 2 to 3 mice for each treatment/timepoint). (c) Number of differentially expressed genes (DEG) for IFN-γ vs. Sal comparisons in NeuN− or NeuN + samples, or both (overlap), at each timepoint (DESeq2, ∣log2FC∣ > 1 and pAdj < 0.01). (d) Mean ± SEM for mRNA abundance in NeuN−/NeuN + samples, normalized as log2 (CPM + 1). Samples as in (b), (n = 4–6 replicates each of NeuN−/+ nuclei from 2 to 3 mice for each treatment/timepoint). Saline samples from all timepoints are together at t = 0. (e) Heatmap of z-scored, normalized mRNA abundance (log2[CPM + 1]) for 28 mRNAs upregulated at ≥ 3 timepoints in both NeuN− and NeuN + samples (see Supp. Fig. 1d). Samples as in (b); each column is a replicate. (f) Scatter plots comparing the effect of IFN-γ (log2 fold change) in NeuN + vs. NeuN− nuclei for all IFN-γ-induced genes at each timepoint (DESeq2, log2FC > 1 and pAdj < 0.01). Points are colored by the DESeq2 log2FC comparing IFN-γ-treated NeuN + vs. NeuN− samples: values −1 to −3 correspond correspond to 2- and 8-fold higher relative expression in NeuN− nuclei, respectively.
Fig. 2.
Fig. 2.
Divergent transcriptional responses to IFN-γ in glia (a) Summary of DEGs from interaction analysis (DESeq2: ~NeuN + IFN + NeuN:IFN), broken down by baseline expression and effect of IFN-γ in NeuN + and NeuN− samples. (b) Heatmap of z-scored mRNA abundances for genes upregulated in NeuN− samples and significant in NeuN × IFN interaction analysis in (a), normalized as log2(CPM + 1). Each column represents a bulk RNA-seq replicate of ~ 1000 sorted nuclei (n = 4–6 replicates from 2 to 3 mice for each treatment/timepoint). (c) Mean ± SEM for mRNA abundance in NeuN−/NeuN + samples, normalized as log2(CPM + 1). Samples as in (b), (n = 4–6 replicates each of NeuN−/+ nuclei from 2 to 3 mice for each treatment/timepoint). All saline samples are together at t = 0. (d) Heatmap of z-scored mRNA abundances for genes downregulated in NeuN− samples and significant in NeuN × IFN interaction analysis in (a), normalized as log2(CPM + 1). Each column represents a bulk RNA-seq replicate of ~ 1000 sorted nuclei (n = 4–6 replicates from 2 to 3 mice for each treatment/timepoint).
Fig. 3.
Fig. 3.
Single nucleus RNA-seq analysis of responses to IFN-γ. (a) UMAP embedding of snRNA-seq profiles from the ventral midbrain used for downstream analysis (4,699 nuclei after collapse to major cell types and filtering, see Methods). Left: major cell types for downstream analysis, see Supp. Fig. 4b for clustering with marker genes. Right: mouse sample origin (n = 1 for saline, n = 2 for IFN-γ). (b) Box and whiskers plots depicting the sum of mRNA abundance (log2[CPM + 1]) in each major cell group for the indicated sets of MHC-I or MHC-II genes. (c) Clustered heatmap of z-scored mRNA abundance (log2[CPM + 1]) for the union of highly differentially expressed genes across all major cell groups (modified Mann-Whitney U test comparing IFN vs. Sal, ∣log2FC∣ > 4 and q < 0.05). (d) Heatmap of average mRNA abundance (log2[CPM + 1]) for genes in MGI GO:0060335: ‘positive regulation of interferon-gamma-mediated signaling pathway’. (e) Upper: UMAP embedding of dopamine neuronal snRNA-seq profiles with subcluster IDs and mouse sample origin. Lower: Heatmap of average mRNA abundance (log2[CPM + 1]) for select IFN response genes within dopamine neuronal subclusters from each mouse sample.
Fig. 4.
Fig. 4.
Ifngr1 is required for pSTAT1 induction and MHC-I upregulation in mDA neurons after in vivo exposure to IFN-γ (a) TH and pSTAT1-Y701 immunofluorescence in the SNc of WT:Ifngr1fl/fl or DAT-Cre:Ifngr1fl/fl mice after saline or IFN-γ. White arrowheads indicate TH+ mDA neurons, blue arrows indicate NeuN nuclei, and yellow arrows indicate TH neurons. Scale bar: 50 μm. (b) pSTAT1-Y701 in TH+/NeuN+ mDA neurons, TH/NeuN+ non-DA neurons, and TH/NeuN glial nuclei in the SNc of WT:Ifngr1fl/fl or DAT-Cre:Ifngr1fl/fl mice after exposure to IFN-γ. Scale bar: 10 μm. (c) Average nuclear pSTAT1 intensity (arbitrary units, median background subtracted) in each of the indicated cell types, genotypes, and treatment groups, related to (a-b). 10–20 neurons were quantified per region per mouse; n = 2 saline, n = 3 IFN-γ. **** p < 0.001, Mann-Whitney U test. (d-e) MHC-I and Tap1 RNA FISH in the SNc of WT:Ifngr1fl/fl or DAT-Cre:Ifngr1fl/fl mice after saline or IFN-γ. White arrowheads indicate TH+ mDA neurons, blue arrows indicate other cells with intact Ifngr1. Scale bars (d): 20 μm, (e): 15 μm. (f) Average MHC-I or Tap1 RNA intensity (arbitrary units, median background subtracted) in TH+ mDA neurons of the indicated genotype and treatment groups, related to (d-e). 10–20 neurons were quantified per region per mouse. WT; n = 3 Sal, n = 4 IFN-γ. DAT-Cre:Ifngr1fl/fl (DA-cKO); n = 3 Sal, n = 4 IFN-γ. **** p < 0.001, ** p < 0.01, Mann-Whitney U test.

Similar articles

Cited by

References

    1. Amor S, Peferoen LAN, Vogel DYS, Breur M, van der Valk P, Baker D, van Noort JM, 2014. Inflammation in neurodegenerative diseases–an update. Immunology 142, 151–166. 10.1111/imm.12233. - DOI - PMC - PubMed
    1. Ashburner M, Ball CA, Blake JA, Botstein D, Butler H, Cherry JM, Davis AP, Dolinski K, Dwight SS, Eppig JT, Harris MA, Hill DP, Issel-Tarver L, Kasarskis A, Lewis S, Matese JC, Richardson JE, Ringwald M, Rubin GM, Sherlock G, 2000. Gene Ontology: tool for the unification of biology. Nat. Genet 25, 25–29. 10.1038/75556. - DOI - PMC - PubMed
    1. Babcock AA, Kuziel WA, Rivest S, Owens T, 2003. Chemokine expression by glial cells directs leukocytes to sites of axonal injury in the CNS. J. Neurosci 23 (21), 7922–7930. - PMC - PubMed
    1. Bäckman CM, Malik N, Zhang Y, Shan L, Grinberg A, Hoffer BJ, Westphal H, Tomac AC, 2006. Characterization of a mouse strain expressing Cre recombinase from the 3’ untranslated region of the dopamine transporter locus. Genesis 44, 383–390. 10.1002/dvg.20228. - DOI - PubMed
    1. Barcia C, Ros CM, Annese V, Gómez A, Ros-Bernal F, Aguado-Yera D, Martínez-Pagán ME, de Pablos V, Fernandez-Villalba E, Herrero MT, 2011. IFN-γ signaling, with the synergistic contribution of TNF-α, mediates cell specific microglial and astroglial activation in experimental models of Parkinson’s disease. Cell Death Dis 2, e142. doi: 10.1038/cddis.2011.17. - DOI - PMC - PubMed

Publication types

Substances