. 2023 Apr 26;13(1):6796.
doi: 10.1038/s41598-023-29920-2.

Isolating sensory artifacts in the suprathreshold TMS-EEG signal over DLPFC

Affiliations

Isolating sensory artifacts in the suprathreshold TMS-EEG signal over DLPFC

Mohsen Poorganji et al. Sci Rep. .

Abstract

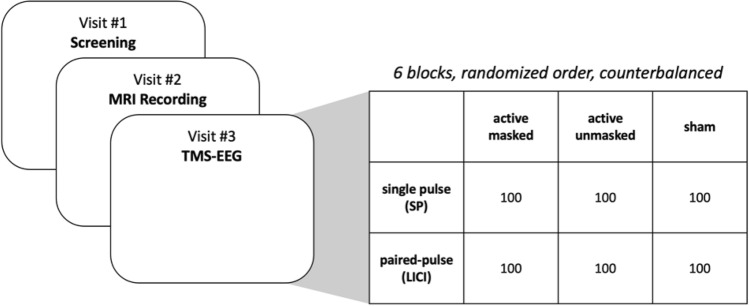
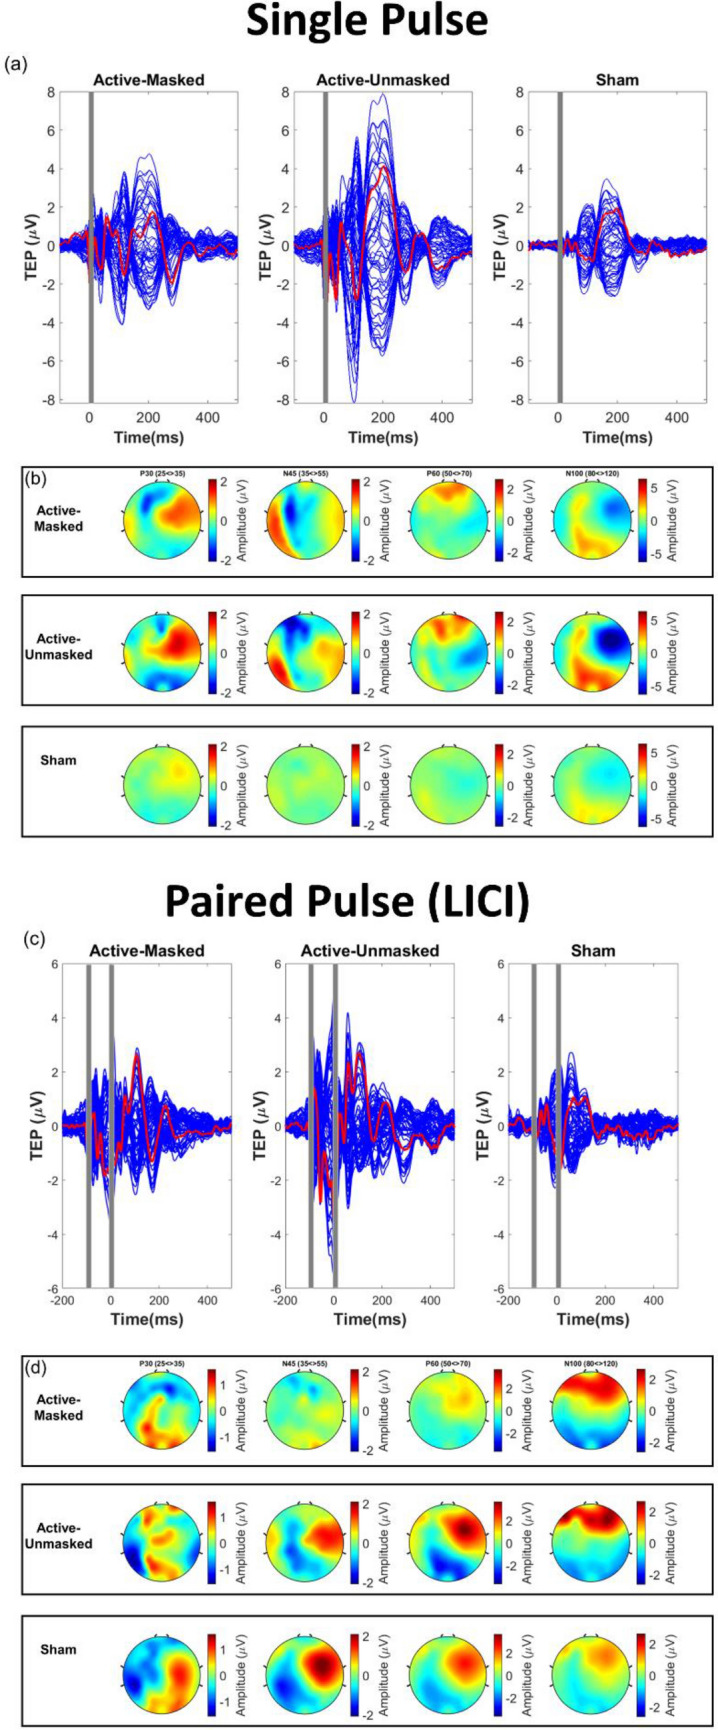
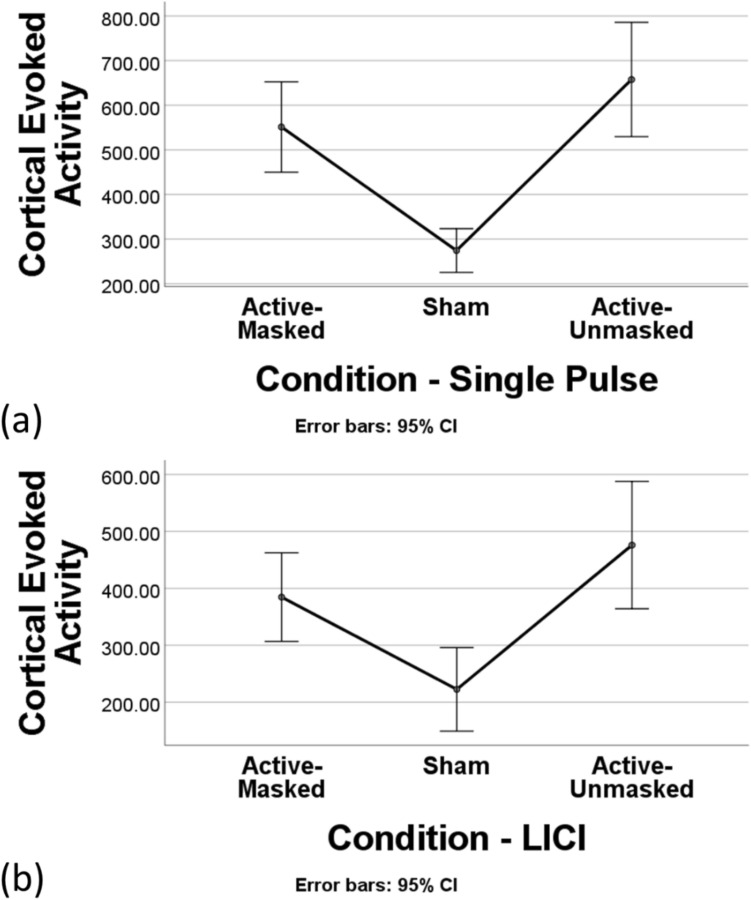
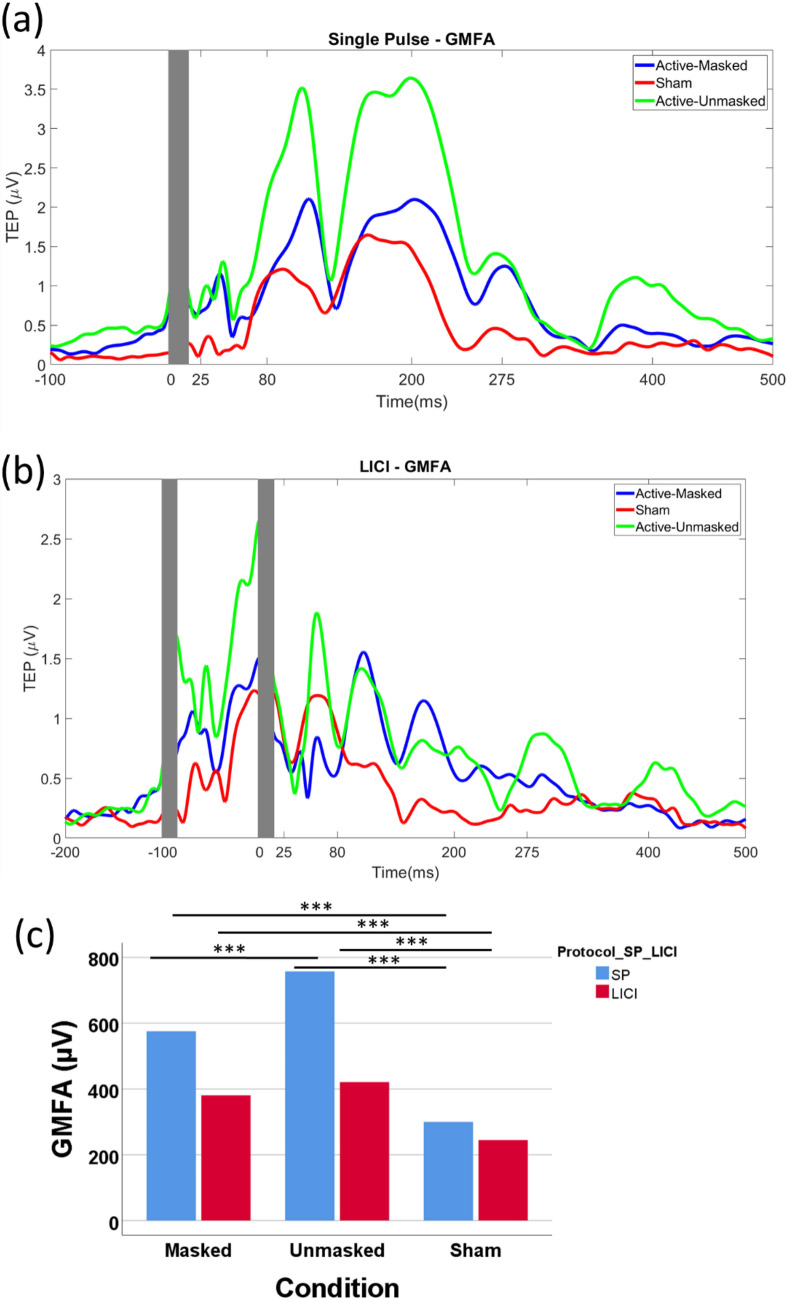
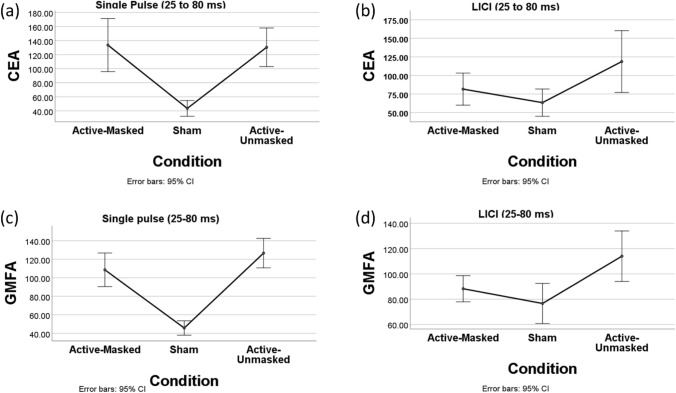
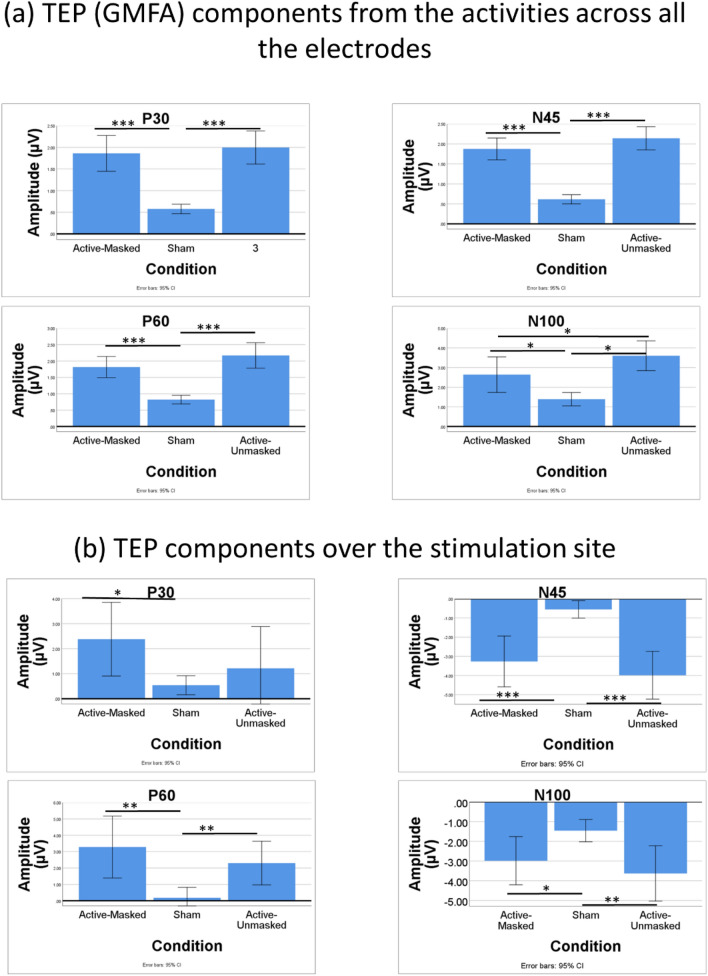
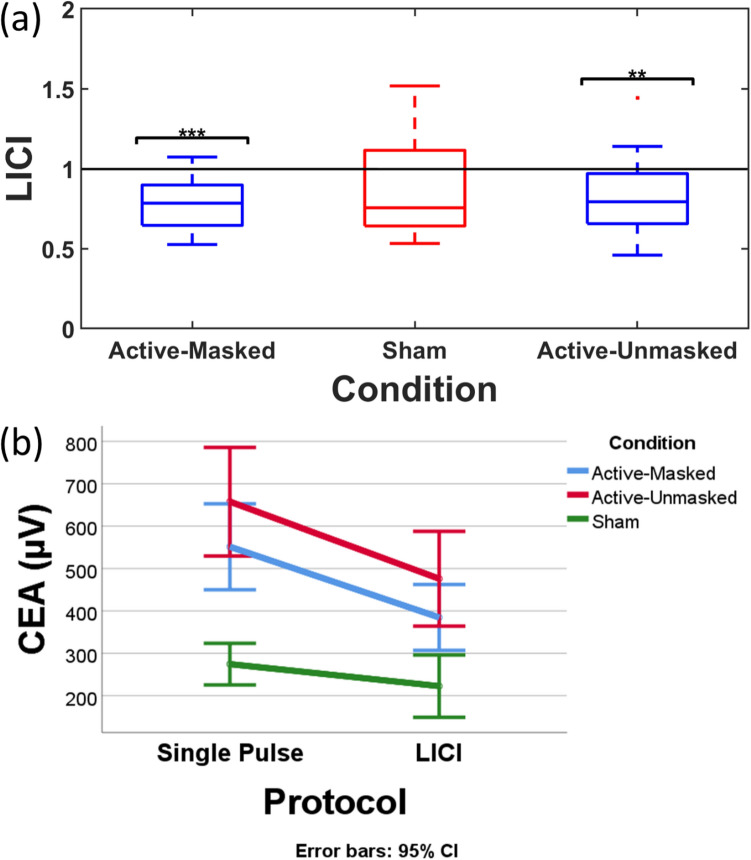
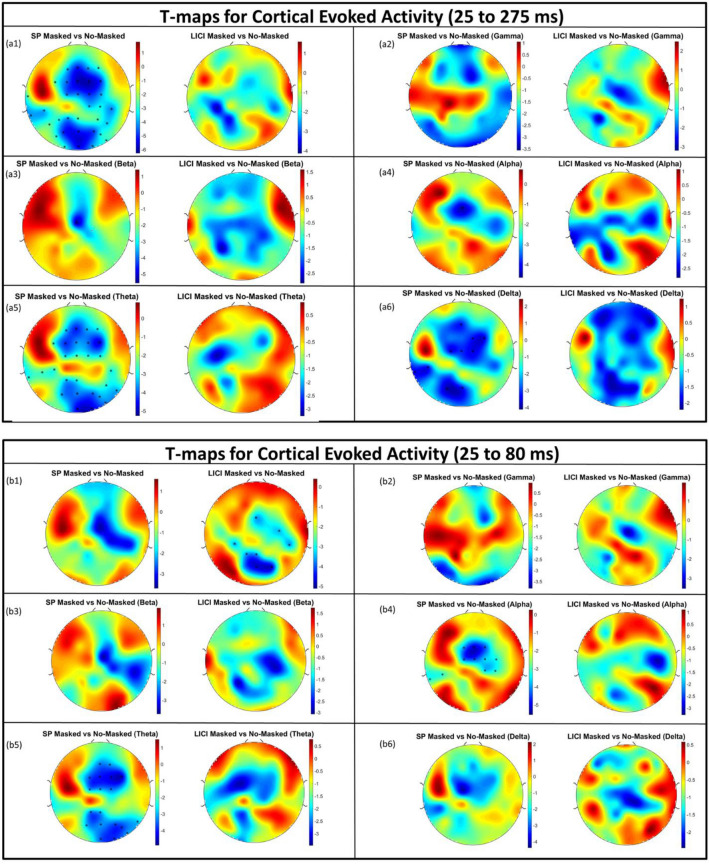
Combined transcranial magnetic stimulation and electroencephalography (TMS-EEG) is an effective way to evaluate neurophysiological processes at the level of the cortex. To further characterize the TMS-evoked potential (TEP) generated with TMS-EEG, beyond the motor cortex, we aimed to distinguish between cortical reactivity to TMS versus non-specific somatosensory and auditory co-activations using both single-pulse and paired-pulse protocols at suprathreshold stimulation intensities over the left dorsolateral prefrontal cortex (DLPFC). Fifteen right-handed healthy participants received six blocks of stimulation including single and paired TMS delivered as active-masked (i.e., TMS-EEG with auditory masking and foam spacing), active-unmasked (TMS-EEG without auditory masking and foam spacing) and sham (sham TMS coil). We evaluated cortical excitability following single-pulse TMS, and cortical inhibition following a paired-pulse paradigm (long-interval cortical inhibition (LICI)). Repeated measure ANOVAs revealed significant differences in mean cortical evoked activity (CEA) of active-masked, active-unmasked, and sham conditions for both the single-pulse (F(1.76, 24.63) = 21.88, p < 0.001, η2 = 0.61) and LICI (F(1.68, 23.49) = 10.09, p < 0.001, η2 = 0.42) protocols. Furthermore, global mean field amplitude (GMFA) differed significantly across the three conditions for both single-pulse (F(1.85, 25.89) = 24.68, p < 0.001, η2 = 0.64) and LICI (F(1.8, 25.16) = 14.29, p < 0.001, η2 = 0.5). Finally, only active LICI protocols but not sham stimulation ([active-masked (0.78 ± 0.16, P < 0.0001)], [active-unmasked (0.83 ± 0.25, P < 0.01)]) resulted in significant signal inhibition. While previous findings of a significant somatosensory and auditory contribution to the evoked EEG signal are replicated by our study, an artifact attenuated cortical reactivity can reliably be measured in the TMS-EEG signal with suprathreshold stimulation of DLPFC. Artifact attenuation can be accomplished using standard procedures, and even when masked, the level of cortical reactivity is still far above what is produced by sham stimulation. Our study illustrates that TMS-EEG of DLPFC remains a valid investigational tool.


Conflict of interest statement

ZJD has received research and equipment in-kind support for an investigator-initiated study through Brainsway Inc and Magventure Inc. He is also on the scientific advisory board for Brainsway Inc. His work has been supported by the National Institutes of Mental Health (NIMH), the Canadian Institutes of Health Research (CIHR), Brain Canada and the Temerty Family, Grant and Kreutzcamp Family Foundations. DMB receives research support from CIHR, NIH, Brain Canada and the Temerty Family through the CAMH Foundation and the Campbell Research Institute. He received research support and in-kind equipment support for an investigator-initiated study from Brainsway Ltd. and he is the site principal investigator for one sponsor-initiated study for Brainsway Ltd. He also receives in-kind equipment support from Magventure for investigator-initiated studies. He received medication supplies for an investigator-initiated trial from Indivior. He participated in a Scientific Advisory Board for Janssen and Welcony Inc. C. Z. is a shareholder of sync2brain GmbH (Tübingen, Germany), a start-up commercializing real-time EEG analysis technology. TKR has received research support from Brain Canada, Brain and Behavior Research Foundation, BrightFocus Foundation, Canada Foundation for Innovation, Canada Research Chair, Canadian Institutes of Health Research, Centre for Aging and Brain Health Innovation, National Institutes of Health, Ontario Ministry of Health and Long-Term Care, Ontario Ministry of Research and Innovation, and the Weston Brain Institute. TKR also received for an investigator-initiated study in-kind equipment support from Newronika, and in-kind research online accounts from Scientific Brain Training Pro, and participated in 2021 in an advisory board for Biogen Canada Inc. DV holds the Labatt Family Professorship in Depression Biology, a University Named Professorship at the University of Toronto. She receives research support from CIHR, the Centre for Addiction and Mental Health (CAMH) and the Department of Psychiatry at the University of Toronto. DV declares no biomedical interests or conflicts. MP, RZ, CH, ATH, IH, and RC have nothing to disclose.

Figures

Figure 1
Figure 1
Study design. On the first visit, the participant was screened to meet the inclusion criteria. On the second visit, structural (T1 and T2) magnetic resonance imaging (MRI) scans were performed. On the third visit, the participant received six blocks of stimulation including single-pulse (SP) and long-interval cortical inhibition (LICI) active-masked (with auditory masking and foam spacing), active-unmasked (without auditory masking and foam spacing), and sham.
Figure 2
Figure 2
(a) Butterfly plot showing the TMS-evoked potential waveforms for each of the three single-pulse stimulation conditions. The red line is the F3 electrode located approximately over the left DLPFC. (b) Topoplots of the three different single-pulse stimulation conditions. (c) Butterfly plot showing the TMS-evoked potential waveforms for each of the three paired-pulse stimulation conditions. The red line is the F3 electrode located approximately over the left DLPFC. (d) Topoplots of the three different paired-pulse stimulation conditions. All plots represent the average across all subjects.
Figure 3
Figure 3
(a) Comparison of cortical evoked activity (CEA(25–275 ms)) from electrodes F3 of the three single-pulse (SP) stimulation conditions using one-way repeated measure ANOVA. (b) Comparison of CEA(25–275 ms) from electrode F3 of the three conditions in paired pulse/ long interval cortical inhibition protocol (PP/ LICI) using one way repeated measure ANOVA.
Figure 4
Figure 4
(a) Global mean field amplitude (GMFA) for the three single-pulse (SP) stimulation conditions. (b) GMFA for the three stimulation conditions of paired pulse (i.e. long interval cortical inhibition (LICI)). (c) Comparison of GMFA (25–275 ms) for the three SP and LICI conditions using one-way repeated measure ANOVA (*** p < 0.001).
Figure 5
Figure 5
(a) Comparison of CEA (25–80 ms) for the three single pulse conditions using one-way repeated measure ANOVA. (b) Comparison of CEA (25–80 ms) for the three long interval cortical inhibition (LICI) conditions using one-way repeated measure ANOVA. (c) Comparison of GMFA (25–80 ms) for the three single pulse conditions using one-way repeated measure ANOVA. (d) Comparison of GMFA (25–80 ms) for the three LICI conditions using one-way repeated measure ANOVA. CEA is recorded from electrode F3. GMFA reflects the activity recorded across all the electrodes.
Figure 6
Figure 6
(a) TEP (GMFA) components from the activities across all the electrodes (b) TEP components over the stimulation site (* p < 0.05, ** p < 0.01, *** p < 0.001).
Figure 7
Figure 7
(a) The level of LICI in the three conditions of active-masked, active-unmasked, and sham. Only active blocks of stimulation resulted in significant signal inhibition which is shown by asterisks. (** p < 0.01, *** p < 0.001). (b) The interaction effect of condition of the stimulation and the stimulation protocol on cortical evoked activity (CEA(25–275 ms)) with the 95% confidence interval shown by the error bars. CEA is recorded from electrode F3.
Figure 8
Figure 8
(a1) T-maps illustrating the t-values as the result of comparison of cortical evoked activity (CEA (25–275 ms)) between active-masked and active-unmasked conditions for all of the electrodes and single pulse (SP) and long interval cortical inhibition (LICI) protocols. (a2) T-maps illustrating the t-values as the result of comparison of CEA (25–275 ms) between active-masked and active-unmasked for all of the electrodes in SP and LICI protocols over gamma band. (a3) T-maps illustrating the t-values as the result of comparison of CEA (25–275 ms) between active-masked and active-unmasked for all of the electrodes in SP and LICI protocols over beta band. (a4) T-maps illustrating the t-values as the result of comparison of CEA (25–275 ms) between active-masked and active-unmasked for all of the electrodes in SP and LICI protocols over alpha band. (a5) T-maps illustrating the t-values as the result of comparison of CEA (25–275 ms) between active-masked and active-unmasked for all of the electrodes in SP and LICI protocols over theta band. (a6) T-maps illustrating the t-values as the result of comparison of CEA (25–275 ms) between active-masked and active-unmasked for all of the electrodes in SP and LICI protocols over delta band. (b1) T-maps illustrating the t-values as the result of comparison of cortical evoked activity (CEA (25–80 ms)) between active-masked and active-unmasked conditions for all of the electrodes and single pulse (SP) and LICI protocols. (b2) T-maps illustrating the t-values as the result of comparison of CEA (25–80 ms) between active-masked and active-unmasked for all of the electrodes in SP and LICI protocols over gamma band. (b3) T-maps illustrating the t-values as the result of comparison of CEA (25–80 ms) between active-masked and active-unmasked for all of the electrodes in SP and LICI protocols over beta band. (b4) T-maps illustrating the t-values as the result of comparison of CEA (25–80 ms) between active-masked and active-unmasked for all of the electrodes in SP and LICI protocols over alpha band. (b5) T-maps illustrating the t-values as the result of comparison of CEA (25–80 ms) between active-masked and active-unmasked for all of the electrodes in SP and LICI protocols over theta band. (b6) T-maps illustrating the t-values as the result of comparison of CEA (25–80 ms) between active-masked and active-unmasked for all of the electrodes in SP and LICI protocols over delta band. The electrodes where the corrected p-value as the result of t-test to compare between the CEA of active-masked and active-unmasked was significant are represented by an asterisk (*).

References

    1. Tremblay S, et al. Clinical utility and prospective of TMS–EEG. Clin. Neurophysiol. 2019;130:802–844. doi: 10.1016/j.clinph.2019.01.001. - DOI - PubMed
    1. Hui J, Tremblay S, Daskalakis ZJ. The current and future potential of transcranial magnetic stimulation with electroencephalography in psychiatry. Clin. Pharmacol. Ther. 2019;106:734–746. doi: 10.1002/cpt.1541. - DOI - PubMed
    1. Fried PJ, et al. Training in the practice of noninvasive brain stimulation: Recommendations from an IFCN committee. Clin. Neurophysiol. 2021;132:819–837. doi: 10.1016/j.clinph.2020.11.018. - DOI - PMC - PubMed
    1. Daskalakis ZJ, Poorganji M. Getting things right—Proper training in non-invasive brain stimulation. Clin. Neurophysiol. 2021;132:810–811. doi: 10.1016/j.clinph.2021.01.002. - DOI - PubMed
    1. Ilmoniemi, R. J. et al. Dealing with artifacts in TMS-evoked EEG. in 2015 37th Annual International Conference of the IEEE Engineering in Medicine and Biology Society (EMBC) 230–233 (IEEE, 2015). 10.1109/EMBC.2015.7318342. - PubMed

Publication types

MeSH terms