. 2023 Apr 26;9(1):136.
doi: 10.1038/s41420-023-01425-x.

High glucose-induced STING activation inhibits diabetic wound healing through promoting M1 polarization of macrophages

Affiliations

High glucose-induced STING activation inhibits diabetic wound healing through promoting M1 polarization of macrophages

Kang Geng et al. Cell Death Discov. .

Abstract

Diabetic wound (DW) is characterized by elevated pro-inflammatory cytokines and cellular dysfunction consistent with elevated reactive oxygen species (ROS) levels. Recent advances in immunology have dissected molecular pathways involved in the innate immune system where cytoplasmic DNA can trigger STING-dependent inflammatory responses and play an important role in metabolic-related diseases. We investigated whether STING regulates inflammation and cellular dysfunction in DW healing. We found that STING and M1 macrophages were increased in wound tissues from DW in patients and mice and delayed the wound closure. We also noticed that the massively released ROS in the High glucose (HG) environment activated STING signaling by inducing the escape of mtDNA to the cytoplasm, inducing macrophage polarization into a pro-inflammatory phenotype, releasing pro-inflammatory cytokines, and exacerbating endothelial cell dysfunction. In Conclusion, mtDNA-cGAS-STING pathway activation under diabetic metabolic stress is an important mechanism of DW refractory healing. While using STING gene-edited macrophages for wound treatment by cell therapy can induce the polarization of wound macrophages from pro-inflammatory M1 to anti-inflammatory M2, promote angiogenesis, and collagen deposition to accelerate DW healing. STING may be a promising therapeutic target for DW.


Conflict of interest statement

The authors declare no competing interests.

Figures

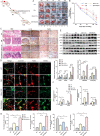
Fig. 1
Fig. 1. STING and its downstream effectors expression are excessively increased in macrophages of human patients with DW.
A Sections of NC (upper row), NDW (middle row), and DW (lower row) were stained with H&E (Columns 1 and 2 on the left) or for IL-1β expression (Columns 3 and 4 on the left) and CD68 expression (right 2 columns). B Skin and wound lysates were examined for IL- 1β and CD68 using western blot analysis. Blots are quantified using bar graphs. C Sections of NC (upper row), NDW (middle row), and DW (lower row) were stained with co-localization of macrophages and STING using laser confocal microscopy. Anti-CD68 antibody labeled Macrophages (red), anti-STING antibody labeled STING (green) and DAPI labeled nucleus (blue). D Skin and wound lysates were examined for cGAS, STING, and inflammatory signaling using western blot analysis. Blots are quantified using bar graphs. For all bar graphs, Data were represented as mean ± SD (n = 9). *P < 0.05, **P < 0.01, and ***P < .001, NC vs NDW, NC vs DW, NDW vs DW.
Fig. 2
Fig. 2. Wound healing is coupled with increased signaling events of STING.
Male WT C57BL/6 J mice, at 4–5 weeks of age, were fed an HFD for 12 weeks, then intraperitoneally injected Streptozocin (STZ) to form a diabetes model (DM mice), 4 weeks later, all WT and DM mice were prepared 10 × 10 mm2 wounds on the backs using skin punches, then waited for natural healing. A Non-wounded and wounded back skin lysates (days 3 after trauma, indicated at the top of each lane) of WT and DM mice were examined for STING using western blot analysis. Blots are quantified using bar graphs. B Skin and wound mRNA levels were examined using RT-qPCR. C Non-wounded and wounded back skin lysates (days 3, 7, 11, 13 after trauma, indicated at the top of each lane) of WT and DM mice were examined for cGAS, STING, and IL-1β using western blot analysis. Blots are quantified using bar graphs. D Wound mRNA levels were examined using RT-qPCR. E Sections of WT (left 4 columns) and DM (right 4 columns) on days 3, 7, 11, and 13 after trauma (upper, middle 1–2, and lower row) were stained with colocalization of macrophages and STING using living cell imaging microscopy. Anti-F4/80 antibody labeled Macrophages (red), anti-STING antibody labeled STING (green) and DAPI labeled nucleus (blue). For all bar graphs, Data were represented as mean ± SD (n = 3). *P < 0.05, **P < 0.01 and ***P < 0.001, WT vs DM.
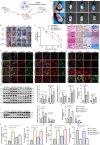
Fig. 3
Fig. 3. Treatment with STING inhibitor/agonist promotes/worsens DW healing.
All WT and DM mice were prepared 10 × 10 mm2 wounds on the backs using skin punches, 3 days after trauma, all DW mice were intraperitoneally injected with Vehicle, DMXAA, and C-176. A Representative images of wounded skin after treatment with either vehicle or DMXAA and C-176 at days 0, 3, 7, 11, and 13 after trauma. B Percent of wound area at each time following vehicle or DMXAA and C176 treatment relative to the original wound area. Quantification of wound areas in n = 6 (Veh, DMXAA, and C176) wounds per group were performed with Fiji software. Sections of WT, DM, DM + C176, and DM + DMXAA (upper, middle 1–2, and lower row) at days 7 after trauma were stained with H&E (Columns 1 and 2 on the left) or for IL-1β expression (Columns 3 and 4 on the left) and F4/80 expression (right 2 columns) (C), and colocalization of macrophages and STING using living cell imaging microscopy. Anti-F4/80 antibody labeled Macrophages (red), anti-STING antibody labeled STING (green) and DAPI labeled nucleus (blue) (D). E Wound lysates (days 7 after trauma) of all groups (indicated at the top of each lane) were examined for cGAS, STING, IL-1β, and inflammatory signaling using western blot analysis. Blots are quantified using bar graphs. F Wound mRNA (days 7 after trauma) levels were examined using RT-qPCR. G The secretion levels of inflammatory cytokines IL-1β, TNF-α, IL-6, and IL-10 in the wound homogenates (days 7 after trauma) were detected by ELISA. For all bar graphs, Data were represented as mean ± SD (n = 6). *P < 0.05, **P < 0.01 and ***P < 0.001, DM vs DM + DMXAA, DM vs DM + C176 (in B), WT vs DM, DM vs DM + DMXAA, DM vs DM + C176 (in EG).
Fig. 4
Fig. 4. HG via ROS induces mitochondrial DNA (mtDNA) leakage and activates STING signaling in macrophages.
A BMDM were treated with HG (30 mmol/L) for 24, 36, and 48 h or normal control (NC, 5.5 mmol/L) for 24 h, then examined for STING using western blot analysis. B The mRNA levels were examined using RT-qPCR. C BMDM from STING−/− and WT C57BL/6 J mice (WT-BMDM and STING−/−-BMDM) were treated with HG and NC for 24 h, then examined for STING using western blot analysis. D WT-BMDM and STING−/−-BMDM were treated with or without DMXAA (75 mg/mL) and C176 (5 nmol/mL) for 24 h in the absence or presence of HG for the last 24 h, then examined for inflammatory signaling using western blot analysis. BMDM were treated with HG and NC for 24 h, then examined for the displacement of STING toward Golgi apparatus (GM130) and mtDNA leakage using laser confocal microscopy. Anti-GM130 antibody labeled Golgi apparatus (red), anti-STING antibody labeled STING (green) and DAPI labeled nucleus (blue) (E), F Anti-Mitofilin antibody labeled Mitochondria (red), anti-dsDNA antibody labeled mtDNA (green) and DAPI labeled nucleus (blue). WT-BMDM and STING−/−-BMDM were treated with HG and NC for 24 h, then examined for ROS production using living cell imaging microscopy (G), cGAS protein expression using western blot analysis (H), mRNA levels using RT-qPCR (I), downstream NF-κB and IRF3 activation using living cell imaging microscopy (J). For all bar graphs, Measurement Data were represented as mean ± SD. One-way analysis of variance (ANOVA) and Tukey’s post hoc test were used for comparing data among multiple groups. The cell experiment was repeated 3 times. *P < 0.05, **P < 0.01 and ***P < 0.001, NC vs HG (in A, B, C, H, and I), NC vs NC + DMXAA, HG vs HG + C176 and WT-BMDM vs STING−/−-BMDM in HG condition (in D).
Fig. 5
Fig. 5. STING activation promotes M1 polarization of macrophages in DW healing.
A Differential immune cell infiltration patterns between normal and diabetic tissue microenvironments were performed using GEO microarrays. B Wound leukocytes were isolated for flow cytometry and scatter plots, as well as those gated on wound total leukocytes (CD45), are shown. C Percentage of CD45+ cells in total wound homogenate in NDW and DW. D Percentage of CD11b+ cells in total wound leukocytes (CD45 + cells) in NDW and DW. E Percentage of CD86+ cells in total wound macrophages (CD45 + CD11b+ cells) in NDW and DW. Data were represented as mean ± SD from at least 3 independent experiments (n = 3 patients per group and experiment). F Wound lysates (at days 7 after trauma) of all groups (indicated at the top of each lane) were examined for iNOS and Arg-1 using western blot analysis. Blots are quantified using bar graphs. G Wound mRNA (at days 7 after trauma) levels were examined using RT-qPCR. For all bar graphs, data were represented as mean ± SD (n = 5). *P < 0.05, **P < 0.01 and ***P < 0.001, NDW vs DW (in CE), WT vs DM, DM vs DM + DMXAA, DM vs DM + C176 (in FG).
Fig. 6
Fig. 6. STING enables macrophages to M1 polarization that promotes pro-inflammatory responses and vascular endothelial cell dysfunction.
A WT-BMDM and STING−/−-BMDM were treated with HG and NC for 24 h, then the mRNA levels were examined using RT-qPCR (B) WT-BMDM and STING−/−-BMDM were treated with HG and NC for 24 h, then examined for colocalization of iNOS and F4/80 using living cell imaging microscopy. Anti-F4/80 antibody labeled Macrophages (red), anti-iNOS antibody labeled M1macrophages (green) and DAPI labeled nucleus (blue). C WT-BMDM and STING−/−-BMDM were treated with or without DMXAA for 24 h in the absence or presence of HG for the last 24 h for flow cytometry and scatter plots, as well as those gated on M1 macrophages (F4/80 + CD11b + CD11c + CD206- cells), were shown. D WT-BMDM were treated with LPS (50 ng/ml) +IFN-γ (50 ng/ml) (M1), IL-4 (40 ng/ml) (M2) for 24 h, then treated with C-176 (M1 + C176) or DMXAA (M2 + DMXAA) respectively for 24 h for flow cytometry and scatter plots, as well as those gated on M1 macrophages (F4/80+CD11b+CD11c+CD206 cells) and M2 macrophages (F4/80+ CD11b+CD206+ CD11c cells) were shown. E WT-BMDM and STING−/−-BMDM were treated with HG and NC for 24 h, collected cell supernatant, mixed with the fresh medium at a ratio of 1:1, and added to RVEs, then observed the migration ability by scratch wound assay. F VEGF and CD31 were Observed using living cell imaging microscopy. For all bar graphs, Data were represented as mean ± SD. The cell experiment was repeated 3 times. *P < 0.05, **P < 0.01 and ***P < 0.001, WT-BMDM vs STING−/−-BMDM (in A, C, E, and F), M1 vs M2, M1 vs M1 + C176, M2 vs M2 + DMXAA (in D).
Fig. 7
Fig. 7. Cell therapy regulates macrophages STING disruption accelerates DW healing.
All db/m and db/db mice were prepared 10 × 10 mm2 wounds on the backs using skin punches, after an injury on the 3rd day, all mice were subcutaneously injected BMDMs around the wound edge. A Colonization of BMDMs after subcutaneous injection at days 0, 1, 3, and 5 after wounding using a Small animal imaging system in vivo. B Representative images of wounded skin after treatment with BMDMs at days 0, 3, 7, 11, and 13 after wounding. C Percent of wound area at each time following BMDMs treatment relative to the original wound area. Quantification of wound areas were performed with Fiji software. Sections of db/m+BMDM, db/db+BMDM, db/m+BMDMDMXAA, and db/db+BMDMSTINGKO (upper, middle 1–2, and lower row) at days 7 after trauma were stained with H&E (Columns 1 on the left) or for IL-1β and CD31 expression (Columns 2 and 3 on the left) and Masson expression (right 1 column). D Colocalization of macrophages and STING, iNOS and STING, Arg-1 and STING using living cell imaging microscopy. Anti-F4/80 antibody labeled Macrophages (red), anti-STING antibody labeled STING (green), anti-iNOS antibody labeled M1 (green), anti-Arg-1 antibody labeled M2 (green) and DAPI labeled nucleus (blue) (EG). Wound lysates (day 7 after injury) of all groups were examined for STING, IL-1β (H), iNOS, and Arg-1 (J) using western blot analysis (H) and RT-qPCR (IK), secretion levels of inflammatory cytokines IL-1β, TNF-α, IL-6, and IL-10 by ELISA (L). For all bar graphs, Data were represented as mean ± SD (n = 5). *P < 0.05, **P < 0.01 and ***P < 0.001, db/db+BMDM vs db/db+BMDMSTINGKO, db/m+BMDM vs db/m+BMDMDMXAA (in C), db/m+BMDM vs db/db+BMDM, db/db+BMDM vs db/db+BMDMSTINGKO, db/m+BMDM vs db/m+BMDMDMXAA (in HL).
Fig. 8
Fig. 8. Schematic diagram showing the proposed mechanism that involves STING signaling in wound healing in DW.
HG-induced STING activation promoted M1 polarization of macrophages and aggravated DW healing disorder.

Similar articles

Cited by

References

    1. Sun H, Saeedi P, Karuranga S, Pinkepank M, Ogurtsova K, Duncan BB, et al. IDF Diabetes Atlas: Global, regional and country-level diabetes prevalence estimates for 2021 and projections for 2045. Diabetes Res Clin Pract. 2022;183:109119. doi: 10.1016/j.diabres.2021.109119. - DOI - PMC - PubMed
    1. Chang M, Nguyen TT. Strategy for treatment of infected diabetic foot ulcers. Acc Chem Res. 2021;54:1080–93. doi: 10.1021/acs.accounts.0c00864. - DOI - PubMed
    1. Ragu S, Matos-Rodrigues G, Lopez BS. Replication stress, DNA damage, inflammatory cytokines and innate immune response. Genes (Basel) 2020;11:409. doi: 10.3390/genes11040409. - DOI - PMC - PubMed
    1. Domínguez-Andrés J, Joosten LA, Netea MG. Induction of innate immune memory: The role of cellular metabolism. Curr Opin Immunol. 2019;56:10–16. doi: 10.1016/j.coi.2018.09.001. - DOI - PubMed
    1. Gaber T, Strehl C, Buttgereit F. Metabolic regulation of inflammation. Nat Rev Rheumatol. 2017;13:267–79. doi: 10.1038/nrrheum.2017.37. - DOI - PubMed

LinkOut - more resources