. 2023 Apr 26;13(1):6841.
doi: 10.1038/s41598-023-33675-1.

The aorta in humans and African great apes, and cardiac output and metabolic levels in human evolution

Affiliations

The aorta in humans and African great apes, and cardiac output and metabolic levels in human evolution

Luis Ríos et al. Sci Rep. .

Abstract

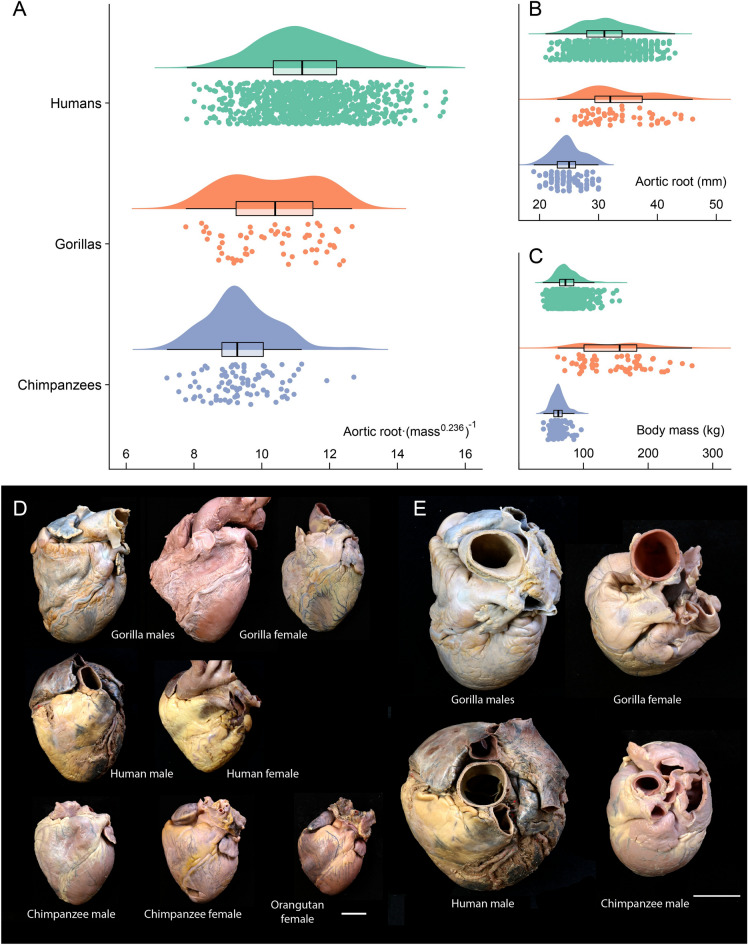
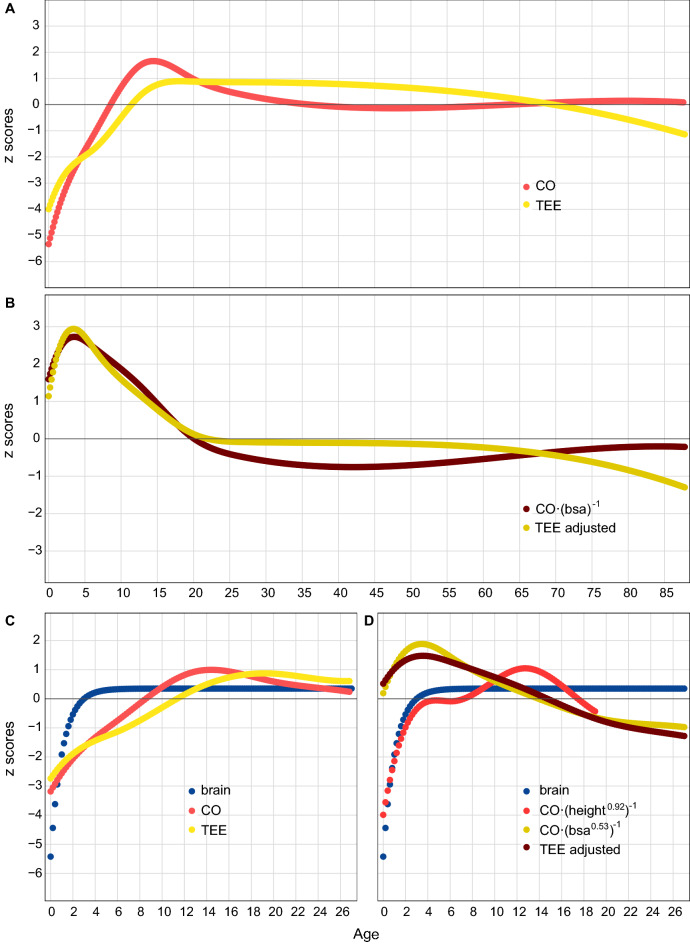
Humans have a larger energy budget than great apes, allowing the combination of the metabolically expensive traits that define our life history. This budget is ultimately related to the cardiac output, the product of the blood pumped from the ventricle and the number of heart beats per minute, a measure of the blood available for the whole organism physiological activity. To show the relationship between cardiac output and energy expenditure in hominid evolution, we study a surrogate measure of cardiac output, the aortic root diameter, in humans and great apes. When compared to gorillas and chimpanzees, humans present an increased body mass adjusted aortic root diameter. We also use data from the literature to show that over the human lifespan, cardiac output and total energy expenditure follow almost identical trajectories, with a marked increase during the period of brain growth, and a plateau during most of the adult life. The limited variation of adjusted cardiac output with sex, age and physical activity supports the compensation model of energy expenditure in humans. Finally, we present a first study of cardiac output in the skeleton through the study of the aortic impression in the vertebral bodies of the spine. It is absent in great apes, and present in humans and Neanderthals, large-brained hominins with an extended life cycle. An increased adjusted cardiac output, underlying higher total energy expenditure, would have been a key process in human evolution.


Conflict of interest statement

The authors declare no competing interests.

Figures

Figure 1
Figure 1
Differences between humans, gorillas, and chimpanzees (sexes combined), in aortic root diameter scaled to body mass raised to the exponent 0.236 (A), aortic root diameter (B), and body mass (C) (see Supplementary Materials 2–4). The raw data and probability density, together with a box plot (median and interquantile range), are shown in these raincloud plots. All comparisons between species were statistically significant (P < 0.001), except for the aortic root diameter between humans and gorillas (P = 0.208). P values correspond to Games-Howell post hoc tests, corrected for family wise error (36 tests), with the Bonferroni-Holm method (see Supplementary Material 2). In (D), anterior view of hearts from anatomical dissections carried out by one of the authors (F.P.) for teaching purposes in the Faculty of Medicine (Valladolid, Spain) (Supplementary Material 3). From top to bottom and from left to right, two male and one female gorilla hearts (who died in different Zoological Parks in Spain); one male and one female human heart from donated bodies; one male and one female chimpanzee hearts together with a female orangutan heart (individuals who died in different Zoological Parks in Spain). In (E), view of the ascending aorta of selected hearts from (D), the gorilla male and female (top row), and a human and chimpanzee males (bottom row). White bars, 3 cm.
Figure 2
Figure 2
Cardiac output (CO, L/min), stroke volume (SV, mL), and heart rate (HR, beats per minute, bpm), across the adult lifespan for 101 to 277 human samples classified either as control (healthy persons who do not regularly practice sports, red dots), or physically active (either professional athletes or subjects who regularly practice sports, blue dots), obtained from a literature search (Supplementary Material 6). Values for the three variables are shown in (AC), while values scaled to height (cardiac output, stroke volume), or weight (heart rate), raised to their correspondent exponents (see Supplementary Material 6), are shown in (D, E). Lines and shaded regions indicate simple linear regression analysis (ordinary least square, OLS), and 95% confidence intervals, with age as a predictor, and R2 and p values for each regression are shown (see Supplementary Material 6).
Figure 3
Figure 3
Change along the lifespan of cardiac output (CO), and total energy expenditure (TEE) (A), and of both variables adjusted to body surface area (CO/bsa) and fat free mass, respectively (B). Change between birth and adulthood of brain weight, cardiac output, and total energy expenditure (C). In (D), the same variables, but with cardiac output scaled to height and body surface area, and TEE adjusted to fat free mass (B). Data were first obtained from the literature (Supplementary Material 7), and then a Gompertz (brain), or cubic spine function (all the other variables), were fitted to the values. Predicted values from the functions were obtained and converted to z-scores for comparison between variables (Supplementary Material 7).
Figure 4
Figure 4
The vertebral body asymmetry values between vertebral levels V8 (T1) and V24 (see Supplementary Material 8). In A, great ape’s values are displayed (73 individuals: Pan, 43; Gorilla, 24; Pongo, 6), following the same color code as in Fig. 1, with orangutan specimens in pink color. In B, human values are displayed (48 individuals). Sexes were combined for great apes and humans. The red asterisk in (A and B) indicate vertebral levels where asymmetry was significant, while the green asterisks in (B) indicate the vertebral level where the humans were significantly more asymmetric than the great apes. In (C), the human density plots per vertebral level are shown, together with the mean value (black vertical line). The value from one Neanderthal from El Sidrón site is shown (light blue circle), as well as the values from the vertebrae from the KNM WT-150000 fossil (dark blue circles). In (D), the inferior view of the sixth thoracic vertebral body surface from one chimpanzee, one gorilla, two modern humans, one Neanderthal and the fossil KNM WT 15,000 are shown, with the white bar representing 1 cm. The red arrow in the two modern human vertebra and the Neanderthal vertebra indicates the flattening of the left side of the vertebral body left by the descending aorta, or aortic impression.

Similar articles

Cited by

References

    1. Pontzer H, et al. Metabolic acceleration and the evolution of human brain size and life history. Nature. 2016;533:390. doi: 10.1038/nature17654. - DOI - PMC - PubMed
    1. Pontzer H, et al. Constrained total energy expenditure and metabolic adaptation to physical activity in adult humans. Curr. Biol. 2016;26:410–417. doi: 10.1016/j.cub.2015.12.046. - DOI - PMC - PubMed
    1. Pontzer H, et al. Daily energy expenditure through the human life course. Science. 2021;373:808. doi: 10.1126/science.abe5017. - DOI - PMC - PubMed
    1. Dugas LR, et al. Energy expenditure in adults living in developing compared with industrialized countries: A meta-analysis of doubly labeled water studies. Am. J. Clin. Nutr. 2011;93:427–441. doi: 10.3945/ajcn.110.007278. - DOI - PMC - PubMed
    1. Pontzer H, Wood BM, Raichlen DA. Hunter-gatherers as models in public health. Obes. Rev. 2018;19:24–35. doi: 10.1111/obr.12785. - DOI - PubMed

Publication types