

AI-assisted prediction of differential response to antidepressant classes using electronic health records
- PMID: 37100858
- PMCID: PMC10133261
- DOI: 10.1038/s41746-023-00817-8
AI-assisted prediction of differential response to antidepressant classes using electronic health records
Abstract
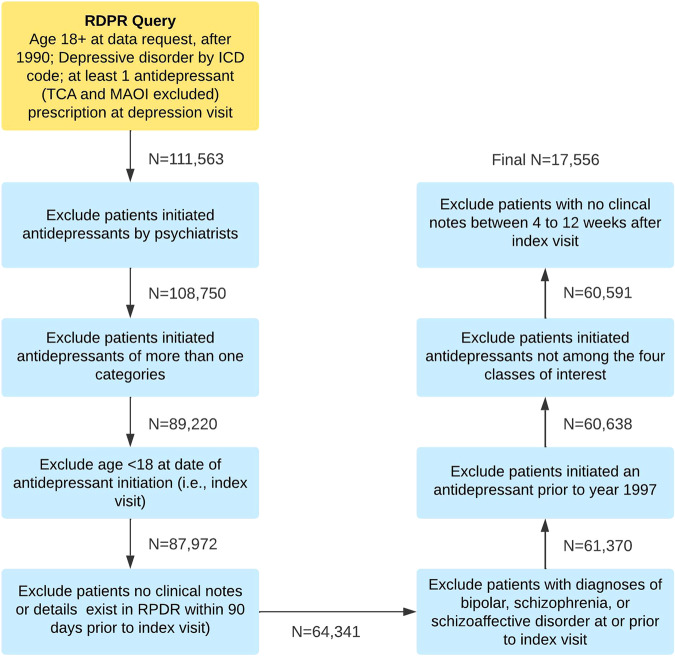
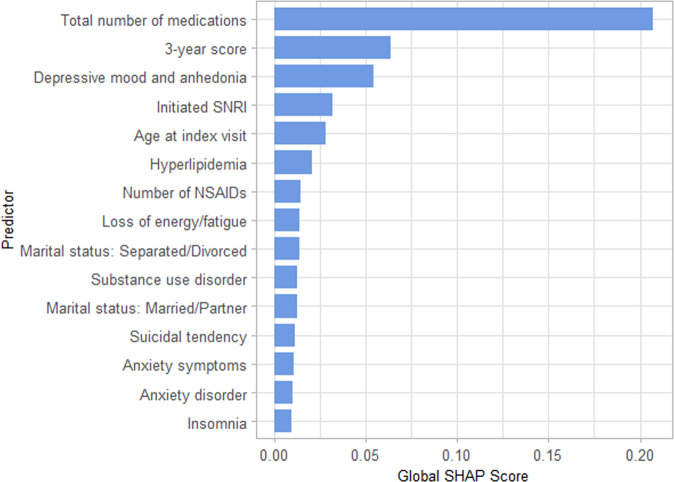
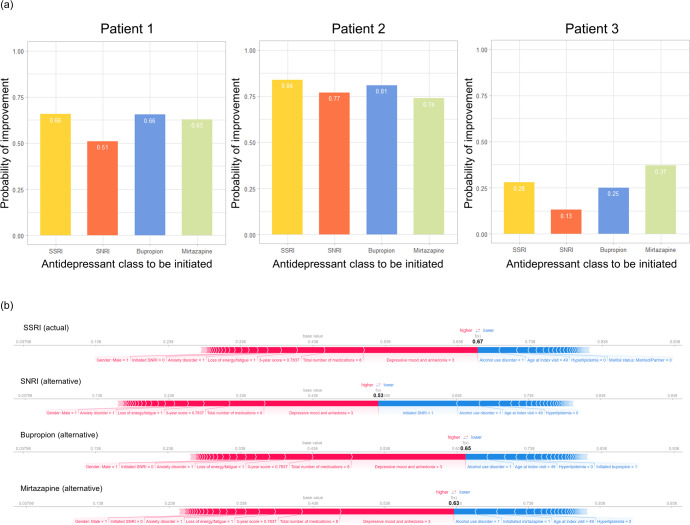
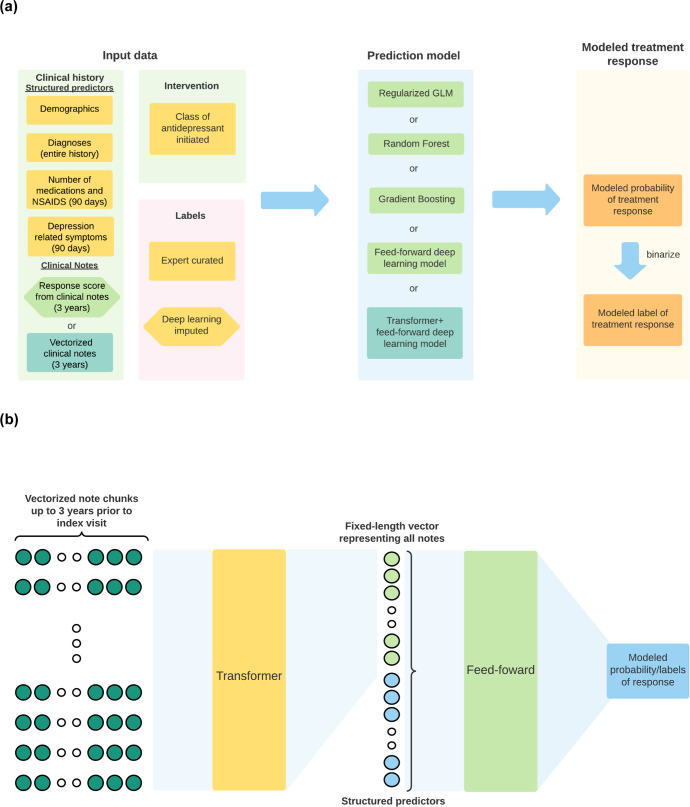
Antidepressant selection is largely a trial-and-error process. We used electronic health record (EHR) data and artificial intelligence (AI) to predict response to four antidepressants classes (SSRI, SNRI, bupropion, and mirtazapine) 4 to 12 weeks after antidepressant initiation. The final data set comprised 17,556 patients. Predictors were derived from both structured and unstructured EHR data and models accounted for features predictive of treatment selection to minimize confounding by indication. Outcome labels were derived through expert chart review and AI-automated imputation. Regularized generalized linear model (GLM), random forest, gradient boosting machine (GBM), and deep neural network (DNN) models were trained and their performance compared. Predictor importance scores were derived using SHapley Additive exPlanations (SHAP). All models demonstrated similarly good prediction performance (AUROCs ≥ 0.70, AUPRCs ≥ 0.68). The models can estimate differential treatment response probabilities both between patients and between antidepressant classes for the same patient. In addition, patient-specific factors driving response probabilities for each antidepressant class can be generated. We show that antidepressant response can be accurately predicted from real-world EHR data with AI modeling, and our approach could inform further development of clinical decision support systems for more effective treatment selection.
© 2023. The Author(s).
Conflict of interest statement
J.W.S. is a member of Scientific Advisory Board of Sensorium Therapeutics (with equity) and has received grant support from Biogen, Inc. He is PI of a collaborative study of the genetics of depression and bipolar disorder sponsored by 23andMe for which 23andMe provides analysis time as in-kind support but no payments. The other authors declare no competing interests.
Figures
Similar articles
-
Deep learning approach for early prediction of COVID-19 mortality using chest X-ray and electronic health records.BMC Bioinformatics. 2023 May 9;24(1):190. doi: 10.1186/s12859-023-05321-0. BMC Bioinformatics. 2023. PMID: 37161395 Free PMC article.
-
Can Predictive Modeling Tools Identify Patients at High Risk of Prolonged Opioid Use After ACL Reconstruction?Clin Orthop Relat Res. 2020 Jul;478(7):0-1618. doi: 10.1097/CORR.0000000000001251. Clin Orthop Relat Res. 2020. PMID: 32282466 Free PMC article.
-
Electronic Medical Record-Based Machine Learning Approach to Predict the Risk of 30-Day Adverse Cardiac Events After Invasive Coronary Treatment: Machine Learning Model Development and Validation.JMIR Med Inform. 2022 May 11;10(5):e26801. doi: 10.2196/26801. JMIR Med Inform. 2022. PMID: 35544292 Free PMC article.
-
Applications of Artificial Intelligence to Electronic Health Record Data in Ophthalmology.Transl Vis Sci Technol. 2020 Feb 27;9(2):13. doi: 10.1167/tvst.9.2.13. Transl Vis Sci Technol. 2020. PMID: 32704419 Free PMC article. Review.
-
Artificial Intelligence for Hip Fracture Detection and Outcome Prediction: A Systematic Review and Meta-analysis.JAMA Netw Open. 2023 Mar 1;6(3):e233391. doi: 10.1001/jamanetworkopen.2023.3391. JAMA Netw Open. 2023. PMID: 36930153 Free PMC article.
Cited by
-
Post-marketing surveillance of anticancer drugs using natural language processing of electronic medical records.NPJ Digit Med. 2024 Nov 9;7(1):315. doi: 10.1038/s41746-024-01323-1. NPJ Digit Med. 2024. PMID: 39521935 Free PMC article.
-
Patients prefer human psychiatrists over chatbots: a cross-sectional study.Croat Med J. 2025 Feb 28;66(1):13-19. doi: 10.3325/cmj.2025.66.13. Croat Med J. 2025. PMID: 40047157 Free PMC article.
-
Antidepressant Non-refill as a Proxy Measure for Medication Acceptability in Electronic Health Records.J Clin Psychopharmacol. 2025 Jul-Aug 01;45(4):310-319. doi: 10.1097/JCP.0000000000002001. Epub 2025 Apr 7. J Clin Psychopharmacol. 2025. PMID: 40193626
-
Artificial Intelligence in Healthcare: A Revolutionary Ally or an Ethical Dilemma?Balkan Med J. 2024 Mar 1;41(2):87-88. doi: 10.4274/balkanmedj.galenos.2024.2024-250124. Epub 2024 Jan 25. Balkan Med J. 2024. PMID: 38269851 Free PMC article. No abstract available.
-
Artificial Intelligence Applications in Diabetic Retinopathy: What We Have Now and What to Expect in the Future.Endocrinol Metab (Seoul). 2024 Jun;39(3):416-424. doi: 10.3803/EnM.2023.1913. Epub 2024 Jun 10. Endocrinol Metab (Seoul). 2024. PMID: 38853435 Free PMC article. Review.
References
-
- Pratt, L. A., Brody, D. J. & Gu, Q. Antidepressant use among persons aged 12 and over: United States, 2011-2014. NCHS Data Brief283, 1–8 (2017). - PubMed
-
- Gelenberg, A. J. et al. Practice guideline for the treatment of patients with major depressive disorder (American Psychiatric Association, 2010).
Grants and funding
LinkOut - more resources
Full Text Sources
