. 2023 May;617(7960):369-376.
doi: 10.1038/s41586-023-06010-x. Epub 2023 Apr 26.

Inhibitory input directs astrocyte morphogenesis through glial GABABR

Affiliations

Inhibitory input directs astrocyte morphogenesis through glial GABABR

Yi-Ting Cheng et al. Nature. 2023 May.

Abstract

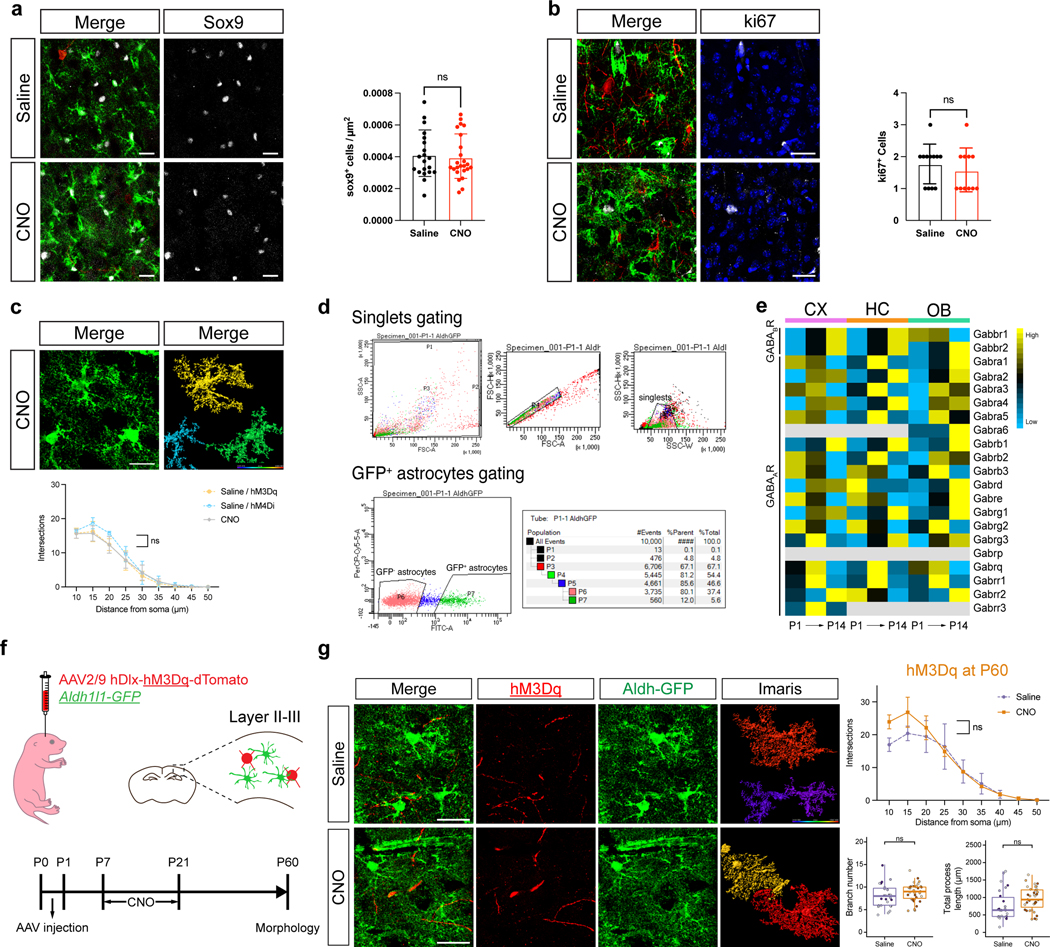
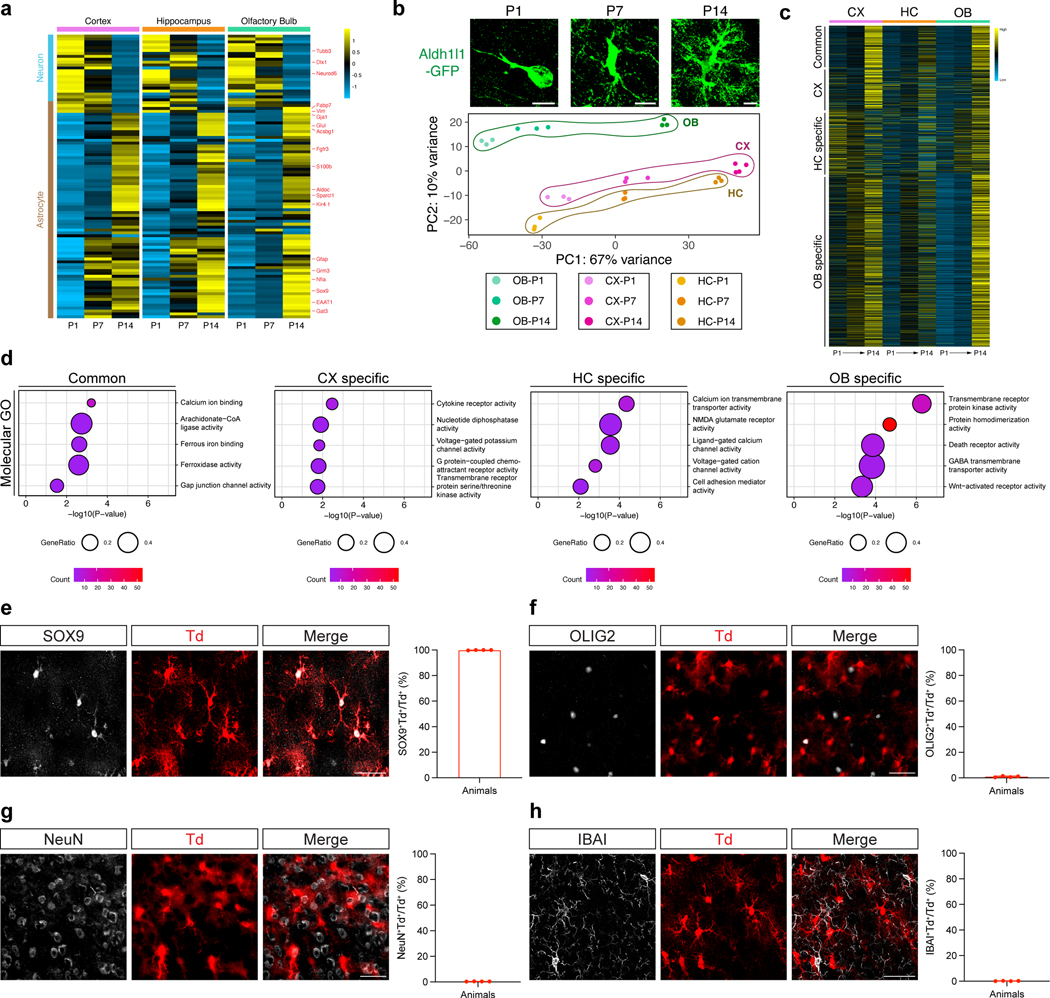
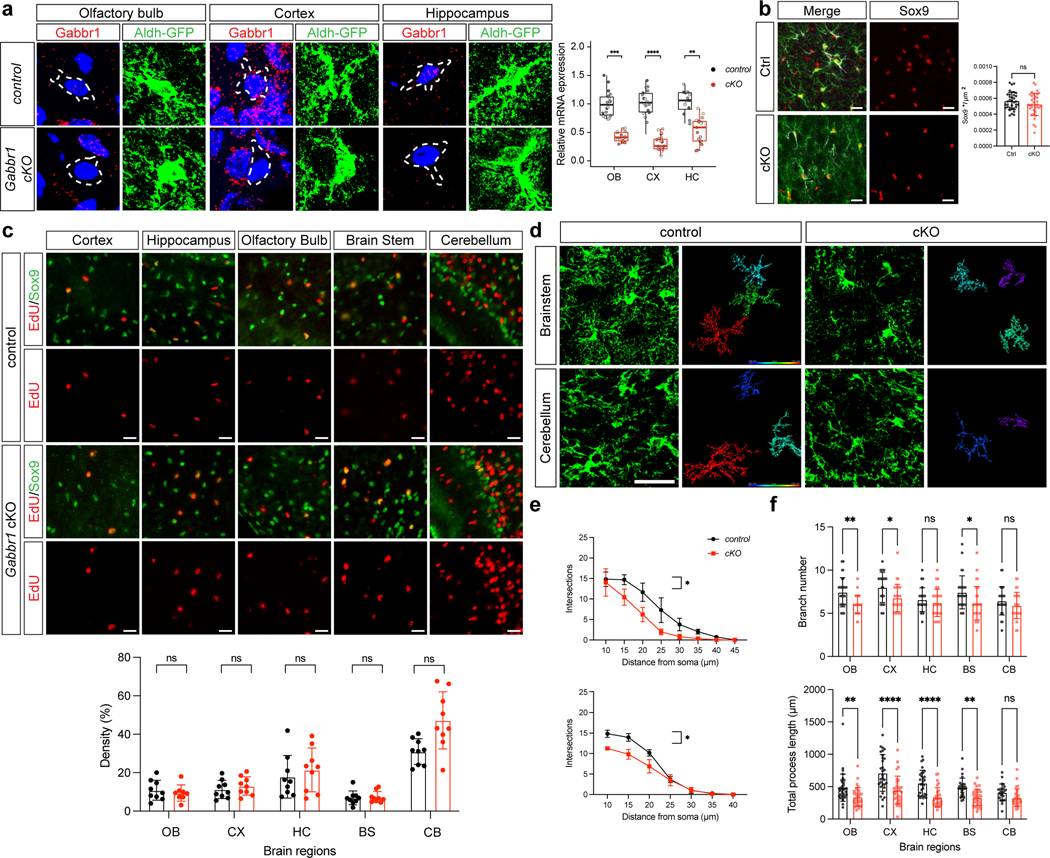
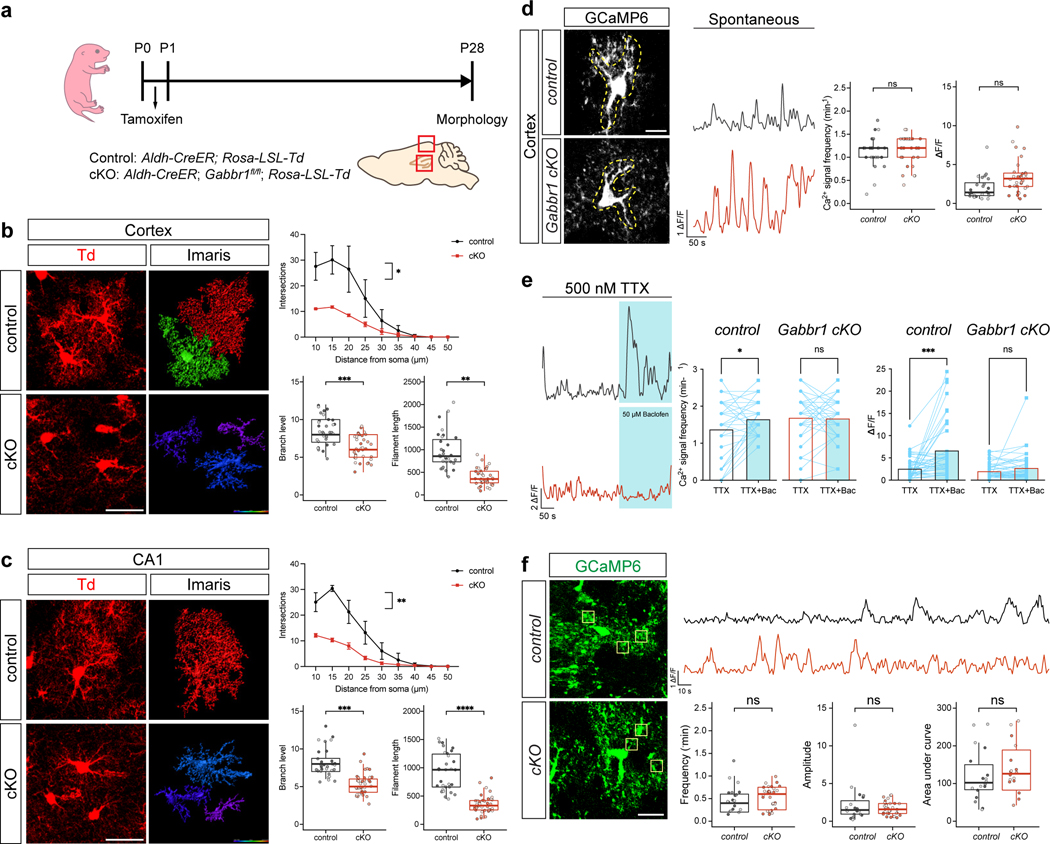
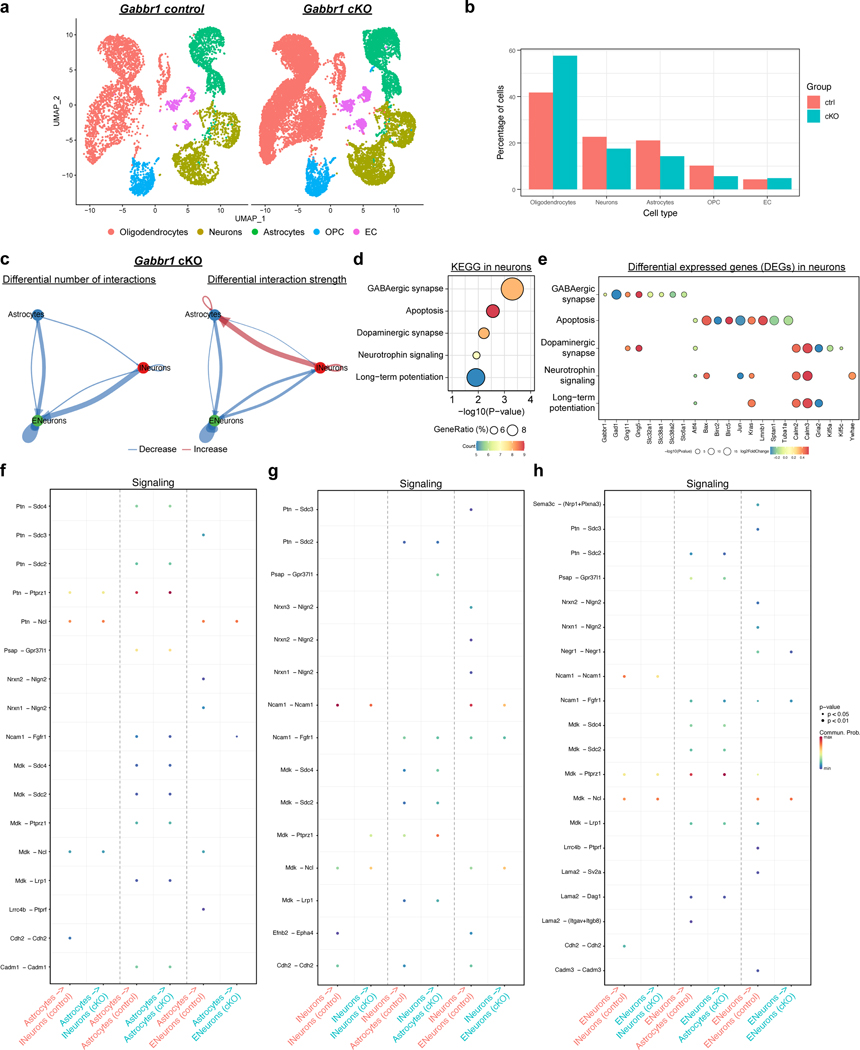
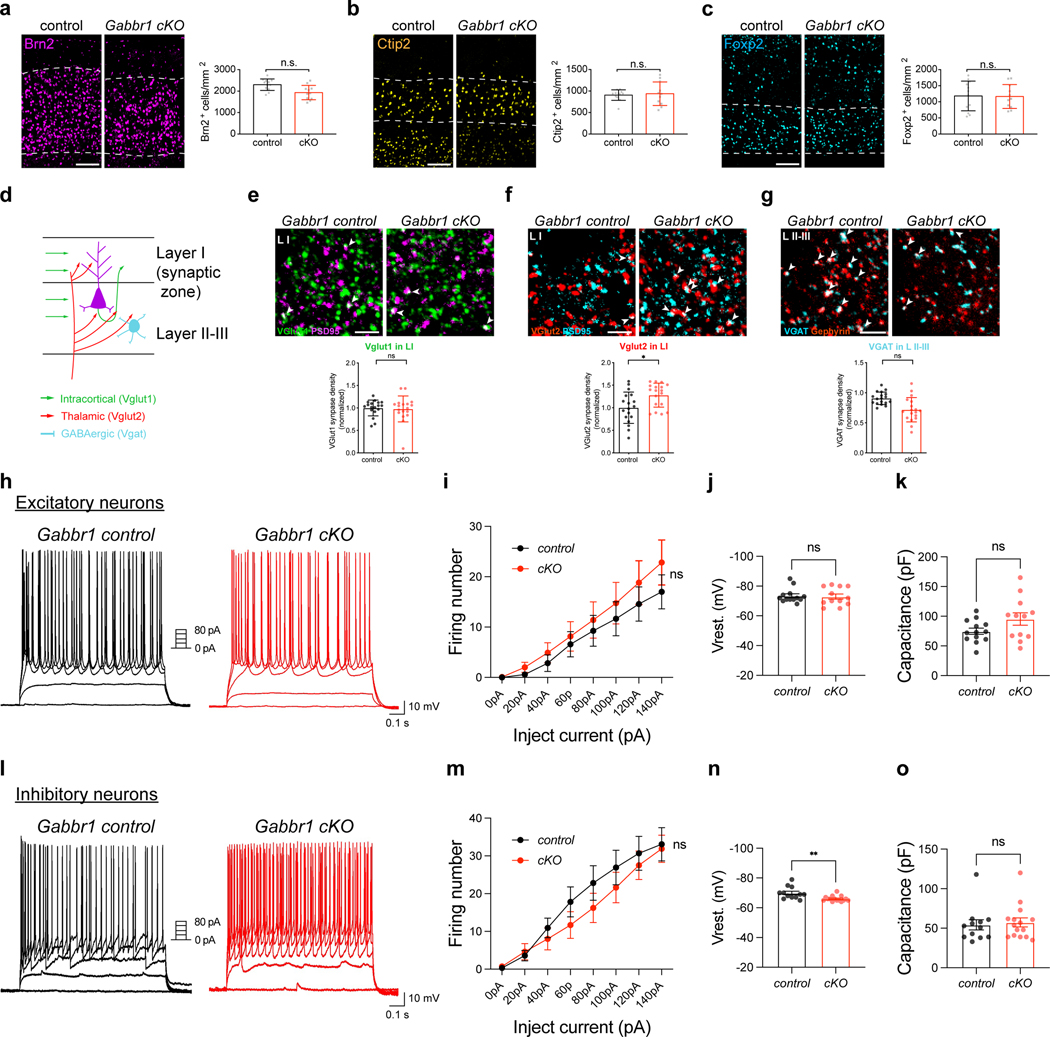
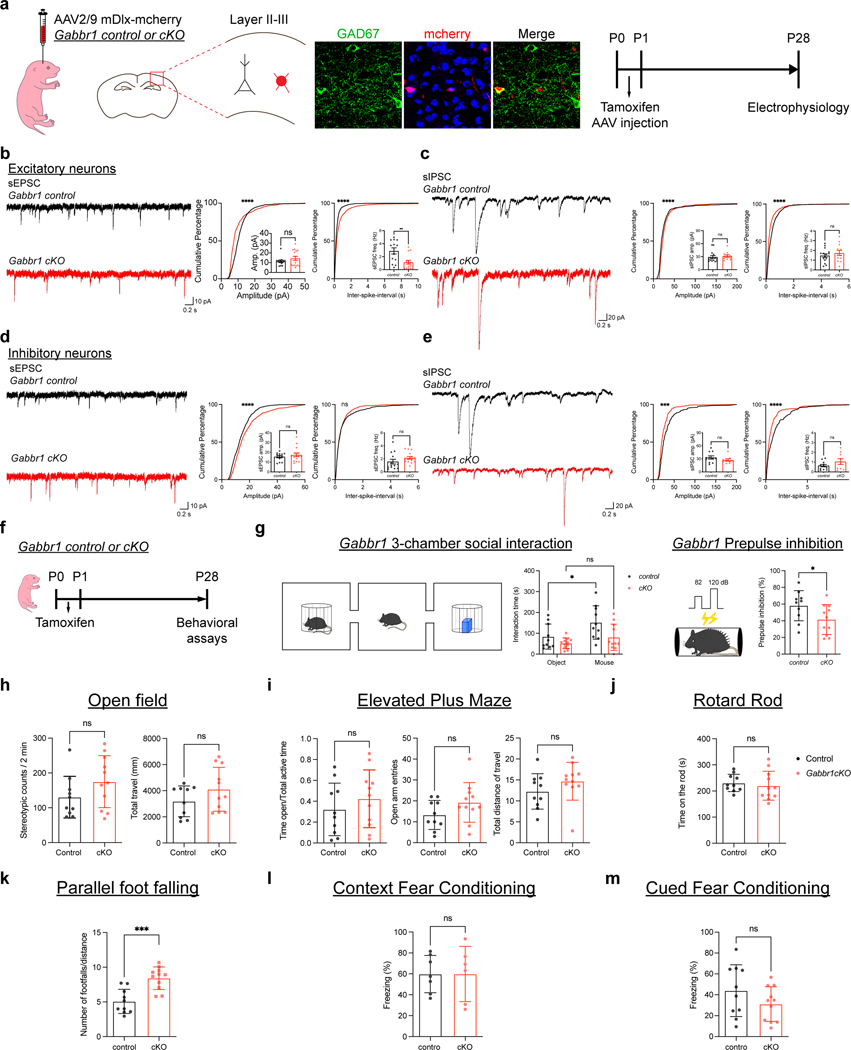
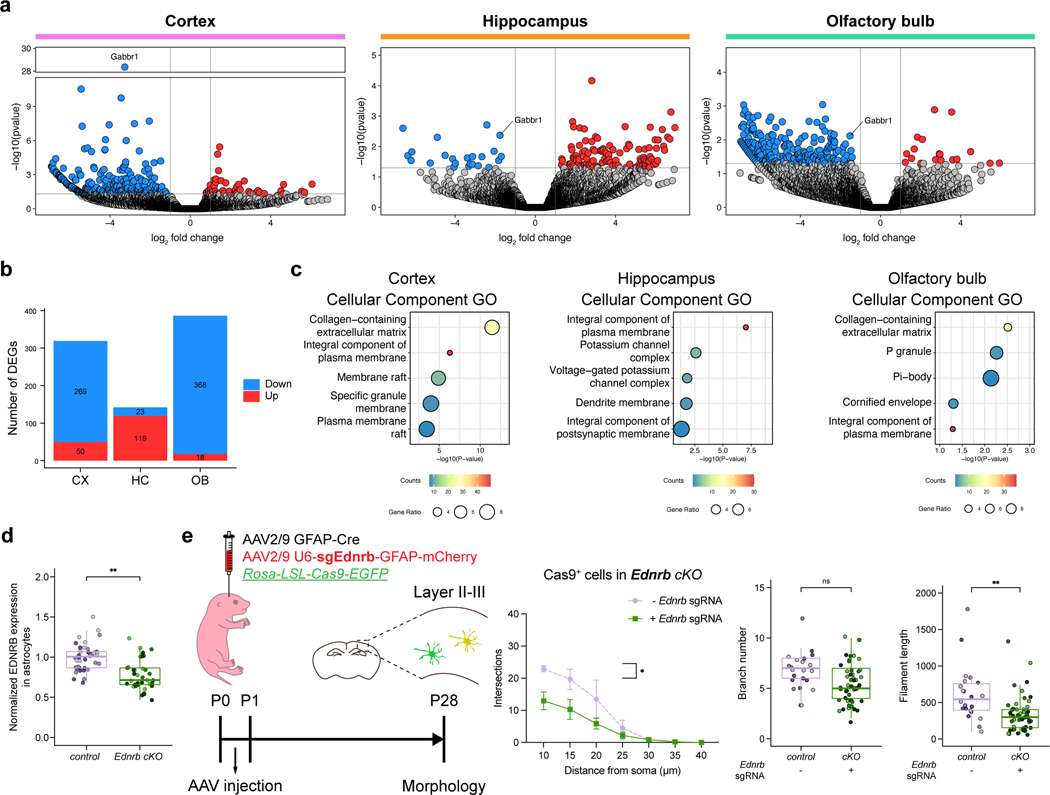
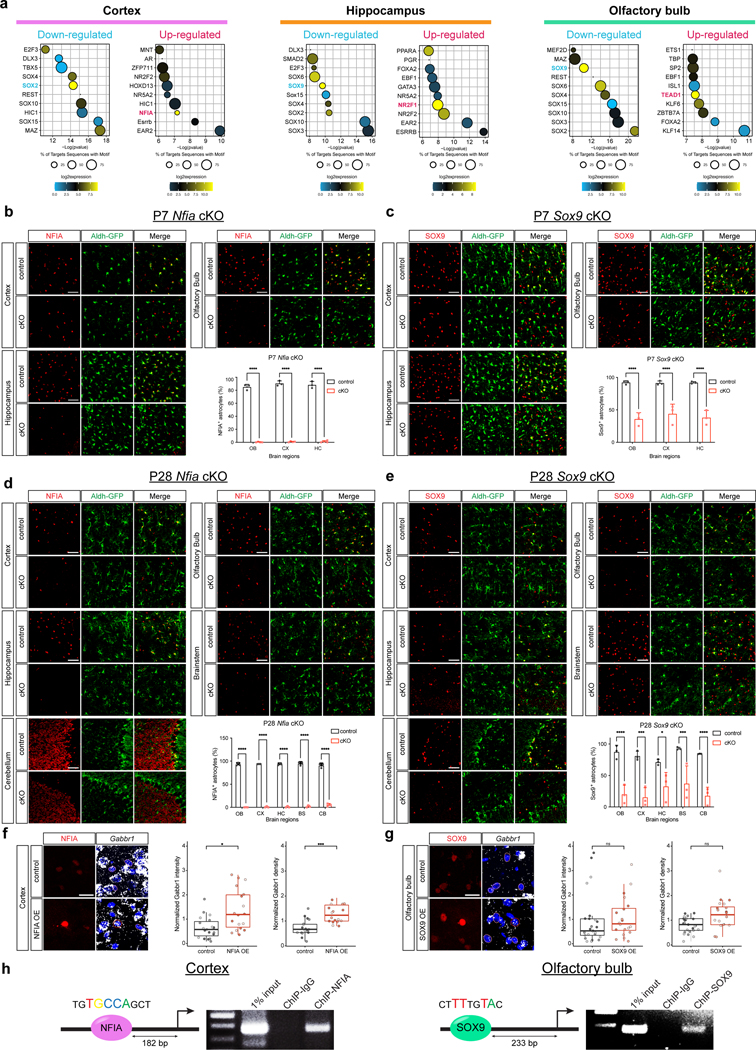
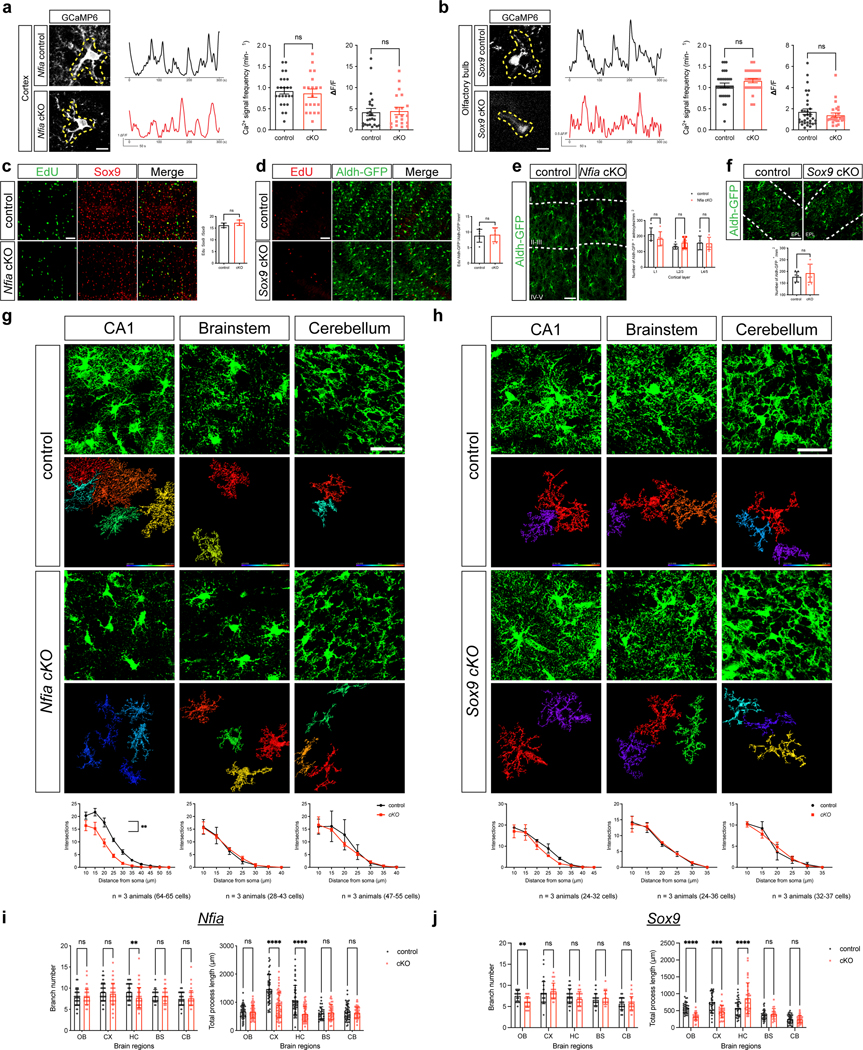
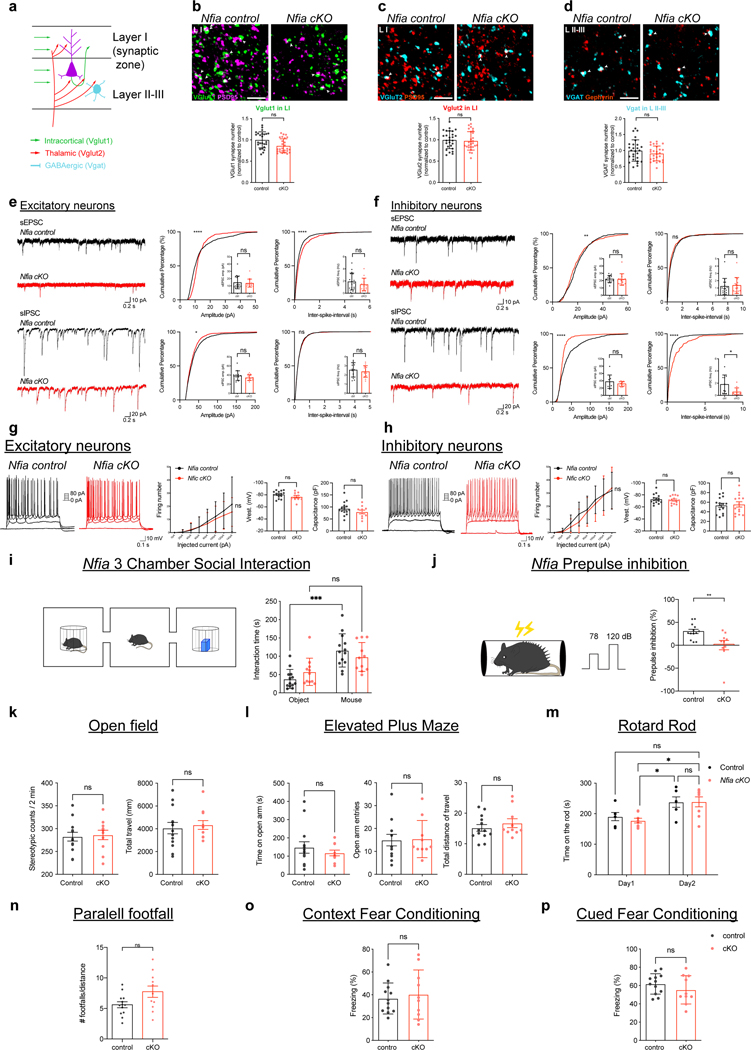
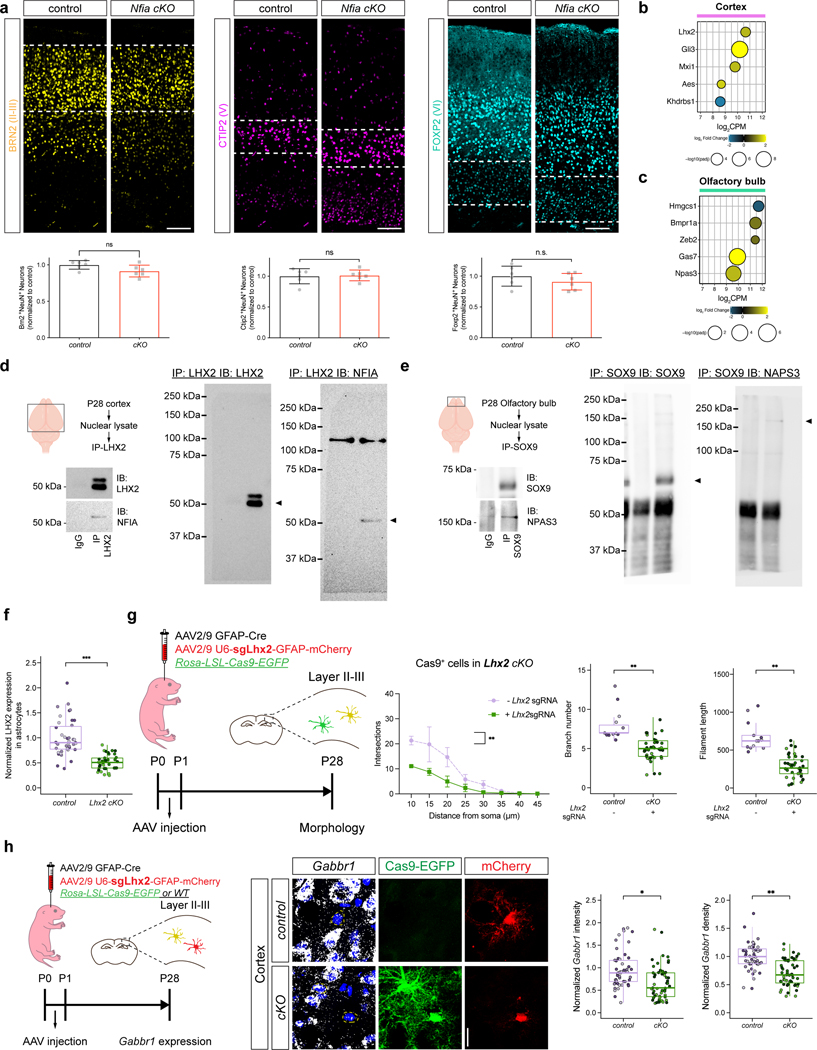
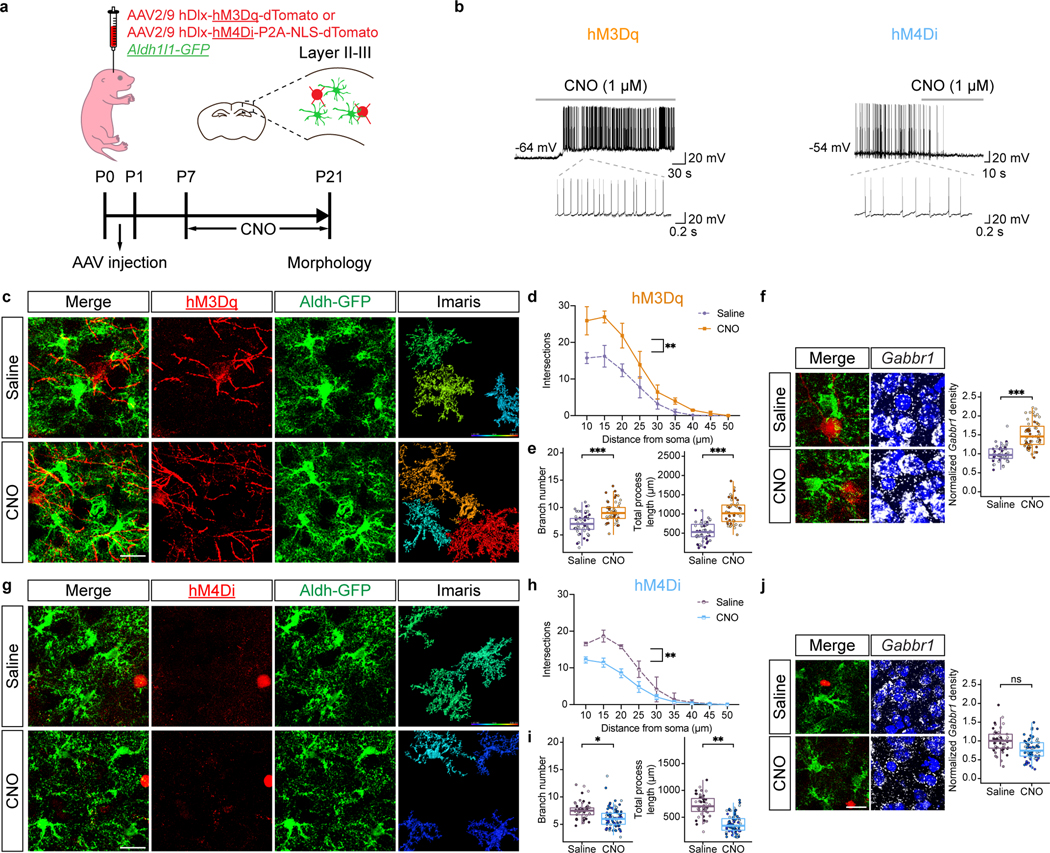
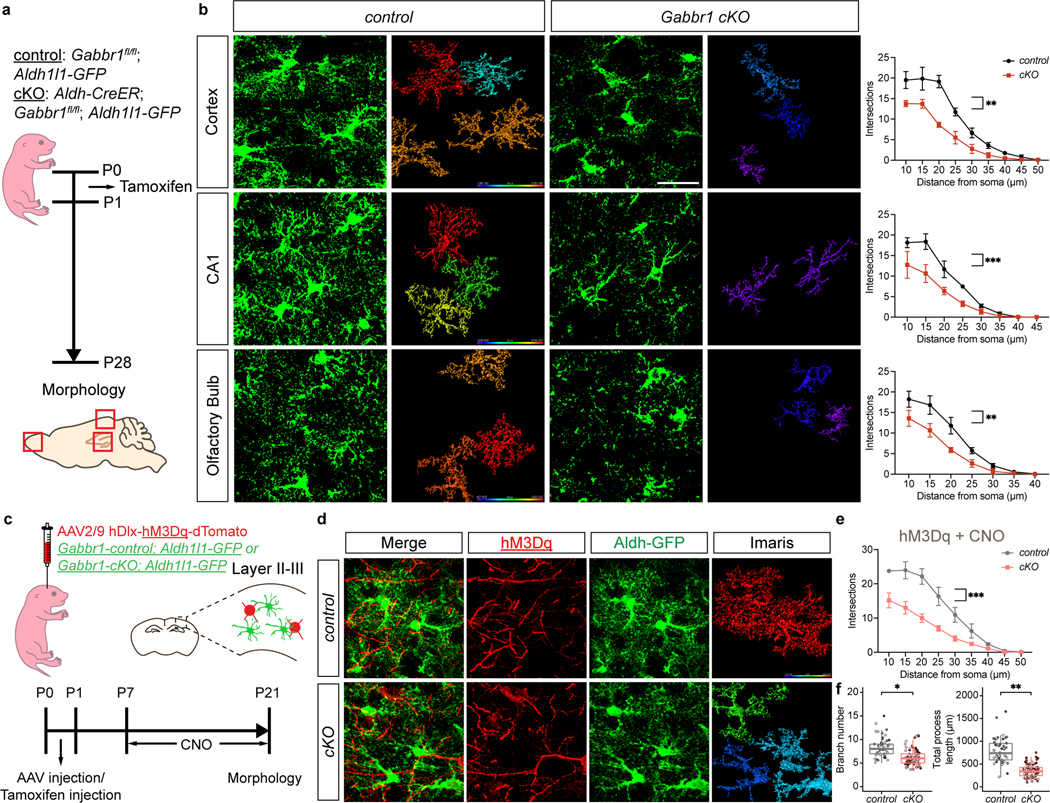
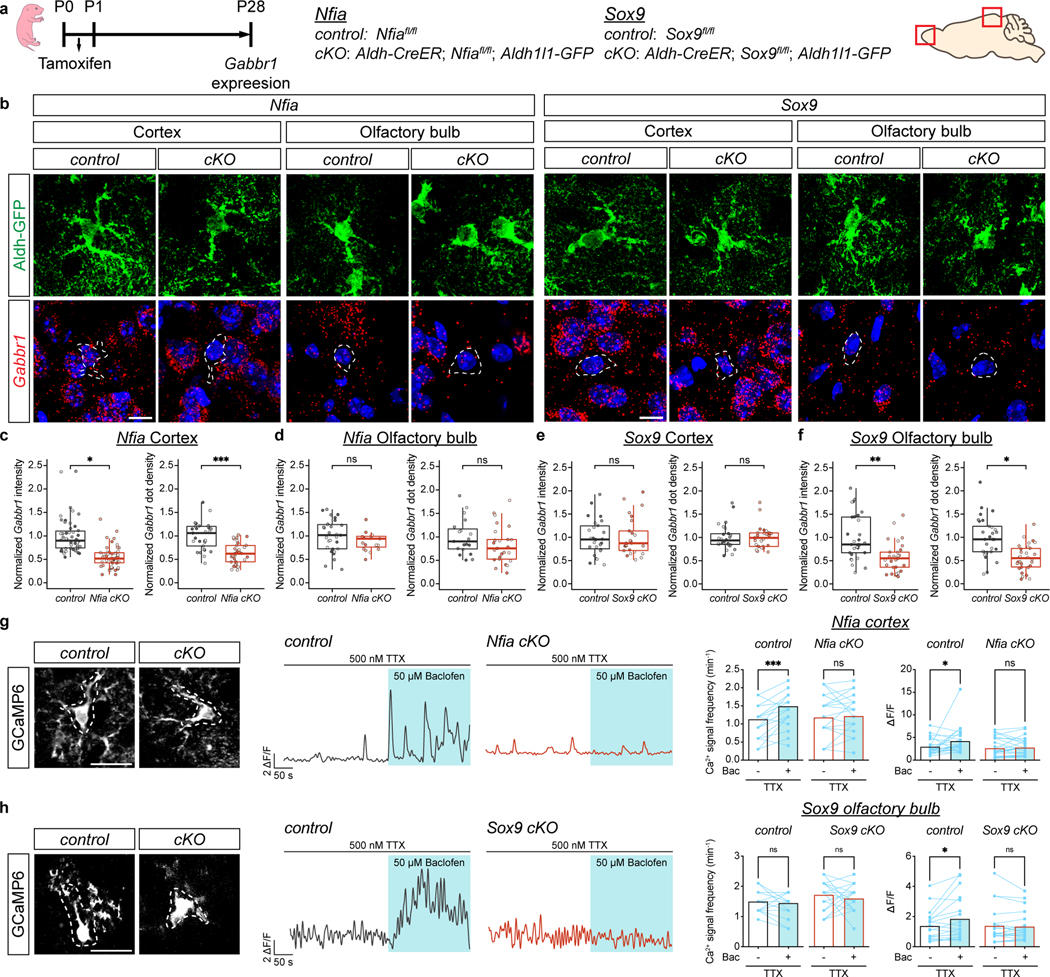
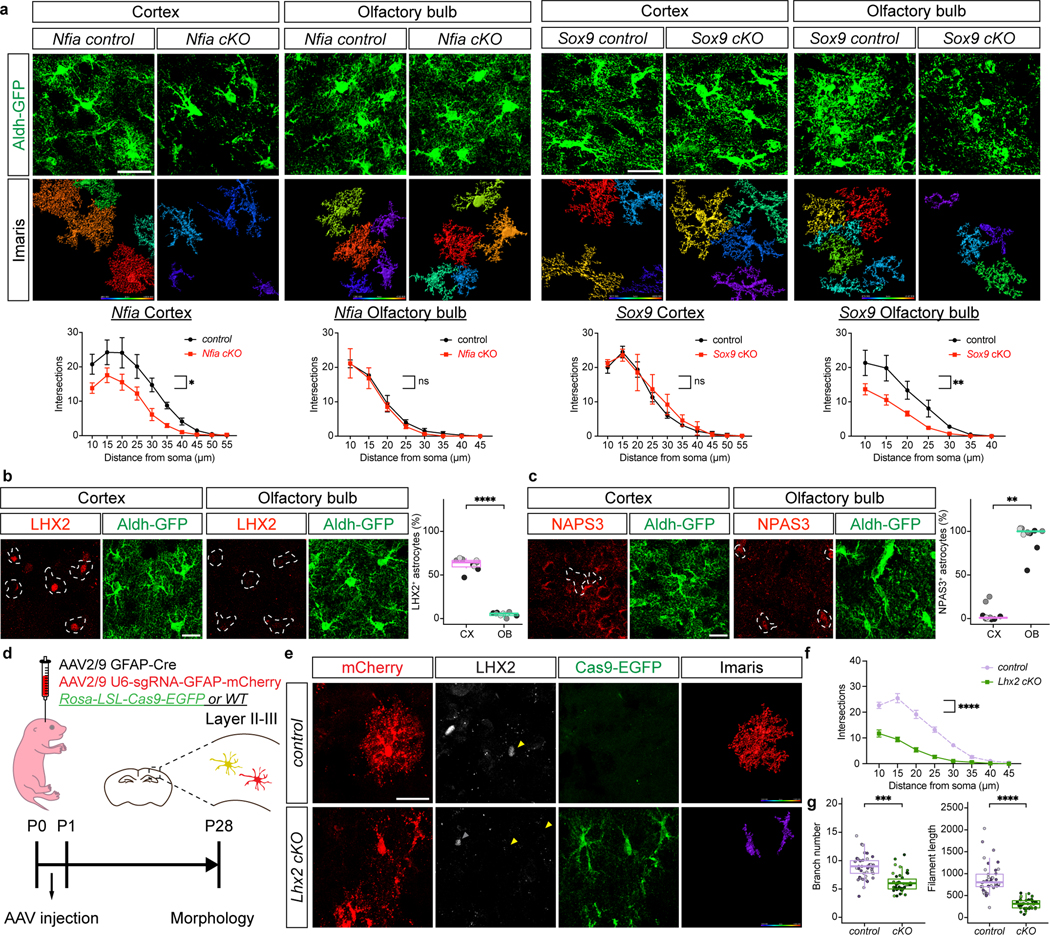
Communication between neurons and glia has an important role in establishing and maintaining higher-order brain function1. Astrocytes are endowed with complex morphologies, placing their peripheral processes in close proximity to neuronal synapses and directly contributing to their regulation of brain circuits2-4. Recent studies have shown that excitatory neuronal activity promotes oligodendrocyte differentiation5-7; whether inhibitory neurotransmission regulates astrocyte morphogenesis during development is unclear. Here we show that inhibitory neuron activity is necessary and sufficient for astrocyte morphogenesis. We found that input from inhibitory neurons functions through astrocytic GABAB receptor (GABABR) and that its deletion in astrocytes results in a loss of morphological complexity across a host of brain regions and disruption of circuit function. Expression of GABABR in developing astrocytes is regulated in a region-specific manner by SOX9 or NFIA and deletion of these transcription factors results in region-specific defects in astrocyte morphogenesis, which is conferred by interactions with transcription factors exhibiting region-restricted patterns of expression. Together, our studies identify input from inhibitory neurons and astrocytic GABABR as universal regulators of morphogenesis, while further revealing a combinatorial code of region-specific transcriptional dependencies for astrocyte development that is intertwined with activity-dependent processes.


Conflict of interest statement

Competing interests

The authors declare no competing interests.

Figures

Extended Data Figure 1.
Extended Data Figure 1.. Normalization of astrocyte morphology in the adult after developmental activation of inhibitory neurons
a-b. Analysis of SOX9 (e) and Ki67(f) expression within Aldh1l1-GFP astrocytes at P21 after activation of inhibitory neurons (or control); quantification was derived from n = 3 pairs of animals (a, 20,24 images; GLME; b, 12, 11 images; GLME). c. CNO only treatment of Aldh1l1-GFP mice from P7-P21 and analysis of astrocyte morphology at P21. n = 3 animals (39 cells; GLME model with Sidak’s multiple comparisons test). d. Heatmap depicting expression of GABA receptor subunits in developing astrocytes from the cortex (CX), hippocampus (HC), or olfactory bulb (OB) at P1, P7, and P14. See Extended Data Figure 2. d. Example of gating strategy and percentage of GFP+ astrocytes FACS isolated from P1 animal. e. Heatmap depicting expression of GABA receptor subunits in developing astrocytes from the cortex (CX), hippocampus (HC), or olfactory bulb (OB) at P1, P7, and P14. See Extended Data Figure 2. f. Schematic of DREADD-based activation of inhibitory neurons in post-natal Aldh1l1-GFP mice and experimental timeline. g. Imaging of P60 Aldh1l1-GFP astrocytes after hM3Dq activation of inhibitory neurons; quantification of morphological complexity using Scholl analysis, branch number, and total processes at P21; n = 3 pairs of animals (26,35 cells; upper, GLME model with Sidak’s multiple comparisons test; bottom, GLME model). Scale bars, 20 μm (a-c), 30 μm (g). Data represent mean ± s.d. (a-c, g upper), median, minimum value, maximum value and IQR (g bottom).
Extended Data Figure 2.
Extended Data Figure 2.. Transcriptomic RNA-Sequencing analysis of developing astrocytes in the cortex, hippocampus, and olfactory bulb at P1, P7, and P14.
a. Heatmap depicting the expression of neuron-specific and astrocyte-specific genes from P1, P7, and P14 FACS isolated Aldh1l1-GFP astrocytes from the listed brain regions. b. Aldh1l1-GFP astrocytes from the cortex at P1, P7, P14. Principal component (PC) analysis against top 2,000 variable genes across the region and timepoints examined from 3–4 animals in each group. c. Heatmap depicting differential patterns of gene expression in developing astrocytes across brain regions and timepoints. d. Gene Ontology (GO) analysis of the common and region-specific patterns of gene expression. e-f. Ald1l1-CreER; ROSA-LSL-tdTomato mouse line treated with tamoxifen at P1, harvested at P28. Co-immunostaining of tdTomato labeled cells with Sox9, Olig2, NeuN, and Iba1 demonstrating astrocyte-specific activity of Aldh1l1-CreER line. n = 4 animals. Scale bars, 10 μm (b), 40 μm (e-h).
Extended Data Figure 3.
Extended Data Figure 3.. Analysis of astrocyte development in the Gabbr1-cKO mouse line.
a. RNA-Scope imaging of Gabbr1 within Aldh1l1-GFP astrocytes from control and Gabbr1-cKO mouse lines; quantification derived from n = 3 pairs of animals (control: OB 18, CX 18, HC 16; cKO: OB 17, CX 19, HC 17 cells; LME model, ***P = 0.00020, ****P = 3.07e-06, **P = 0.0030). Dashed circle denotes astrocyte with Gabbr1. b. Antibody staining for SOX9 in Aldh1l1-GFP astrocytes from cortex of Gabbr1-cKO and control; quantification is derived from n = 3 pairs of animals (35 images; GLME model). c. Pulse-chase EdU-labeling and antibody staining at P28 from all brain regions analyzed; quantification is derived from n = 3 pairs of animals (Gabbr1 control: OB 9, CX 9, HC 9, BS 9, CB 9; Gabbr1 cKO: OB 8, CX 9, HC 9, BS 9, CB 9 images; GLME model). d-e. Imaging of Aldh1l1-GFP astrocytes from the brain stem and cerebellum at P28; quantification of morphological complexity was derived from n = 3 pairs of animals (Gabbr1 control: BS 28, CB 29; Gabbr1 cKO: BS 32, CB 29 cells; GLME model with Sidak’s multiple comparisons test, *P = 0.0179, 0.0167). f. Quantitative analysis of branch points and process length from all brain regions analyzed; n = 25–38 cells from 3 pairs of animals (Gabbr1 control: OB 38, CX 30, HC 29, BS 28, CB 25; Gabbr1 cKO: OB 33, CX 30, HC 29, BS 32, CB 29 cells; two way ANOVA, **P = 0.0014, *P = 0.0174, P = 0.9040, *P = 0.0132, P = 0.7126, **P = 0.0054, ****P < 0.0001, **P = 0.0066, P = 0.3763). Scale bars, 30 μm (d), 20 μm (c). Data represent mean ± s.d. (b-c, e-g median, minimum value, maximum value and IQR (a).
Extended Data Figure 4.
Extended Data Figure 4.. Analysis of Ca2+ activity and sparsely labeled astrocytes in Gabbr1-cKO astrocytes
a. Schematic describing the experimental timeline and mouse lines rendering astrocyte-specific knockout of Gabbr1 for sparse labeling experiments. b-c. Imaging and quantification of sparsely labeled, tdTomato-expressing astrocytes from Gabbr1-cKO and control mice from the cortex (b) and hippocampus (c); n = 3 pairs of animals (Gabbr1 control: CX 32, HC 30; Gabbr1 cKO: CX 36, HC 38 cells; b,c upper, GLME model with Sidak’s multiple comparisons test, *P = 0.0213, **P = 0.0012; b,c bottom, GLME model, ***P = 0.00043, **P = 0.0027, ***P = 0.00042, ****P<0.0001). d. Imaging of GCaMP6s activity in control and Gabbr1-cKO astrocytes from the cortex at P28; quantification is derived from n = 3 pairs of animals (24,33 cells; GLME model, P = 0.6361, 0.2239). e. Imaging of GCaMP6s activity in the presence of TTX and baclofen; quantification derived from n = 40 cells from 3 pairs of animals (two-tailed Wilcoxon matched-pairs signed rank test, *P = 0.022, P = 0.89, ***P = 0.0006, P = 0.32). f. Two-photon, slice imaging of GCaMP6s activity in control and Gabbr1-cKO astrocytes from the cortex at P28. Quantification of Ca2+ activity in astrocytic microdomains in the Gabbr1-cKO and control animals, quantification is derived from n = 3 pairs of animals (19, 30 cells; GLME model). Scale bars, 30 μm (b-c), 20 μm (d-f). Data represent mean ± s.d. (b-c, upper), median, minimum value, maximum value and IQR (b-c, lower, d, and f).
Extended Data Figure 5.
Extended Data Figure 5.. RNA-Seq of Gabbr1-cKO astrocytes and single cell RNA-Seq analysis of Gabbr1-cKO cortex.
a. Serut analysis of single cell RNA-Seq (scRNA-Seq) from Gabbr1-cKO and controls from P28 cortex. b. Quantification of cell clusters identifying CNS cell types from scRNA-Seq data. c. CellChat interaction diagram illustrating astrocyte interactions with neurons in the cortex from P28 Gabbr1-cKO mice; width of colored arrow indicates scale of interaction. See Extended Data Figure 4. d-e. KEGG pathway analysis of neurons from Gabbr1-cKO scRNA-Seq (d, analyzed by Enrichr) and dot plot of differentially expressed genes from KEGG (e, analyzed by Seurat FindMarkers). f-h. Dot plot summaries demonstrating CellChat interaction profiles and expression patterns of key astrocyte-neuron interaction pathways.
Extended Data Figure 6.
Extended Data Figure 6.. Analysis of cortical neurons in the Gabbr1-cKO mouse line.
a. Antibody staining for BRN2 (Layers II/II). b. CTIP2 (Layers V). c. FOXP2 (Layers VI) layer-specific neuronal markers in the P28 cortex from Gabbr1-cKO and control; quantification is derived from n = 11–12 images from 3 pairs of animals (control 12, cKO 11 images; GLME model). d. Schematic of synaptic markers and cortical layers. e-f. Antibody staining for makers of excitatory synapses Vglut1/PSD95 (e) and Vglut2/PSD95 (f) in layer I of the cortex from Gabbr1-cKO or control mice at P28 (n =3 pairs of animals; GLME model, *P = 0.0490). g. Antibody staining for markers of inhibitory synapses VGAT/Gephyrin at P28; quantification is derived from 3 pairs of animals (GLME model). h-k. Representative traces of action potential in layer II/III excitatory neurons upon varying injected current in Gabbr1-cKO and control (h). Summary data of action potential firing (i; two way ANOVA). Summary data of resting membrane potential (j; two-tailed unpaired Welch’s t-test) and threshold (k; two-tailed unpaired Welch’s t-test) from 3 pairs of animals (n = 13, 12 cells). l-o. Representative traces of action potential in layer II/III inhibitory neurons upon varying injected current in Gabbr1-cKO and control (l). Summary data of action potential firing (m; two way ANOWA). Summary data of resting membrane potential (n; two-tailed unpaired Welch’s t-test, **P = 0.0091) and threshold (o; two-tailed unpaired Welch’s t-test) from 3 pairs of animals (n = 12, 15 cells). Scale bars, 100 μm (a-c), 3 μm (e-f). Data represent mean ± s.d. (a-c, e-g), mean ± s.e.m. (i-k, m-o).
Extended Data Figure 7.
Extended Data Figure 7.. Loss of astrocytic Gabbr1 disrupts cortical circuit function
a. Schematic of viral labeling of inhibitory neurons and experimental timeline. b-e. Representative traces of spontaneous EPSCs and IPSCs from excitatory and inhibitory neurons from cortex of Gabbr1-cKO and controls. Associated cumulative and bar plots demonstrate quantification of sEPSC and sIPSC from 3 pairs of animals (b, n = 13, 15 cells; Kolmogorov-Smirnov test, **** P < 0.0001; two-tailed Mann-Whitney test, P = 0.8207, **P = 0.003; c, n = 15, 12 cells; Kolmogorov-Smirnov test, **** P < 0.0001; two-tailed Mann-Whitney test, P = 0.1995, 0.5888; d, n = 13, 15 cells; Kolmogorov-Smirnov test, **** P < 0.0001; two-tailed Mann-Whitney test, P = 0.7856, 0.0504; e, n = 11, 9 cells; Kolmogorov-Smirnov test, **** P < 0.0001; two-tailed Mann-Whitney test, P = 0.2299, 0.3796). f. Experimental timeline for behavioral analysis. g. 3-chamber social interaction and pre-pulse inhibition studies on Gabbr1-cKO and control mice from 10 animals in control group and 11 animals in cKO group. (left, GLME model with Sidak’s multiple comparisons test, *P = 0.015; right, two-tailed Mann-Whitney test, *P = 0.043). h-m. Summary of behavioral assays conducted on Gabbr1-cKO and control animals including open field (h), elevated plus maze (i), rotarod (j), parallel foot fall (k), contextual fear conditioning (l), and cued fear conditioning (m) on Gabbr1-cKO and control mice from 10 animals in control group and 11 animals in cKO group (two-tailed Mann-Whitney test, ***P = 0.0004) Data represent mean ± s.e.m. (b-e), s.d. (g-m).
Extended Data Figure 8.
Extended Data Figure 8.. Transcriptomic analysis of Gabbr1-cKO astrocytes an
a. Volcano plots from RNA-Seq analysis of control and Gabb1-cKO astrocytes from cortex, hippocampus, and OB. b. Table of the number of differentially expressed genes (DEGs) from each region. c. Gene Ontology (GO) analysis of DEGs performed with Enrichr. d. Quantification of EDNRB expression in virally labeled astrocytes from the P28 cortex of mice where it has been knocked out using guideRNAs in the ROSA-LSL-Cas9-EGFP mouse line; quantification is derived from n = 3 pairs of animals (37, 38 cells; LME model, **P = 0.0068). e. Imaging of virally labeled astrocytes from the P28 cortex of Ednrb-cKO mice where Ednrb has been knocked out using guideRNAs in the ROSA-LSL-Cas9-EGFP mouse line; quantification of morphological complexity via Scholl analysis was derived from n = 3 animals (f, Ednrb-cKO: 22 mcherryCas9-EGFP+ cells, 49 mcherry+Cas9-EGFP+ cells; GLME model with Sidak’s multiple comparisons test, *P = 0.0307; GLME model, P = 0.06, **P = 0.008). Data represent mean ± s.d. (e left), median, minimum value, maximum value and IQR (d, e right).
Extended Data Figure 9.
Extended Data Figure 9.. Analysis of astrocyte development in the Sox9-cKO and Nfia-cKO mouse lines.
a. Homer transcription factor motif analysis on differentially expressed genes (DEGs) from P1 and P14 timepoints from astrocytes isolated from the cortex, hippocampus, and olfactory bulb. b. Analysis of NFIA expression in Aldh1l1-GFP astrocytes from the Nfia-cKO and control at P7 in the cortex, hippocampus, and olfactory bulb; quantification of knockout efficiency was derived from 3 pairs of animals (two-way ANOVA, ****P<0.0001). c. Analysis of SOX9 expression in Aldh1l1-GFP astrocytes from the Sox9-cKO and control at P7 in the cortex, hippocampus, and olfactory bulb; quantification of knockout efficiency was derived from 3 pairs of animals (two-way ANOVA, ****P<0.0001). d. Analysis of NFIA expression in Aldh1l1-GFP astrocytes from the Nfia-cKO and control at P28 in the cortex, hippocampus, cerebellum, and olfactory bulb; quantification of knockout efficiency was derived from 3 pairs of animals (two-way ANOVA, ****P<0.0001). e. Analysis of SOX9 expression in Aldh1l1-GFP astrocytes from the Sox9-cKO and control at P28 in the cortex, hippocampus, cerebellum, and olfactory bulb; quantification of knockout efficiency was derived from 3 pairs of animals (two-way ANOVA, ****P<0.0001, *P = 0.0205). f. AAV-based overexpression of NFIA in the developing cortex, analysis of Gabbr1 expression at P28 via RNAscope; n = 3 pairs of animals (19, 18 cells; LME model, *P = 0.023, ***P = 0.00034). g. AAV-based overexpression of SOX9 in the developing olfactory bulb, analysis of Gabbr1 expression at P28 via RNAscope; n = 3 pairs of animals (20,25 cells). h. Chromatin immunoprecipitation of NFIA from P28 cortex or SOX9 from P28 olfactory bulb (OB), followed by PCR detection of association with motif in proximal promoter region of Gabbr1. Scale bars, 50 μm (b-e), 10 μm (f-g). Data represent mean ± s.d. (b-e), median, minimum value, maximum value and IQR (f-g).
Extended Data Figure 10.
Extended Data Figure 10.. Analysis of astrocyte morphogenesis in the Sox9-cKO and Nfia-cKO mouse lines.
a-b. Two-photon, slice imaging of spontaneous GCaMP6s activity in control and Nfia-cKO astrocytes from the cortex at P28 (a) or control and Sox9-cKO astrocytes from the olfactory bulb at P28 (b); quantification is derived from 3 pairs of animals (two-tailed Mann-Whitney test). c-d. Pulse-chase EdU-labeling and antibody staining at P28 from the cortex of Nfia-cKO (c) and olfactory bulb of Sox9-cKO (d); quantification is derived from 3 pairs of animals (two-tailed Mann-Whitney test). e-f. Quantification of the number of Aldh1l1-GFP astrocytes in the cortex of the Nfia-cKO (e) or olfactory bulb from Sox9-cKO (f) and associated controls; quantification is derived from 3 pairs of animals (two-tailed Mann-Whitney test). g-h. Imaging of Aldh1l1-GFP astrocytes from the hippocampus, brainstem, and cerebellum at P28 from the Nfia-cKO (g) or Sox9-cKO (h) and associated controls; quantification of morphological complexity via Scholl analysis was derived from n = 3 pairs of animals (g, Nfia control: HC 64, BS 28, CB 47; Nfia cKO: HC 65, BS 43, CB 55 cells; GLME model with Sidak’s multiple comparisons test, **P = 0.0015; h, Sox9 control: HC 32, BS 36, CB 32; Sox9 cKO: HC 24, BS 24, CB 37; GLME model with Sidak’s multiple comparisons test). i-j. Quantification of astrocytic branch number and process length from Nfia-cKO (i) or Sox9-cKO (j) across cortex, olfactory bulb, hippocampus, brainstem, and cerebellum; derived from n = 3 pairs of animals (i, Nfia control: OB 59, CX 43, HC 54, BS 27, CB 48; Nfia cKO: OB 50, CX 56, HC 59, BS 38, CB 54 cells; two-way ANOVA, **P = 0.0054, ****P <0.0001; j, Sox9 control: OB 29, CX 31, HC 32, BS 37, CB 33; Sox9 cKO: OB 40, CX 27, HC 33, BS 21, CB 39; two-way ANOVA, **P = 0.0025, ****P < 0.0001, ***P = 0.0002). Scale bars, 10 μm (a-b), 50 μm (c-f), 30 μm (g-h). Data represent mean ± s.d. (a-f,i-j).
Extended Data Figure 11.
Extended Data Figure 11.. Electrophysiological and behavioral analysis of the Nfia-cKO mouse line.
a. Schematic of synaptic markers and cortical layers. b-c. Antibody staining for makers of excitatory synapses Vglut1/PSD95 (b) and Vglut2/PSD95 (c) in layer I of the cortex from NFIA-cKO or control mice at P28, quantification is derived from 3 pairs of animals (GLME model). d. Antibody staining for markers of inhibitory synapses VGAT/Gephyrin at P28; quantification is derived from 3 pairs of animals (GLME model). e-f. Representative traces of spontaneous EPSCs and IPSCs from excitatory (e) and inhibitory (f) neurons from cortex of Nfia-cKO and controls. Associated cumulative and bar plots demonstrate quantification of amplitude and frequency of sEPSC and sIPSC from 3 pairs of animals (e, Kolmogorov-Smirnov test, **** P < 0.0001, *P = 0.0181, two-tailed Mann-Whitney test; f, Kolmogorov-Smirnov test, **P = 0.0026, **** P < 0.0001, two-tailed Mann-Whitney test, *P = 0.0149). g-h. Representative traces of action potential in layer II/III neurons upon varying injected current in Nfia-cKO and control. Summary data of action potential firing, resting membrane potential, and threshold from excitatory neurons (g) and inhibitory neurons (h); quantification is derived from at least 3 pairs of animals (two-way ANOVA and two-tailed Mann-Whitney test). i-j. 3-chamber social interaction and prepulse inhibition behavioral studies on Nfia-cKO and control mice from 11–13 animals in each group (i, n = 13 pairs of animals, two-way ANOVA, ***P = 0.0002; j, n = 13, 11 animals, two-tailed Mann-Whitney test, **P = 0.0050). k-p. Summary of behavioral tests from NFIA-cKO and control, including open field; n = 13, 11 animals (k), elevated plus maze; n = 10 animals (l), rotarod; n = 5, 8 animals (m), parallel footfall; n = 13, 11 animals (n), contextual fear conditioning; n = 12, 10 animals (o), and cued fear conditioning; n = 12, 10 animals (p) (two-tailed Mann-Whitney test, *P = 0.0265, 0.0136). Scale bars, 3 μm (b-d). Data represent mean ± s.d. (b-d, i, o-p), mean ± s.e.m. (e-h, j-n)
Extended Data Figure 12.
Extended Data Figure 12.. Analysis of cortical neurons in the Nfia-cKO mouse line and co-immunoprecipitation with Lhx2 and NPAS3.
a. Antibody staining for BRN2 (Layers II/II), CTIP2 (Layers V), and FOXP2 (Layers VI) layer-specific neuronal markers in the P7 cortex from Nfia-cKO and control; quantification is derived from n = 3 pairs of animals (6 images, GLME model). b. CX-specific transcription factor DEGs increased between P7-P14. c. OB-specific transcription factor DEGs increased between P7-P14. d. Immunoprecipitation of LHX2 and immunoblot of LHX2 and NFIA from the P28 cortex; arrow heads label the proteins of interest. e. Immunoprecipitation of NPAS3 and immunoblot of NPAS3 and SOX9 from P28 cortex; arrow heads label the proteins of interest. f. Quantification of LHX2 expression in virally labeled astrocytes from the P28 cortex of mice where it has been knocked out using guideRNAs in the ROSA-LSL-Cas9-EGFP mouse line; quantification is derived from n = 3 pairs of animals (37, 39 cells; GLME model, ***P = 0.00099). g. Imaging of virally labeled astrocytes from the P28 cortex of Lhx2-cKO mice where Lhx2 has been knocked out using guideRNAs in the ROSA-LSL-Cas9-EGFP mouse line; quantification of morphological complexity via Scholl analysis was derived from n = 3 animals (Lhx2-cKO: 13 mcherryCas9-EGFP+ cells, 40 mcherry+Cas9-EGFP+ cells; GLME model with Sidak’s multiple comparisons test, **P = 0.0037; GLME model, **P = 0.006, 0.003). h. RNAscope for Gabbr1 expression in Cas9-EGFP cortical astrocytes lacking Lhx2 and controls at P28; quantitative analysis demonstrating reduction of Gabbr1 expression is derived from n = 3 pairs of animals (51,55 cells; GLME model, *P = 0.015; LME model, **P = 0.0003). Scale bars, 100 μm (a), 20 μm (m). Data represent mean ± s.d. (a, g right), median, minimum value, maximum value and IQR (f, g left, h).
Figure 1.
Figure 1.. Inhibitory neuron activity regulates astrocyte morphogenesis
a. Schematic of DREADD-based activation of inhibitory neurons in post-natal Aldh1l1-GFP mice. b. Slice electrophysiological recordings of DREADD-expressing (hM3Dq or hM4Di) inhibitory neurons at P21, with and without CNO activation. Traces are representative of neuronal firing. c-e. Imaging of Aldh1l1-GFP astrocytes after hM3Dq activation of inhibitory neurons; quantification using Scholl analysis, branch number, and total processes at P21; n = 3 pairs of animals (47, 51 cells; d, generalized linear mixed-effects (GLME) model with Sidak’s multiple comparisons test, **P = 0.001; e, linear mixed-effect (LME) model, ***P = 0.00012, 0.00013). f. RNAscope imaging and quantitative analysis for Gabbr1 expression in Alhd1l1-GFP expressing astrocytes at P21; n = 3 pairs of animals (49, 59 cells; LME model, ***P = 0.00090). Dashed circle denotes astrocyte with Gabbr1. g-i. Imaging of Aldh1l1-GFP astrocytes after hM4Di inhibition of inhibitory neurons; quantification using Scholl analysis, branch number, and total processes at P21; n = 3 and 4 animals (44, 71 cells; h, GLME model with Sidak’s multiple comparisons test, **P = 0.0013; i-j, GLME model, *P = 0.0327, **P = 0.0014). j. RNAscope imaging and quantitative analysis for Gabbr1 expression in Alhd1l1-GFP expressing astrocytes at P21; n = 3 and 4 animals (49, 64 cells; LME model, P = 0.1014). Dashed circle denotes astrocyte with Gabbr1. Scale bars, 20 μm (c, g, j) and 10 μm (f). Data represent mean ± s.d. (d, h), median, minimum value, maximum value and interquartile range (IQR) (e-f bottom, i-j).
Figure 2.
Figure 2.. Gabbr1 is required for astrocyte morphogenesis
a. Experimental timeline and mouse lines rendering astrocyte-specific knockout of Gabbr1. b. Imaging of Aldh1l1-GFP astrocytes from the cortex, CA1 of the hippocampus, and olfactory bulb at P28; quantification via Scholl analysis derived from n = 3 pairs of animals (control: OB 43, CX 27, HC 32, cKO: OB 31, CX 33, HC 30 cells; GLME model with Sidak’s multiple comparisons test, **P = 0.0011, *** P = 0.0006, **P = 0.0037). c. DREADD-based activation of inhibitory neurons in Gabbr1-cKO mice. d-f. Imaging of Aldh1l1-GFP astrocytes from Gabbr1-cKO (and control) after hM3Dq activation of inhibitory neurons; quantification using Scholl analysis, branch number, and total processes at P21; n = 3 and 5 animals (50, 80 cells; e, GLME model with Sidak’s multiple comparisons test, **P = 0.0011; f, GLME model, *P = 0.034, **P = 0.0026). Scale bars, 30 μm (b), and 20 μm (d). Data represent mean ± s.d. (b, e), median, minimum value, maximum value and IQR (f).
Figure 3.
Figure 3.. Gabbr1 regulates astrocyte morphology through Ednrb1
a. Immunostaining for EDNRB in P28 astrocytes from Gabbr1-cKO and control astrocytes. b. Quantification of EDNRB expression in Gabbr1-cKO and control from n = 6 pairs of animals (two-tailed Mann-Whitney test, *P = 0.041, 0.015, P = 0.1320). c. Schematic and timeline of selective deletion of Ednrb in cortical astrocytes. d-f. Imaging of virally labeled astrocytes from the P28 cortex of mice where Ednrb has been knocked out using guideRNAs in the ROSA-LSL-Cas9-EGFP mouse line; quantification via Scholl analysis was derived from n = 3 pairs of animals (53, 49 cells; e, GLME model with Sidak’s multiple comparisons test, **P = 0.001; f, GLME model, **P = 0.001, ***P = 0.0002). Scale bars, 20 μm (a), 30 μm (d). Data represent mean ± s.d. (e), median, minimum value, maximum value and IQR (b, f).
Figure 4.
Figure 4.. Region-specific regulation of Gabbr1 by SOX9 and NFIA
a. Schematic depicting mouse lines and experimental timelines. b-f. RNAscope imaging of Gabbr1 expression in Aldh1l1-GFP astrocytes from Nfia-cKO, Sox9-cKO and associated controls at P28; quantitative analysis of Gabbr1 expression is derived from n = 3 pairs of animals (c, 50, 50, 29, and 33 cells; GLME model, *P = 0.022; LME model ***P = 0.0002; d, 29, 19, 19, and 25 cells; LME model, P = 0.17, 0.27; e, 26, 25, 26, and 29 cells; GLME model, P = 0.91, 0.95; f, 30, 29, 29, 30 cells; LME model, **P = 0.0094, *P = 0.014). Dashed circle denotes astrocyte with Gabbr1. g-h. Imaging of GCaMP6s activity from the cortex of Nfia-cKO mice or the OB from Sox9-cKO mice (and controls) in the presence of TTX and baclofen; quantification is derived from n = 19–26 cells from 3 pairs of animals (g, 23, 26 cells, two-tailed Wilcoxon matched-pairs signed rank test, ***P = 0.0001, P = 0.53, *P = 0.048, P = 0.37; h, 19 20 cells, two-tailed Wilcoxon matched-pairs signed rank test, P = 0.65, 0.45, *P = 0.012, P = 0.81). Scale bars, 10 μm (b) and 20 μm (g-h). Data represent median, minimum value, maximum value and IQR (c-f).
Figure 5.
Figure 5.. Regulation of astrocyte morphogenesis by region-specific mechanisms
a. Imaging of Aldh1l1-GFP astrocytes at P28 from the Sox9-cKO and Nfia-cKO; quantification via Scholl analysis was derived from n = 3 pairs of animals (Nfia control: OB 56, CX 52, Nfia cKO: OB 60, CX 48, Sox9 control: OB 29, CX 35, Sox9 cKO: OB 39, CX 33 cells; GLME model with Sidak’s multiple comparisons test, *P = 0.015, P = 0.41, 0.60, **P = 0.0097). b. Immunostaining for LHX2 in P28 astrocytes quantified from n = 3 pairs of animals (LME model, ****P = 1.31e-12). c. Immunostaining for NPAS3 in P28 astrocytes quantified from n = 3 pairs of animals (GLME model, **P = 0.0013). d-g. Imaging of virally labeled astrocytes lacking Lhx2 from P28 cortex; quantification via Scholl analysis was derived from n = 3 pairs of animals (41,41 cells; f, GLME model with Sidak’s multiple comparisons test, ****P = 1.29e-24; g, GLME model, ***P = 0.00099, ****P = 3.98e-05). Scale bars, 30 μm (a, e), 20 μm (b, c). Data represent mean ± s.d. (a, f), median, minimum value, maximum value and IQR (b, c, g,).

Update of

References

    1. Allen NJ & Lyons DA Glia as architects of central nervous system formation and function. Science 362, 181–185 (2018). - PMC - PubMed
    1. Allen NJ Astrocyte Regulation of Synaptic Behavior. Annu. Rev. Cell Dev. Biol. 30, 439–463 (2014). - PubMed
    1. Khakh BS & Deneen B. The Emerging Nature of Astrocyte Diversity. Annu Rev Neurosci 42, 187–207 (2019). - PubMed
    1. Volterra A. & Meldolesi J. Astrocytes, from brain glue to communication elements: the revolution continues. Nat Rev Neurosci 6, 626–640 (2005). - PubMed
    1. Baraban M, Koudelka S. & Lyons DA Ca2+ activity signatures of myelin sheath formation and growth in vivo. Nat Neurosci 21, 19–23 (2018). - PMC - PubMed

Publication types

MeSH terms