. 2023 May;617(7960):386-394.
doi: 10.1038/s41586-023-06017-4. Epub 2023 Apr 26.

A druggable copper-signalling pathway that drives inflammation

Affiliations

A druggable copper-signalling pathway that drives inflammation

Stéphanie Solier et al. Nature. 2023 May.

Abstract

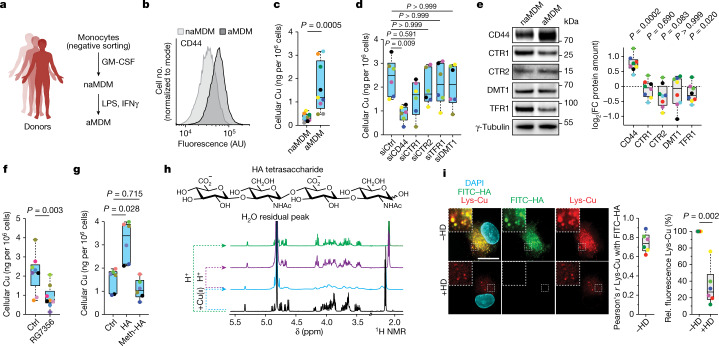
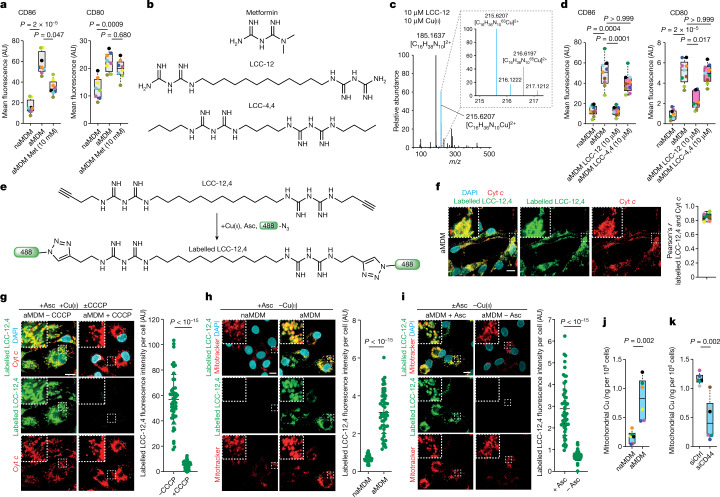
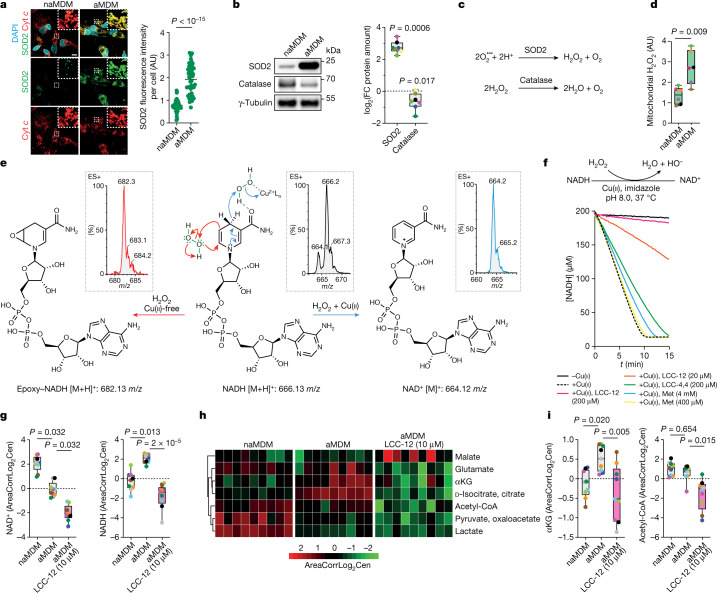
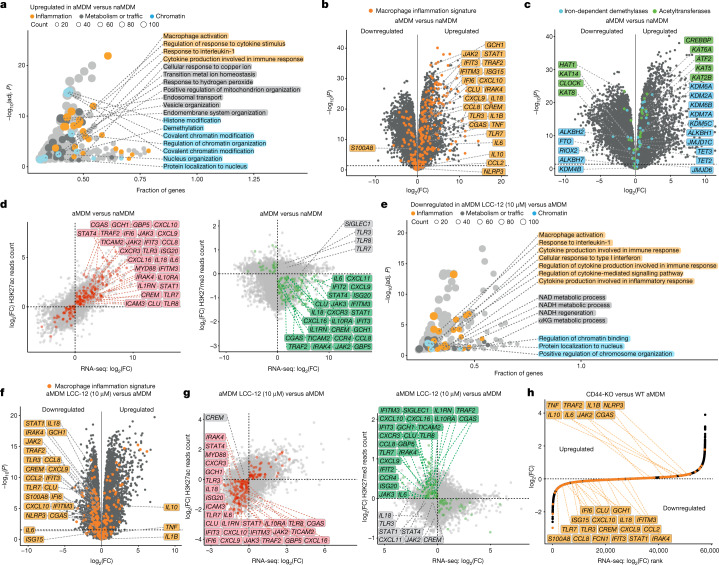
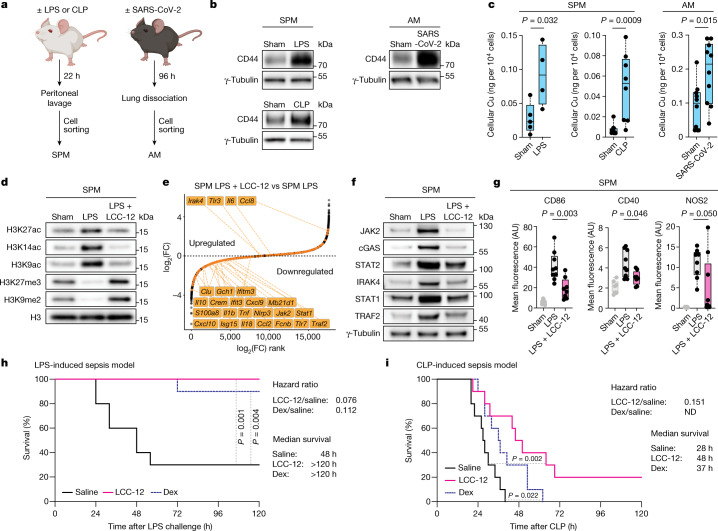
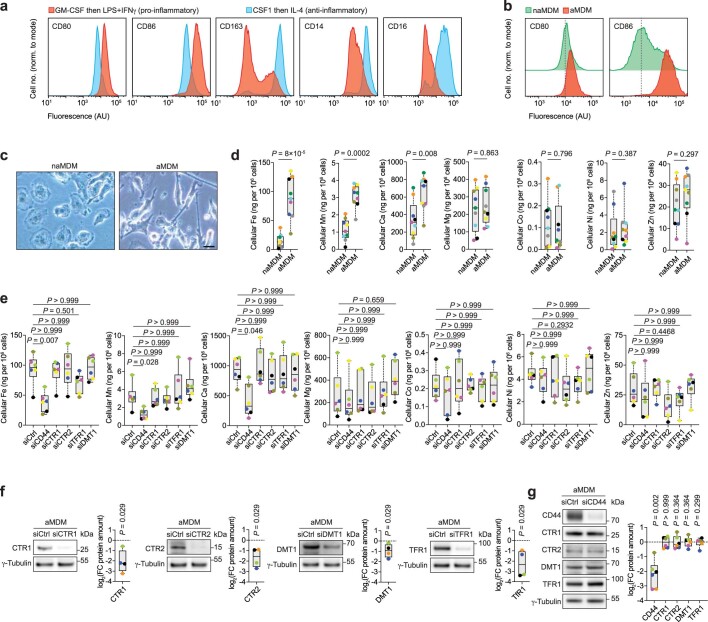
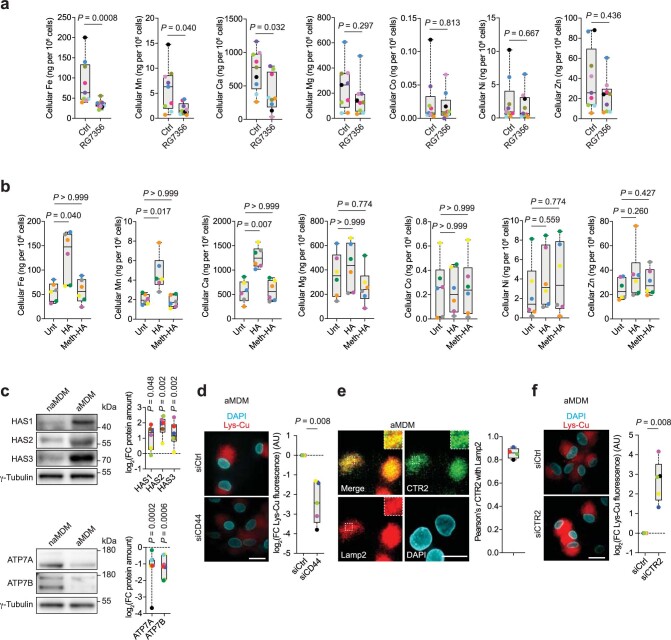
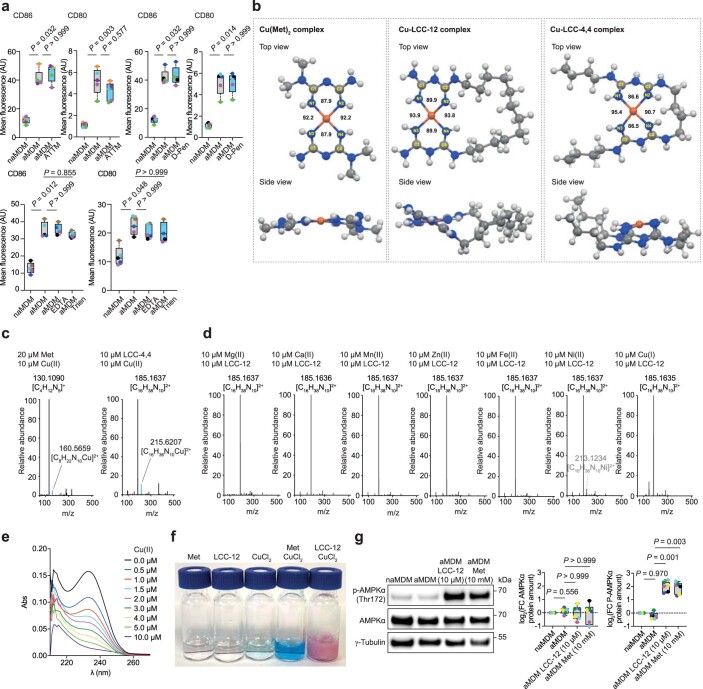
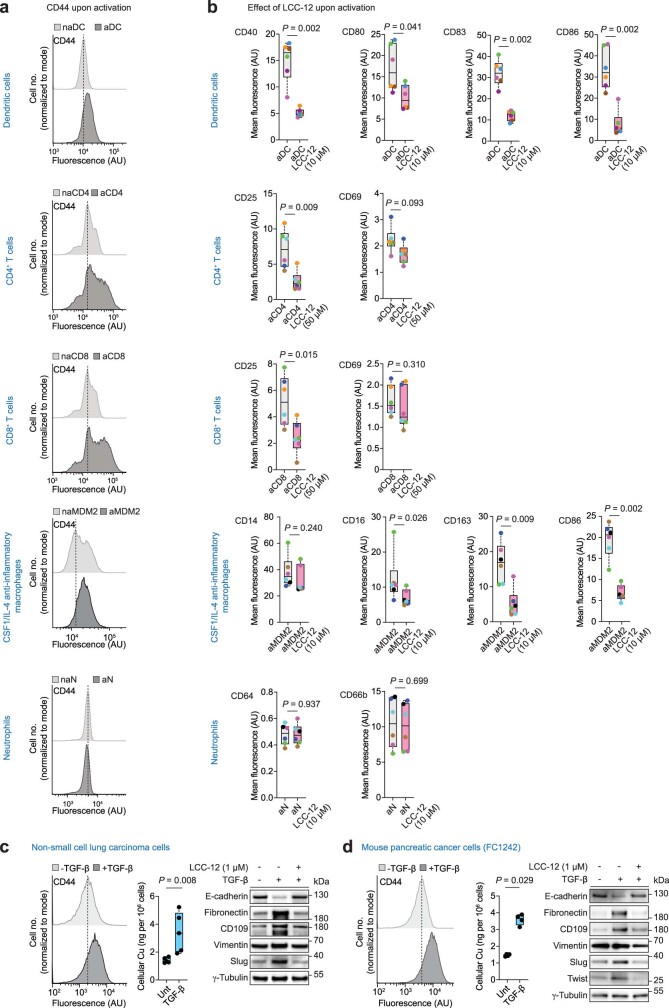
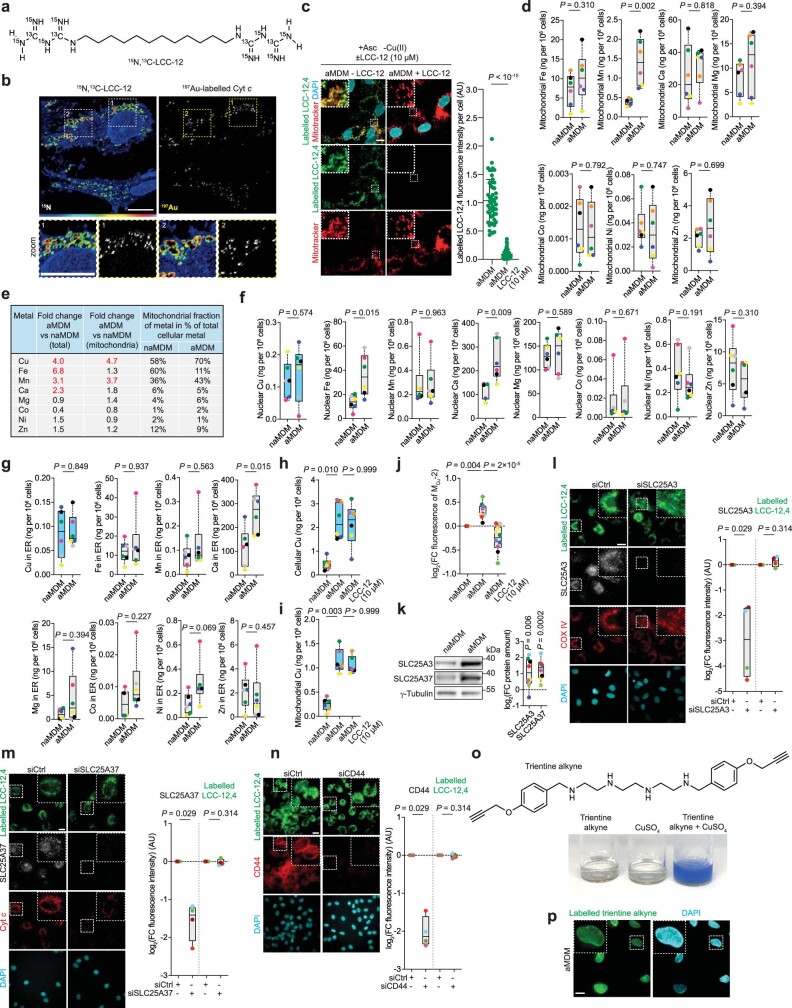
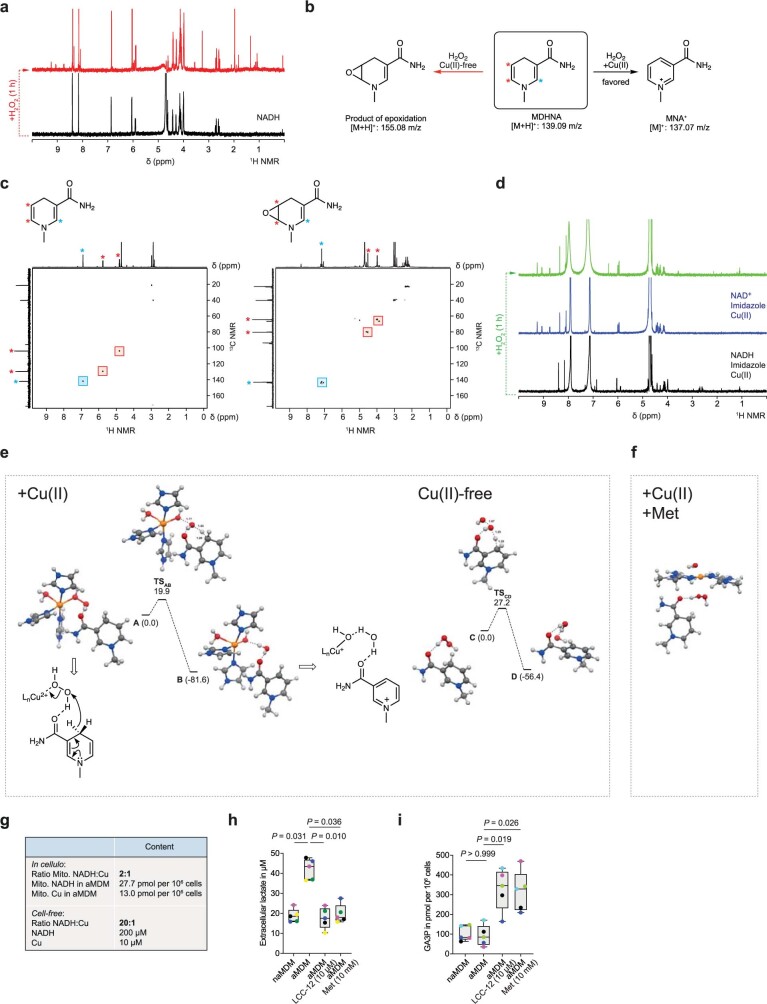
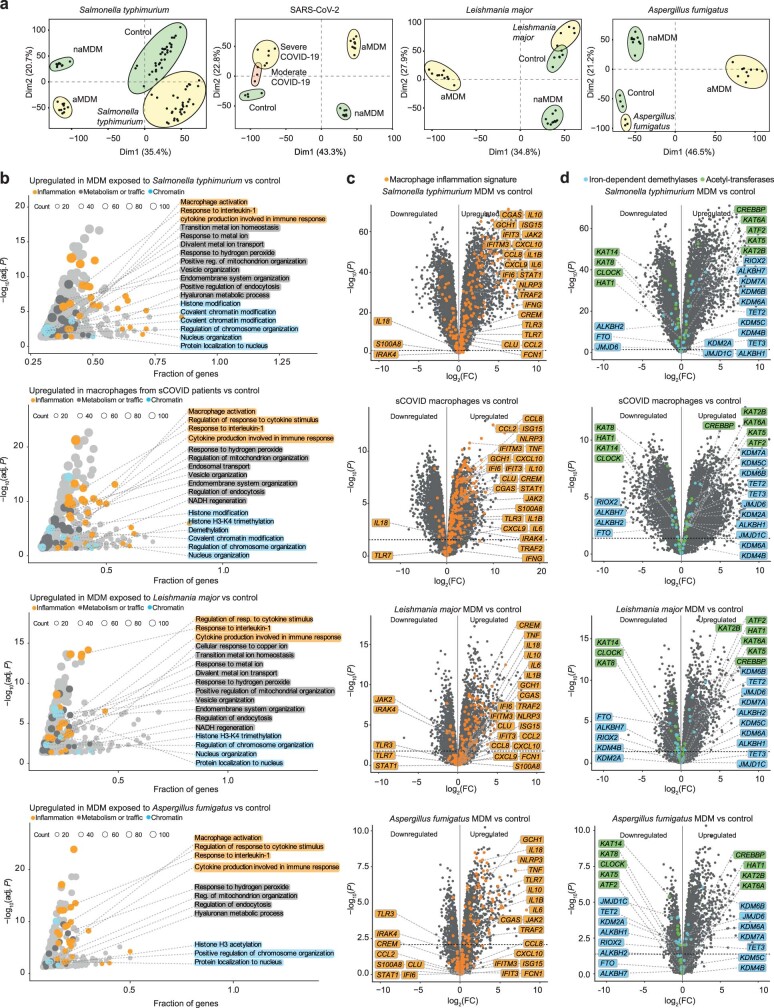
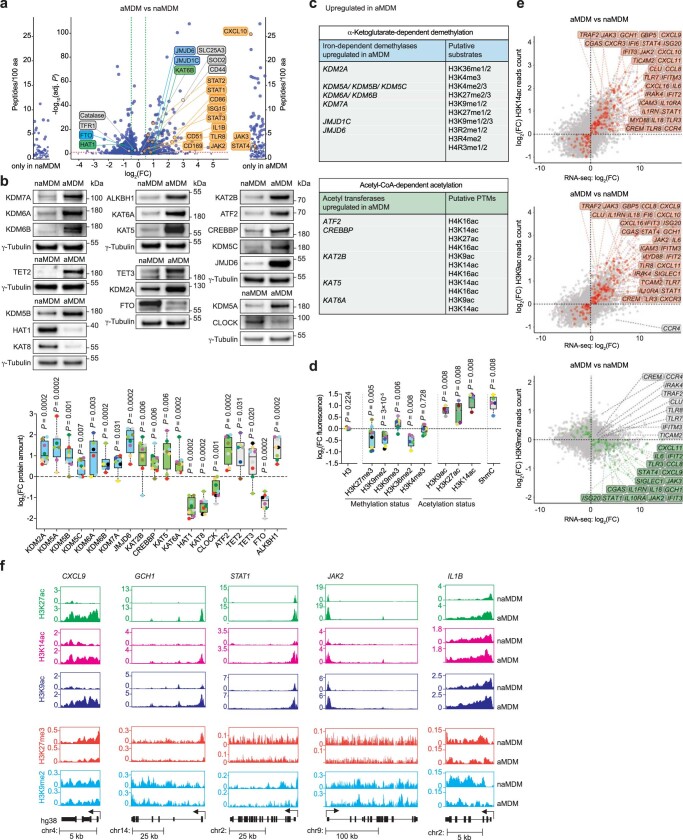
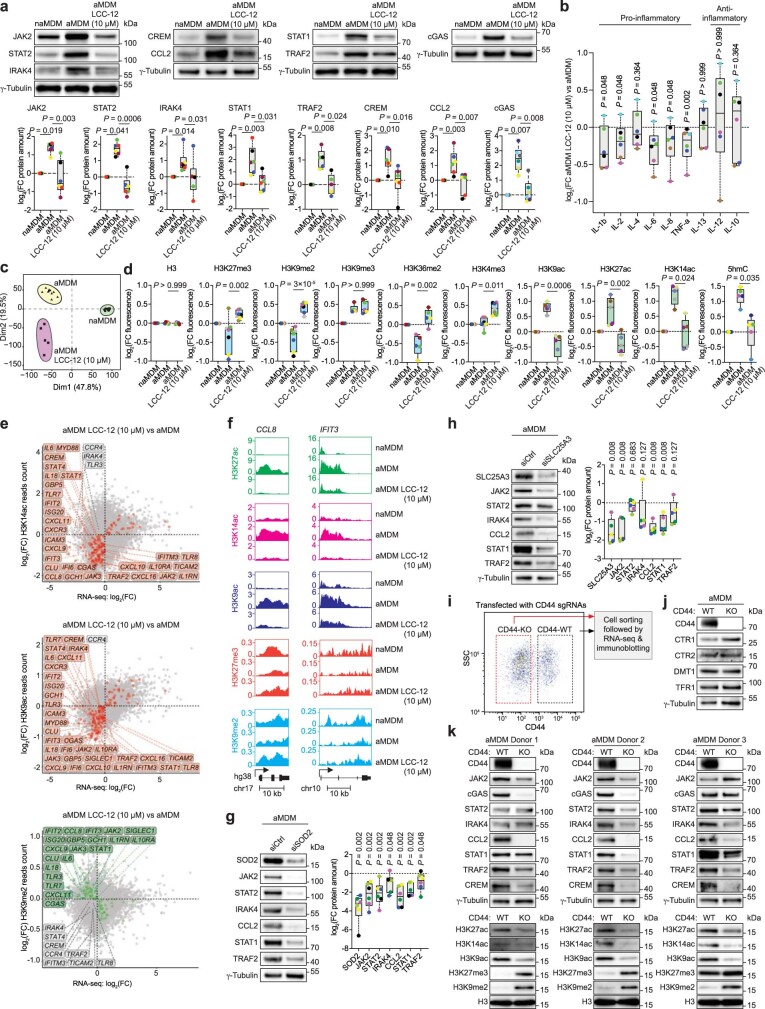
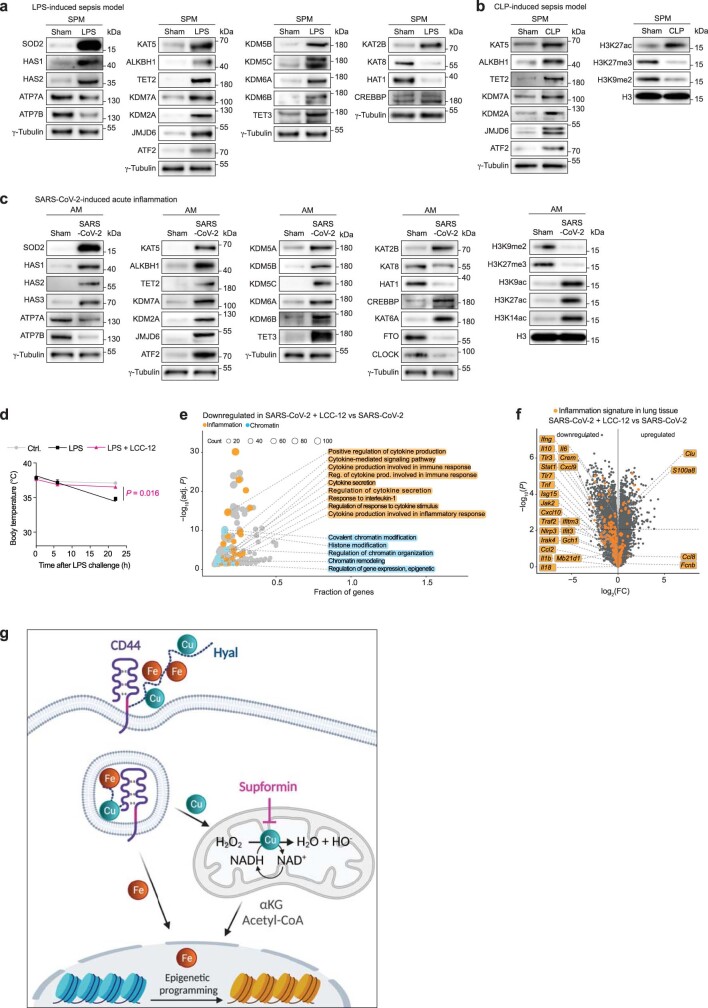
Inflammation is a complex physiological process triggered in response to harmful stimuli1. It involves cells of the immune system capable of clearing sources of injury and damaged tissues. Excessive inflammation can occur as a result of infection and is a hallmark of several diseases2-4. The molecular bases underlying inflammatory responses are not fully understood. Here we show that the cell surface glycoprotein CD44, which marks the acquisition of distinct cell phenotypes in the context of development, immunity and cancer progression, mediates the uptake of metals including copper. We identify a pool of chemically reactive copper(II) in mitochondria of inflammatory macrophages that catalyses NAD(H) redox cycling by activating hydrogen peroxide. Maintenance of NAD+ enables metabolic and epigenetic programming towards the inflammatory state. Targeting mitochondrial copper(II) with supformin (LCC-12), a rationally designed dimer of metformin, induces a reduction of the NAD(H) pool, leading to metabolic and epigenetic states that oppose macrophage activation. LCC-12 interferes with cell plasticity in other settings and reduces inflammation in mouse models of bacterial and viral infections. Our work highlights the central role of copper as a regulator of cell plasticity and unveils a therapeutic strategy based on metabolic reprogramming and the control of epigenetic cell states.


Conflict of interest statement

Institut Curie and the CNRS have filed patents on the LCC family of compounds and their therapeutic use. Patents: WO 2019/233982, filed on 4 June 2019; PCT/EP2021/082073, filed on 18 November 2021, WO 2021/233962, filed on 19 May 2021.

Figures

Fig. 1
Fig. 1. CD44 mediates copper uptake.
a, Experimental setup used to generate inflammatory monocyte-derived macrophages (MDMs). b, Flow cytometry of CD44 in MDMs. Data are representative of n = 13 donors. AU, arbitrary units. c, ICP-MS of cellular copper in MDMs (n = 9 donors). d, ICP-MS of cellular copper in aMDMs with short interfering RNA (siRNA) knockdown of indicated receptors and transporters (n = 6 donors). Copper transporter 1 (CTR1) is encoded by SLC31A1, CTR2 is encoded by SLC31A2, transferrin receptor 1 (TFR1) is encoded by TFRC, and divalent metal transporter 1 (DMT1) is encoded by SLC11A2. siCtrl, control siRNA. e, Representative western blots of metal transporters in MDMs (n = 7 donors). FC, fold change. f, ICP-MS of cellular copper in MDMs treated with anti-CD44 antibody RG7356 during activation (n = 7 donors). g, ICP-MS of cellular copper in MDMs treated with hyaluronate (0.6–1 MDa) (HA) or permethylated hyaluronate (meth–HA) during activation (n = 6 donors). h, Molecular structure of hyaluronate tetrasaccharide (top) and 1H NMR spectra (bottom) of copper–hyaluronate complexation experiment, recorded at 310 K in D2O. i, Fluorescence microscopy of a lysosomal copper(ii) probe (Lys-Cu) and FITC–hyaluronate in aMDMs treated with hyaluronidase (HD). At least 30 cells were quantified per donor (n = 6 donors). Scale bar, 10 μm. Rel., relative. c,e,f,i, Two-sided Mann–Whitney test. d,g, Kruskal–Wallis test with Dunn’s post test. In all box plots in the main figures, boxes represent the interquartile range, centre lines represent medians and whiskers indicate the minimum and maximum values. In graphs, each coloured dot represents an individual donor for a given panel. Source data
Fig. 2
Fig. 2. Development of a small molecule inactivator of mitochondrial copper(ii).
a, Flow cytometry of cell surface markers in MDMs treated with metformin (Met) (n = 8 donors). b, Molecular structures of metformin, LCC-12 and LCC-4,4. c, HRMS of a Cu–LCC-12 complex. d, Flow cytometry of cell surface markers in MDMs treated with LCC-12 or LCC-4,4 (n = 9 donors). e, Experimental procedure of in-cell labelling of LCC-12,4. f, Fluorescence microscopy of labelled LCC-12,4 in aMDMs (n = 6 donors). At least 50 cells were quantified per donor. Cyt c, cytochrome c. g, Fluorescence microscopy of labelled LCC-12,4 in aMDMs treated with CCCP. h, Fluorescence microscopy of labelled LCC-12,4 in MDMs. In-cell labelling is performed with ascorbate and without added copper(ii). i, Fluorescence microscopy of labelled LCC-12,4 in aMDMs. In-cell labelling is performed in the presence or absence of ascorbate (asc) and without added copper(ii). j, ICP-MS of mitochondrial copper in MDMs (n = 6 donors). k, ICP-MS of mitochondrial copper in aMDMs under CD44-knockdown conditions (n = 6 donors). gi, Two-sided unpaired t-test, representative of n = 3 donors. Data are mean ± s.d. a,d, Kruskal–Wallis test with Dunn’s post test. j,k, Two-sided Mann–Whitney test. In graphs, each coloured dot represents an individual donor for a given panel. Scale bars, 10 μm. Source data
Fig. 3
Fig. 3. Mitochondrial copper(ii) regulates NAD(H) redox cycling.
a, Fluorescence microscopy of SOD2 in MDMs. Representative of n = 4 donors. At least 50 cells were quantified per donor. Scale bar, 10 μm. Two-sided unpaired t-test. Data are mean ± s.d. b, Representative western blots of SOD2 and catalase in MDMs (n = 7 donors). c, Regulation of H2O2 levels by SOD2 and catalase. d, Flow cytometry of mitochondrial H2O2 in MDMs (n = 6 donors). e, Reaction of NADH with H2O2 under copper(ii)-catalysed or copper-free conditions. Experimental mass spectrometry peaks and calculated masses of molecular ions are indicated. ES+, electrospray ionization mass spectrometry. f, Kinetics of NADH oxidation in the presence of H2O2 and copper(ii). Data are representative of n = 3 independent experiments. g, Metabolomics of NAD+ and NADH of mitochondria from MDMs treated with LCC-12 (n = 9 donors). AreaCorrLog2Cen data correspond to raw areas, corrected for analytical bias using GRMeta R package, then corrected areas are log2 transformed and centered on means. h, Metabolomics heat map highlighting metabolites whose biosynthesis is dependent on NAD(H) in MDMs treated with LCC-12 (n = 9 donors). i, Metabolomics of αKG and acetyl-CoA of MDMs treated with LCC-12 (n = 9 donors). b,d, Two-sided Mann–Whitney test. g,i, Kruskal–Wallis test with Dunn’s post test. In graphs, each coloured dot represents an individual donor for a given panel. Source data
Fig. 4
Fig. 4. Mitochondrial copper(ii) regulates the epigenetic states and transcriptional programmes of inflammatory macrophages.
a, GO term analysis of upregulated genes in aMDMs (n = 10 donors). Adj. P, adjusted P value. b, RNA-seq analysis of MDMs. Macrophage inflammatory signature genes are highlighted. The dashed line indicates an adjusted P value of 0.05 (n = 10 donors). c, RNA-seq analysis of MDMs. Iron-dependent demethylase and acetyltransferase signature genes are highlighted. The dashed line indicates an adjusted P value of 0.05 (n = 10 donors). d, Correlation for a representative donor of ChIP–seq reads count of histone marks in genes against RNA-seq of gene transcripts in MDMs (n = 10 donors). e, GO term analysis of genes in aMDMs (n = 10 donors) whose expression levels are downregulated upon treatment with LCC-12 (n = 5 donors). f, RNA-seq analysis of aMDMs (n = 10 donors) and MDMs treated with LCC-12 during activation (n = 5 donors). Macrophage inflammatory signature genes are highlighted. The dashed line indicates an adjusted P value of 0.05. g, Correlation for a representative donor of ChIP–seq reads count of histone marks in genes against RNA-seq of gene transcripts in aMDMs (n = 10 donors) and MDMs treated with LCC-12 during activation (n = 5 donors). h, RNA-seq analysis of CD44-knockout (KO) and wild-type (WT) aMDMs. Representative of n = 4 donors. Gating strategy is shown in the Supplementary Information. Macrophage inflammatory signature genes are highlighted. The dashed line indicates an adjusted P value of 0.05. In ac,e,f, Differential gene expression was assessed with the limma/voom framework. GO enrichment was assessed with the enrichGO method from clusterProfiler. P values were corrected for multiple testing with the Benjamini–Hochberg procedure.
Fig. 5
Fig. 5. Pharmacological inactivation of mitochondrial copper(ii) attenuates inflammation in vivo.
a, Experimental setup to isolate SPMs and AMs. The gating strategy is shown in the Supplementary Information. b, Western blots of CD44 in inflammatory macrophages isolated from mice. Macrophages from 7–10 mice were pooled per condition. c, ICP-MS of cellular copper in SPMs or AMs from control mice (sham) and mice undergoing acute inflammation. LPS: sham (n = 5 mice), LPS-treated (n = 4 mice); CLP: sham (n = 10 mice), with CLP (n = 8 mice); SARS-CoV-2: sham (n = 10 mice), SARS-CoV-2-infected (n = 10 mice). d, Western blots of histone marks in SPMs from mice treated with LPS and LCC-12. Macrophages from 4–7 mice pooled per condition. H3 is a sample processing control. e, Rank-order plot for RNA-seq of SPMs from mice treated with LPS and LCC-12. f, Western blots of proteins involved in inflammation in SPMs from mice treated with LPS and LCC-12. Macrophages from 4–7 mice were pooled per condition. g, Flow cytometry of SPMs from mice treated with LPS and LCC-12 (n = 7–9 mice). h, Kaplan–Meier survival curves of mice treated with LPS (20 mg kg−1 per single dose; intraperitoneal injection; n = 10 mice) and LCC-12 (0.3 mg kg−1 2 h before challenge, then 24 h, 48 h, 72 h and 96 h after challenge; intraperitoneal injection; n = 10 mice) or dexamethasone (10 mg kg−1 per dose 1 h before challenge; oral gavage; n = 10 mice). i, Kaplan–Meier survival curves of mice subjected to CLP and treated with LCC-12 (0.3 mg kg−1 4 h, 24 h, 48 h, 72 h and 96 h after CLP; intraperitoneal injection; n = 10 mice), dexamethasone (1.0 mg kg−1 at time of CLP; intraperitoneal injection; n = 10 mice) or a saline solution (intraperitoneal injection; n = 10 mice). In dg, LCC-12 (0.3 mg kg−1) was injected 6 h after LPS and samples were collected 22 h after LPS. c,g, Two-sided Mann–Whitney test. h,i, Mantel–Cox log-rank test. Hazard ratio calculated using the Mantel–Haenszel method. ND, not determined. Source data
Extended Data Fig. 1
Extended Data Fig. 1. CD44 mediates the uptake of metals in inflammatory macrophages.
a, Flow cytometry of cell surface markers in MDM. Monocytes treated as indicated to obtain pro-inflammatory or anti-inflammatory states. b, Flow cytometry of cell surface markers in MDM. Data representative of n = 13 donors. c, Bright field microscopy images of MDM. Scale bar, 20 μm. Morphological observations representative of n = 128 donors. d, ICP-MS of cellular metals in MDM (n = 9 donors). e, ICP-MS of cellular metals in aMDM under knockdown conditions of indicated genes (n = 6 donors). f, Western blots of cellular metal transporters in aMDM under knockdown conditions of indicated genes (n = 4 donors). g, Western blots of cellular metal transporters in aMDM under CD44 knockdown conditions (n = 6 donors). For d, f and g two-sided Mann-Whitney test. For e, Kruskal-Wallis test with Dunn’s post-test. Box plots: boxes represent interquartile range and median and whiskers indicate the minimum and maximum values. Each colored dot represents a distinct donor for a given panel. Source data
Extended Data Fig. 2
Extended Data Fig. 2. CD44 mediates the uptake of metals in inflammatory macrophages.
a, ICP-MS of cellular metals in aMDM treated with an anti-CD44 antibody RG7356 during activation (n = 7 donors). b, ICP-MS of cellular metals in aMDM supplemented with HA (0.6-1 MDa) or permethylated (meth-) HA during activation (n = 6 donors). c, Western blots of hyaluronan synthases (HAS) (n = 6 donors) and ATP7A/B (n = 8 donors) in MDM. d, Fluorescence microscopy of a lysosomal copper(II) probe (Lys-Cu) in aMDM under CD44 knockdown conditions (n = 5 donors). e, Fluorescence microscopy of CTR2 and Lamp2 in aMDM (n = 4 donors). f, Fluorescence microscopy of a lysosomal copper(II) probe (Lys-Cu) in aMDM under CTR2 knockdown conditions (n = 5 donors). For df, Scale bars, 10 μm. For a, c, d and f two-sided Mann-Whitney test. For b, Kruskal-Wallis test with Dunn’s post-test. Box plots: boxes represent interquartile range and median, and whiskers indicate the minimum and maximum values. Each colored dot represents a distinct donor for a given panel. Source data
Extended Data Fig. 3
Extended Data Fig. 3. Development of a small molecule inactivator of mitochondrial copper(II).
a, Flow cytometry of MDM treated with ATTM (10 µM, n = 5 donors), D-Pen (250 µM, n = 5 donors), EDTA (500 µM, n = 5 donors) or Trien (200 µM, n = 5 donors). b, Structural analysis of biguanide-based copper(II) complexes by molecular modeling. Top and side views highlight distinct geometries of Cu(Met)2, Cu–LCC-12 and Cu–LCC-4,4. c, HRMS of Cu(Met)2 and Cu–LCC-4,4. d, HRMS of LCC-12 in the presence of metals as indicated. e, UV absorbance spectra of LCC-12 (5 µM) titrated with a solution of copper(II). f, Picture of aq. solutions of Met, LCC-12, CuCl2 and corresponding mixtures. g, Western blots of AMPKα and phosphorylated AMPKα (p-AMPKα) in MDM treated with LCC-12 or Met (n = 6 donors). For a and g Kruskal-Wallis test with Dunn’s post-test. Box plots: boxes represent interquartile range and median, and whiskers indicate the minimum and maximum values. Each colored dot represents a distinct donor for a given panel. Source data
Extended Data Fig. 4
Extended Data Fig. 4. Targeting mitochondrial copper(II) interferes with cell plasticity.
a, Flow cytometry of CD44 in dendritic cells (DC) (n = 6 donors), non-activated (naDC) and activated (aDC), CD4+ T cells (CD4) (n = 6 donors), non-activated (naCD4) and activated (aCD4), CD8+ T cells (CD8) (n = 6 donors), non-activated (naCD8) and activated (aCD8), CSF1/IL-4 anti-inflammatory macrophages (n = 6 donors), non-activated (naMDM2) and activated (aMDM2), neutrophils (N) (n = 6 donors), non-activated (naN) and activated (aN). b, Flow cytometry of cell surface markers in immune cells treated with LCC-12 during activation. c, Primary human non-small cell lung circulating cancer cells treated as indicated. Left: Flow cytometry of CD44. Middle: ICP-MS of cellular copper (n = 5 independent biological experiments). Right: Western blots of EMT markers. d, Murine pancreatic cancer cells treated as indicated. Left: Flow cytometry of CD44. Middle: ICP-MS of cellular copper (n = 4 independent biological experiments). Right: Western blots of EMT markers. For bd two-sided Mann-Whitney test. Box plots: boxes represent interquartile range and median, and whiskers indicate the minimum and maximum values. Each colored dot represents a distinct donor for a given cell type. Source data
Extended Data Fig. 5
Extended Data Fig. 5. Detection of a druggable pool of copper(II) in mitochondria.
a, Molecular structure of isotopologue 15N,13C-LCC-12. b, NanoSIMS image of 15N and 197Au in aMDM of n = 1 donor. c, Fluorescence microscopy of labelled LCC-12,4 (100 nM) in aMDM. In-cell-labelling performed without added copper(II) and using LCC-12 as a competitor. Representative of n = 3 donors. d, ICP-MS of metals in mitochondria of MDM (n = 6 donors). e, Comparison of the total metal contents in cells and mitochondria of MDM determined by ICP-MS. f, ICP-MS of metals in nuclei isolated from MDM (n = 6 donors). g, ICP-MS of metals in endoplasmic reticula (ER) isolated from MDM (n = 6 donors). h, ICP-MS of the total cellular copper content in MDM treated with LCC-12 (n = 6 donors). i, ICP-MS of mitochondrial copper in MDM treated with LCC-12 (n = 6 donors). j, Flow cytometry of a mitochondrial copper(II) probe (MCu-2) in MDM treated with LCC-12 (n = 10 donors). k, Western blots of mitochondrial metal transporters in MDM (n = 8 donors). l, m, n, Fluorescence microscopy of labelled LCC-12,4 in aMDM under gene knockdown conditions as indicated (n = 4 donors). o, Top: Structure of trientine alkyne. Bottom: Picture of aq. solutions of trientine alkyne, CuSO4 and corresponding mixtures. p, Fluorescence microscopy of labelled trientine alkyne in aMDM. For b, c, ln, p scale bar, 10 μm. For c two-sided unpaired t-test, representative of n = 3 donors. Mean ± s.d. For d, f, g, k, ln, two-sided Mann-Whitney test. For hj Kruskal-Wallis test with Dunn’s post-test. Box plots: boxes represent interquartile range and median, and whiskers indicate the minimum and maximum values. Each colored dot represents a distinct donor for a given panel. Source data
Extended Data Fig. 6
Extended Data Fig. 6. Copper(II) regulates NAD(H) redox cycling.
a, 1H NMR spectra of NADH (black) and the reaction products of NADH with H2O2 after 1 h at 37 °C, spectra recorded at 298 K in D2O (red). b, Reaction of MDHNA with H2O2 under copper(II)-catalyzed and copper-free conditions to afford either MNA+ or a product of epoxidation, respectively. The mass of molecular ions detected by mass spectrometry are indicated. c, Heteronuclear single quantum coherence (HSQC) NMR spectra of MDHNA and its product of epoxidation. Red stars mark 1H and 13C NMR signals of the most reactive double bond towards H2O2 and that of the corresponding epoxide product. Blue stars mark 1H and 13C NMR signals of the least reactive double bond towards H2O2. Blue boxes show 1H-13C HSQC correlations of the least reactive double bond. Red boxes show 1H-13C HSQC correlations of the most reactive double bond and corresponding epoxide. d, 1H NMR spectra of NADH, imidazole and copper(II) (black), NAD+ in the presence of imidazole and copper(II) (blue), the reaction product of NADH with H2O2 in the presence of imidazole and copper(II) after 1 h at 25 °C, spectra recorded at 298 K in buffered D2O (pD 8.4) (green). e, Free energy profile (ΔG298, kcal/mol) of the [(Imidazole)3Cu(H2O)](II)-mediated H-transfer reaction from MDHNA to H2O2. Selected distances in Å. Free energy profile (ΔG298, kcal/mol) of the copper-free H-transfer reaction from MDHNA to H2O2. Selected distances in Å. f, Optimized Cu(Met)2, MDHNA, H2O2 and H2O. g, Concentrations of copper and NADH in cells, and in the cell-free system used in Fig. 3f. h, Quantification of extracellular lactate produced by MDM treated with LCC-12 or Met (n = 5 donors). i, Quantification of glyceraldehyde 3-phosphate (GA3P) in MDM treated with LCC-12 or Met (n = 5 donors). For h and i Kruskal-Wallis test with Dunn’s post-test. Box plots: boxes represent interquartile range and median, and whiskers indicate the minimum and maximum values. Each colored dot represents a distinct donor for a given panel. Source data
Extended Data Fig. 7
Extended Data Fig. 7. Comparative analysis of transcriptomes of inflammatory macrophages.
a, Principal Component Analysis (PCA) of RNA-seq comparing naMDM (n = 10 donors) and aMDM (n = 10 donors) with MDM exposed to Salmonella typhimurium (n = 32 donors) vs control (n = 32 donors), macrophages from bronchoalveolar fluids of moderate (n = 3 donors) and severe COVID-19 individuals (sCOVID, n = 6 donors) vs control (n = 4 donors), MDM exposed to Leishmania major (n = 5 donors) vs control (n = 6 donors) and MDM exposed to Aspergillus fumigatus (n = 3 donors) vs control (n = 3 donors). b, GO term analyses of upregulated genes in MDM exposed to Salmonella typhimurium (n = 32 donors) vs control (n = 32 donors), sCOVID (n = 6 donors) vs control (n = 4 donors), Leishmania major (n = 5 donors) vs control (n = 6 donors) and Aspergillus fumigatus (n = 3 donors) vs control (n = 3 donors). c, RNA-seq analyses of gene expression in MDM exposed to Salmonella typhimurium (n = 32 donors) vs control (n = 32 donors), sCOVID (n = 6 donors) vs control (n = 4 donors), Leishmania major (n = 5 donors) vs control (n = 6 donors) and Aspergillus fumigatus (n = 3 donors) vs control (n = 3 donors). Inflammatory signature genes are highlighted. Dashed lines, adjusted P values = 0.05. d, RNA-seq analyses of gene expression in MDM exposed to Salmonella typhimurium (n = 32 donors) vs control (n = 32 donors), sCOVID (n = 6 donors) vs control (n = 4 donors), Leishmania major (n = 5 donors) vs control (n = 6 donors) and Aspergillus fumigatus (n = 3 donors) vs control (n = 3 donors). Genes encoding iron-dependent demethylases and acetyl-transferases are highlighted. Dashed lines, adjusted P values = 0.05. For bd differential gene expression was assessed with the limma/voom framework. GO enrichment was assessed with the enrichGO method from clusterProfiler. P values were corrected for multiple testing with the Benjamini-Hochberg procedure.
Extended Data Fig. 8
Extended Data Fig. 8. Mitochondrial copper(II) regulates epigenetic states and transcriptional programs of inflammatory macrophages.
a, Quantitative mass-spectrometry-based proteomics of MDM (n = 8 donors). b, Representative western blots (top) of epigenetic modifiers identified by RNA-seq in aMDM and corresponding quantifications (bottom) (n = 6–8 donors). c, Genes encoding iron-dependent demethylases and acetyl-transferases found to be upregulated in aMDM are listed together with putative substrates and post-translational modifications (PTMs) products. d, Fluorescence microscopy quantifications of histone H3 methyl and acetyl marks in MDM. Quantifications represent aMDM normalized against naMDM. At least 50 cells were quantified per donor per condition (n = 5–11 donors). e, Scatter plot correlation of a representative donor of ChIP-seq reads count of histone marks in genes against RNA-seq of gene transcripts in MDM (n = 10 donors). f, ChIP-seq tracks of selected genes involved in inflammation in MDM. For b and d, two-sided Mann-Whitney test. Box plots: boxes represent interquartile range and median, and whiskers indicate the minimum and maximum values. Each colored dot represents a distinct donor for a given panel. Source data
Extended Data Fig. 9
Extended Data Fig. 9. Mitochondrial copper(II) regulates epigenetic states and transcriptional programs of inflammatory macrophages.
a, Representative western blots (top) of proteins involved in inflammation in MDM treated with LCC-12 and corresponding quantifications (bottom) (n = 8 donors). b, Immunoassay of cytokines secreted by MDM treated with LCC-12 during activation (n = 6 donors). c, PCA of RNA-seq comparing naMDM (n = 10 donors), aMDM (n = 10 donors) and MDM treated with LCC-12 during activation (n = 5 donors). d, Fluorescence microscopy quantifications of histone H3 methyl and acetyl marks in MDM treated with LCC-12. Quantifications were normalized against naMDM. At least 50 cells were quantified per donor per condition (n = 5–7 donors). e, Scatter plot correlation of a representative donor of ChIP-seq reads count of histone marks in genes against RNA-seq of gene transcripts in aMDM (n = 10 donors) and MDM treated with LCC-12 during activation (n = 5 donors). f, ChIP-seq tracks of selected genes involved in inflammation in MDM. g, Western blots of proteins involved in inflammation in aMDM under SOD2 knockdown conditions. h, Western blots of proteins involved in inflammation in aMDM under SLC25A3 knockdown conditions. i, Flow cytometry of wild-type (WT) and CD44 knockout (KO) aMDM. Gating strategy see Supplementary Information. j, Western blots of metal transporter proteins in WT and CD44-KO aMDM in n = 1 donor. k, Western blots of proteins involved in inflammation and histone marks in WT aMDM and CD44-KO aMDM for n = 3 donors. H3 is a sample processing control. For a and d Kruskal-Wallis test with Dunn’s post-test. For b, g and h two-sided Mann-Whitney test. Box plots: boxes represent interquartile range and median, and whiskers indicate the minimum and maximum values. Each colored dot represents a distinct donor for a given panel. Source data
Extended Data Fig. 10
Extended Data Fig. 10. Pharmacological inactivation of mitochondrial copper(II) attenuates inflammation in vivo.
a, Western blots of copper-signalling effectors in SPMs from mice treated with LPS. Macrophages of several mice were pooled (4–7 mice per condition). b, Western blots of copper-signalling effectors in SPMs from mice subjected to CLP. Macrophages of several mice were pooled (7–8 mice per condition). H3 is a sample processing control. c, Western blots of copper-signalling effectors in AMs from K18-hACE2 mice infected with SARS-CoV-2. Macrophages of several mice were pooled (10 mice per condition). H3 is a sample processing control. d, Average body temperature of mice treated as indicated (n = 6–9 mice per group). e, GO term analysis of downregulated genes in lung tissues of SARS-CoV-2 infected K18-hACE2 mice treated with LCC-12 (0.5 mg/kg). f, RNA-seq analysis of gene expression in lung tissues of SARS-CoV-2-infected K18-hACE2 mice treated with LCC-12 (0.5 mg/kg) (n = 8 mice per group). Inflammatory signature genes highlighted. Dashed lines, adjusted P value = 0.05. g, Illustration of copper-signalling. Cell plasticity involves upregulation of the cell surface marker CD44, which mediates endocytosis of metal-bound hyaluronates. In the presence of copper(II), NADH reacts with H2O2 to replenish NAD+ in mitochondria, an enzyme cofactor involved in the biosynthesis of αKG and acetyl-CoA. These co-substrates of iron-dependent demethylases and acetyl-transferases are required for epigenetic and transcriptional programming of inflammation and the regulation of cell plasticity. Pharmacological inactivation of mitochondrial copper(II) blocks NAD(H) redox cycling, leading to distinct epigenetic states and transcriptional profiles. Targeting copper(II) interferes with cell plasticity in immune and cancer cells. For ac gating strategy of SPMs and AMs see Methods and Supplementary Information. For d 2-way ANOVA. Mean values ± s.e.m. For e and f differential gene expression was assessed with the limma/voom framework. GO enrichment was assessed with the enrichGO method from clusterProfiler. P-values were corrected for multiple testing with the Benjamini-Hochberg procedure. Source data

Comment in

References

    1. Lopez-Otin C, Kroemer G. Hallmarks of health. Cell. 2021;184:1929–1939. doi: 10.1016/j.cell.2021.03.033. - DOI - PubMed
    1. Annane D, Bellissant E, Cavaillon JM. Septic shock. Lancet. 2005;365:63–78. doi: 10.1016/S0140-6736(04)17667-8. - DOI - PubMed
    1. Moore JB, June CH. Cytokine release syndrome in severe COVID-19. Science. 2020;368:473–474. doi: 10.1126/science.abb8925. - DOI - PubMed
    1. Park MD, Silvin A, Ginhoux F, Merad M. Macrophages in health and disease. Cell. 2022;185:4259–4279. doi: 10.1016/j.cell.2022.10.007. - DOI - PMC - PubMed
    1. Horby P, et al. Dexamethasone in hospitalized patients with Covid-19. N. Engl. J. Med. 2021;384:693–704. doi: 10.1056/NEJMoa2021436. - DOI - PMC - PubMed

Publication types

MeSH terms