. 2023 May;617(7961):483-487.
doi: 10.1038/s41586-023-05902-2. Epub 2023 Apr 26.

Photochemically produced SO2 in the atmosphere of WASP-39b

Shang-Min Tsai  1   2 Elspeth K H Lee  3 Diana Powell  4 Peter Gao  5 Xi Zhang  6 Julianne Moses  7 Eric Hébrard  8 Olivia Venot  9 Vivien Parmentier  10 Sean Jordan  11 Renyu Hu  12   13 Munazza K Alam  5 Lili Alderson  14 Natalie M Batalha  15 Jacob L Bean  16 Björn Benneke  17 Carver J Bierson  18 Ryan P Brady  19 Ludmila Carone  20 Aarynn L Carter  15 Katy L Chubb  21 Julie Inglis  13   22 Jérémy Leconte  23 Michael Line  18 Mercedes López-Morales  4 Yamila Miguel  24   25 Karan Molaverdikhani  26   27 Zafar Rustamkulov  28 David K Sing  22   28 Kevin B Stevenson  29 Hannah R Wakeford  14 Jeehyun Yang  12 Keshav Aggarwal  30 Robin Baeyens  31 Saugata Barat  31 Miguel de Val-Borro  32 Tansu Daylan  33 Jonathan J Fortney  15 Kevin France  34 Jayesh M Goyal  35 David Grant  14 James Kirk  4   36 Laura Kreidberg  37 Amy Louca  24 Sarah E Moran  38 Sagnick Mukherjee  15 Evert Nasedkin  37 Kazumasa Ohno  15 Benjamin V Rackham  39   40 Seth Redfield  41 Jake Taylor  42   17 Pascal Tremblin  43 Channon Visscher  7   44 Nicole L Wallack  5   13 Luis Welbanks  18 Allison Youngblood  45 Eva-Maria Ahrer  46   47 Natasha E Batalha  48 Patrick Behr  34 Zachory K Berta-Thompson  49 Jasmina Blecic  50   51 S L Casewell  52 Ian J M Crossfield  53 Nicolas Crouzet  24 Patricio E Cubillos  20   54 Leen Decin  55 Jean-Michel Désert  31 Adina D Feinstein  16 Neale P Gibson  56 Joseph Harrington  57 Kevin Heng  26   47 Thomas Henning  37 Eliza M-R Kempton  58 Jessica Krick  59 Pierre-Olivier Lagage  43 Monika Lendl  60 Joshua D Lothringer  61 Megan Mansfield  62 N J Mayne  63 Thomas Mikal-Evans  37 Enric Palle  64 Everett Schlawin  62 Oliver Shorttle  11 Peter J Wheatley  46   47 Sergei N Yurchenko  19
Affiliations

Photochemically produced SO2 in the atmosphere of WASP-39b

Shang-Min Tsai et al. Nature. 2023 May.

Abstract

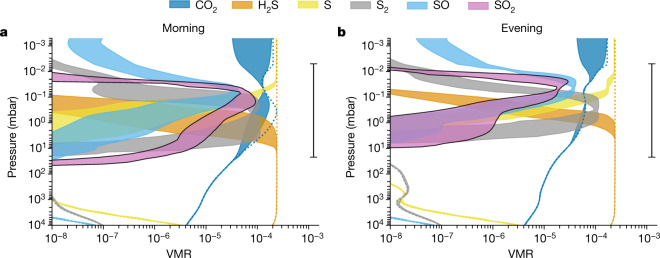
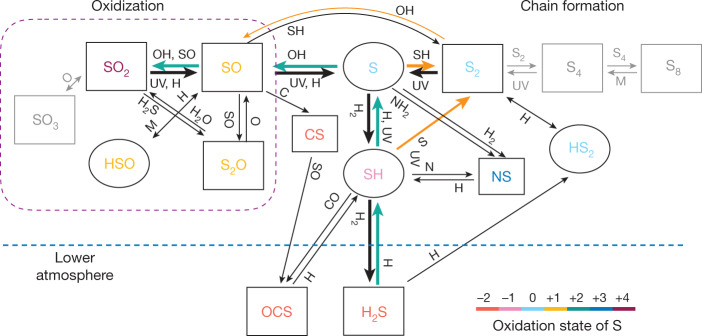
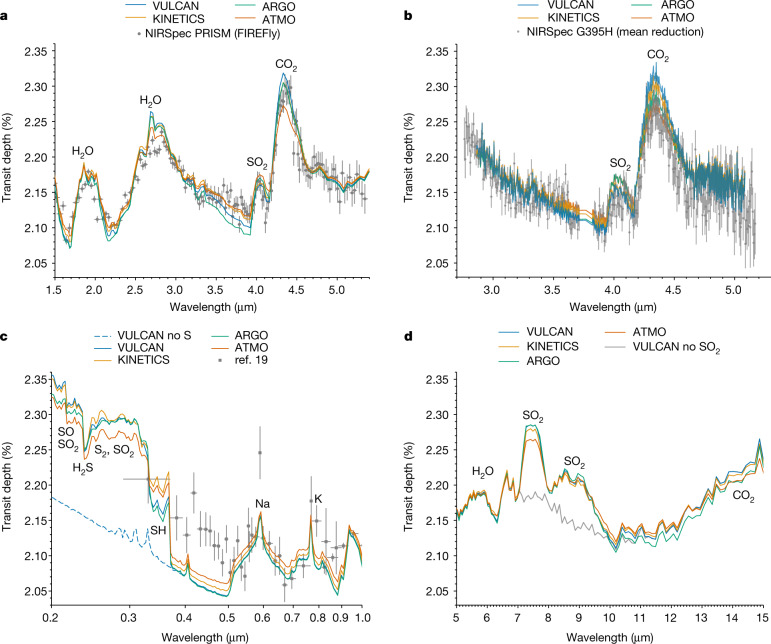
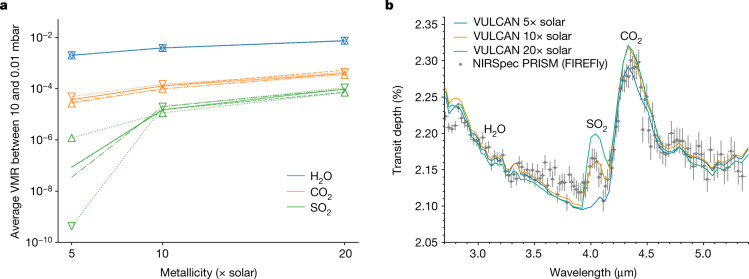
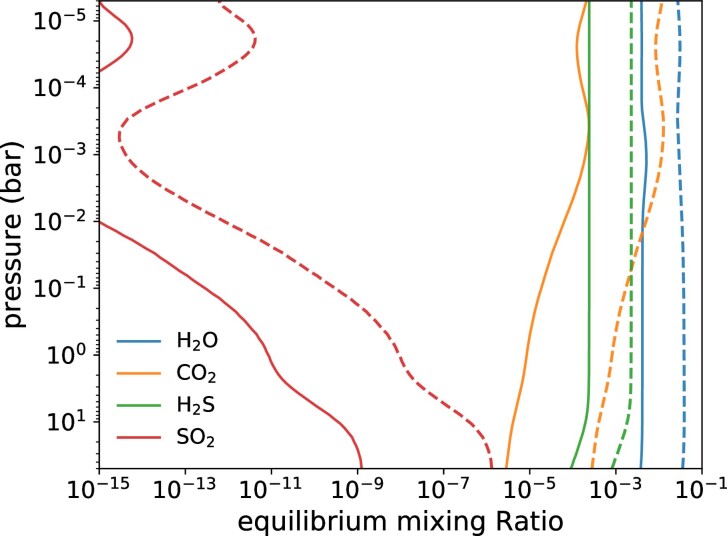
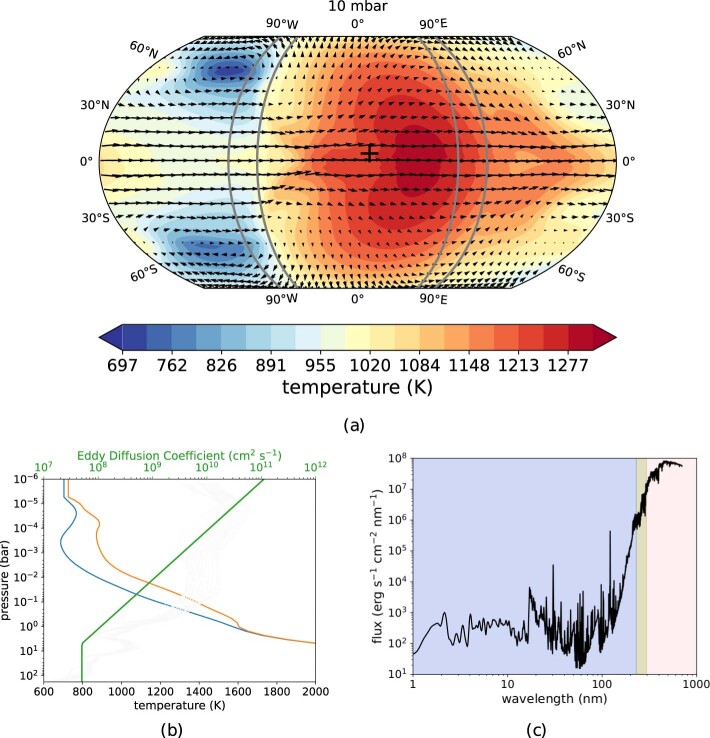
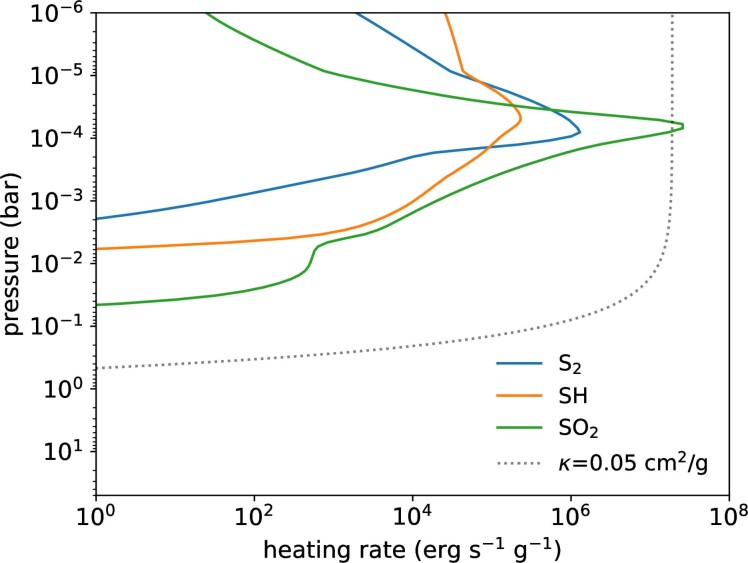
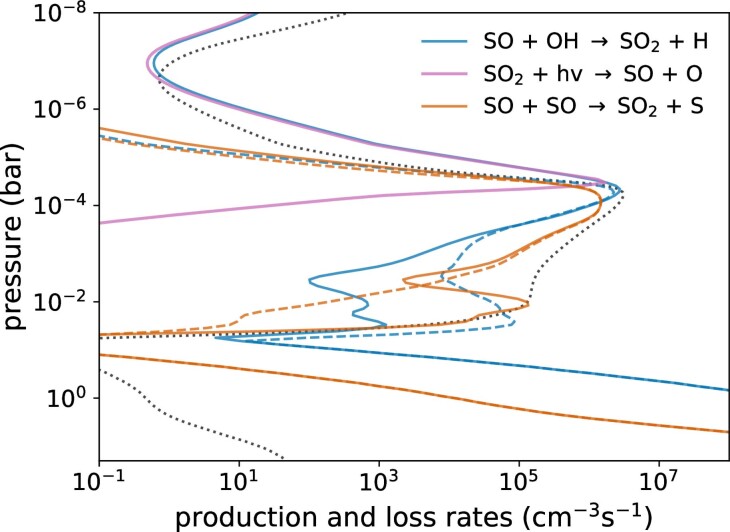
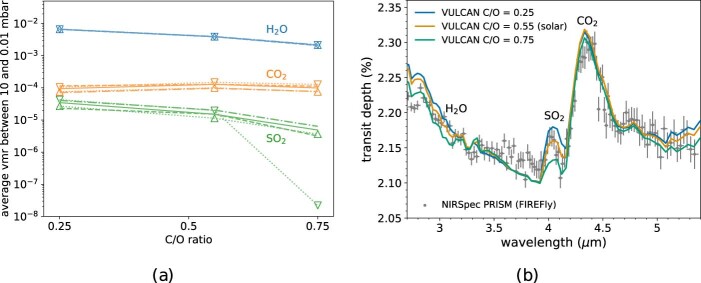
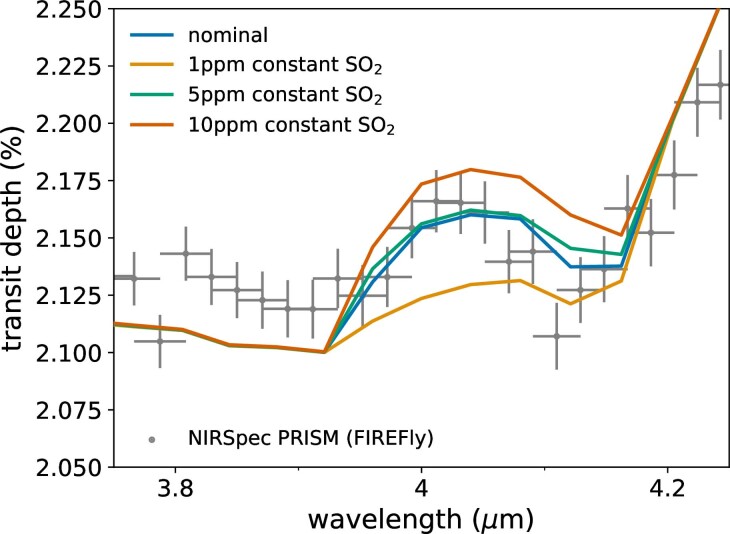
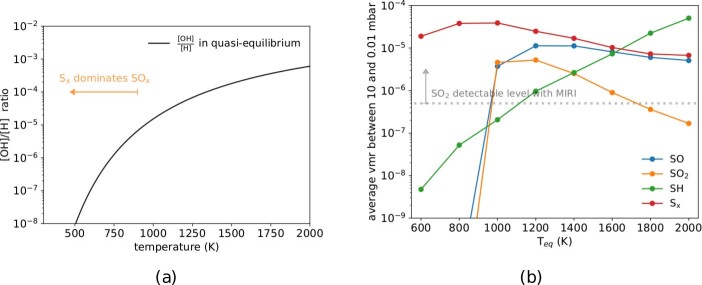
Photochemistry is a fundamental process of planetary atmospheres that regulates the atmospheric composition and stability1. However, no unambiguous photochemical products have been detected in exoplanet atmospheres so far. Recent observations from the JWST Transiting Exoplanet Community Early Release Science Program2,3 found a spectral absorption feature at 4.05 μm arising from sulfur dioxide (SO2) in the atmosphere of WASP-39b. WASP-39b is a 1.27-Jupiter-radii, Saturn-mass (0.28 MJ) gas giant exoplanet orbiting a Sun-like star with an equilibrium temperature of around 1,100 K (ref. 4). The most plausible way of generating SO2 in such an atmosphere is through photochemical processes5,6. Here we show that the SO2 distribution computed by a suite of photochemical models robustly explains the 4.05-μm spectral feature identified by JWST transmission observations7 with NIRSpec PRISM (2.7σ)8 and G395H (4.5σ)9. SO2 is produced by successive oxidation of sulfur radicals freed when hydrogen sulfide (H2S) is destroyed. The sensitivity of the SO2 feature to the enrichment of the atmosphere by heavy elements (metallicity) suggests that it can be used as a tracer of atmospheric properties, with WASP-39b exhibiting an inferred metallicity of about 10× solar. We further point out that SO2 also shows observable features at ultraviolet and thermal infrared wavelengths not available from the existing observations.


Conflict of interest statement

The authors declare no competing interests.

Figures

Fig. 1
Fig. 1. Simulated vertical distribution of sulfur species and CO2.
a,b, The colour-shaded areas indicate the span (enclosed by the maximum and minimum values) of VMRs of CO2 (blue), SO2 (pink with black borders) and other key sulfur species (H2S, orange; S, yellow; S2, grey; SO, light blue) computed by an ensemble of photochemical models (ARGO, ATMO, KINETICS and VULCAN) for the morning (a) and evening (b) terminators. The thermochemical equilibrium VMRs are indicated by the dotted lines, with SO2 not within the x-axis range owing to its very low abundance in thermochemical equilibrium. The range bar on the right represents the main pressure ranges of the atmosphere investigated by JWST NIRSpec spectroscopy. Photochemistry produces SO2 and other sulfur species above the 1-mbar level with abundances several orders of magnitude greater than those predicted by thermochemical equilibrium.
Fig. 2
Fig. 2. A simplified schematic of the chemical pathways of sulfur species.
H2S, which is the stable sulfur-bearing molecule at thermochemical equilibrium in an H2 atmosphere, readily reacts with atomic H to form SH radicals and, subsequently, atomic S in the photochemical region (above about 0.1 mbar). Reaction of S with photochemically generated OH then produces SO, which is further oxidized to SO2. The thick arrows denote efficient reactions and M denotes any third body. Inefficient reactions and inactive paths in the temperature regime of WASP-39b are greyed out. The cyan arrows mark the main path from H2S to SO2, whereas the orange arrows mark the paths that are important at higher pressures. Sulfur species are colour-coded by the oxidation states of S. Rectangles indicate stable molecules, whereas ovals indicate free radicals.
Fig. 3
Fig. 3. Terminator-averaged theoretical transmission spectra.
We show the transmission spectra averaged over the morning and evening terminators generated from 1D photochemical model results. a, Comparison with the NIRSpec PRISM FIREFly reduction. b, Comparison with the NIRSpec G395H weighted-mean reduction. c, Comparison with the current HST and VLT/FORS2 optical wavelength data,. The models show pronounced features at UV wavelengths owing to sulfur species compared with the model without S-bearing species (dashed blue line). d, Predicted spectra across the MIRI LRS wavelength range, with SO2 removed from the VULCAN output shown in grey to indicate its contribution. All of the spectral data show 1σ error bars and the standard deviations averaged (unweighted) over all reductions are shown for the NIRSpec G395H data.
Fig. 4
Fig. 4. The metallicity trends and synthetic spectra with varying metallicity.
a, The averaged VMR of H2O, CO2 and SO2 in the atmosphere between 10 and 0.01 mbar examined by transmission spectroscopy as a function of atmospheric metallicity. The nominal model is shown by solid lines, whereas the eddy diffusion coefficient (Kzz) scaled by 0.1 and 10 are shown by dashed and dashed-dotted lines, respectively. The models with the whole temperature increased and decreased by 50 K are indicated by the upward-facing and downward-facing triangles connected by dotted lines, respectively. b, The morning and evening terminator-averaged theoretical transmission spectra with different metallicities (relative to solar value) compared with the NIRSpec observation. The error bars show 1σ standard deviations.
Extended Data Fig. 1
Extended Data Fig. 1. Chemical equilibrium abundances in the atmosphere of WASP-39b.
VMR profiles of H2O (blue), CO2 (orange), H2S (green) and SO2 (red), as computed by FastChem (ref. ) based on the morning terminator temperature profile, are given for 10× (solid lines) and 100× (dashed lines) solar metallicity.
Extended Data Fig. 2
Extended Data Fig. 2. The temperature–wind map of the WASP-39b Exo-FMS GCM and input for 1D photochemical models.
a, The colour scale represents temperature across the planet and arrows denote the wind direction and magnitude at 10 mbar. The ±10° longitudinal regions with respect to the morning and evening terminators are indicated with solid grey lines. The ‘+’ symbol denotes the sub-stellar point. b, 1D temperature–pressure profiles adopted from the morning and evening terminators averaging all latitudes and ±10° longitudes (regions enclosed by grey lines in a) and the Kzz profile (equation (2) and held constant below the 5-bar level) overlaying the root-mean-squared vertical wind multiplied by 0.1 scale height from the GCM (grey). The temperatures are kept isothermal from those at the top boundary of the GCM around 5 × 10−5 bar when extending to lower pressures (about 10−8 bar) for photochemical models. c, Input WASP-39 stellar flux at the surface of the star. The pink-shaded region indicates the optical wavelength range at which the stellar spectrum is directly measured, whereas the blue-shaded and green-shaded regions are those constructed from the Sun and HD 203244, respectively.
Extended Data Fig. 3
Extended Data Fig. 3. Shortwave radiative heating of sulfur species.
Radiative heating rates (erg s−1 g−1) of SO2, SH and H2S to demonstrate their potential impact on the temperature structure. Heating owing to a vertically constant grey opacity of 0.05 cm2 g−1 is shown for comparison. All heating rates are integrated over 220–800 nm.
Extended Data Fig. 4
Extended Data Fig. 4. The main source and sink profiles of SO2 in our WASP-39b model.
The reaction rates of the main sources and sinks of SO2 in the VULCAN morning-terminator model for WASP-39b. The dashed lines of the same colour are the corresponding reverse reactions and the dotted black line indicates the distribution profile (arbitrarily scaled) of SO2.
Extended Data Fig. 5
Extended Data Fig. 5. The C/O trends and synthetic spectra.
Same as Fig. 4 but as a function of C/O ratio at 10× solar metallicity. a, The averaged VMR of H2O, CO2 and SO2 between 10 and 0.01 mbar as a function of C/O ratio, in which the solar C/O is 0.55. The nominal model is shown by solid lines, whereas the eddy diffusion coefficient (Kzz) scaled by 0.1 and 10 are shown by dashed and dashed-dotted lines, respectively. The models for which the whole temperature increased and decreased by 50 K are indicated by the upward-facing and downward-facing triangles connected by dotted lines, respectively. b, The morning and evening terminator-averaged theoretical transmission spectra with different C/O ratios compared with the NIRSpec PRISM observation. The error bars show 1σ standard deviations.
Extended Data Fig. 6
Extended Data Fig. 6. The impact of sulfur on other nonsulfur species.
VMR profiles of some species in our WASP-39b model that exhibit differences from VULCAN including sulfur kinetics (solid lines) and without sulfur kinetics (dashed lines).
Extended Data Fig. 7
Extended Data Fig. 7. The opacities of several sulfur species.
Opacities of several sulfur species at 1,000 K and 1 mbar, except that those in the UV and of OCS are at room temperature. The opacities in the infrared are binned down to R ≈ 1,000 for clarity.
Extended Data Fig. 8
Extended Data Fig. 8. The main sulfur species abundances with reduced and enhanced UV irradiation.
VMR profiles of the main sulfur species in the VULCAN morning-terminator model with 0.1× (a) and 10× (b) UV. Our nominal model is shown by solid lines for comparison, whereas the model with varying FUV (1–230 nm) is shown by the dashed lines and that with varying NUV (230–295 nm) is shown by dashed-dotted lines.
Extended Data Fig. 9
Extended Data Fig. 9. The effects of assuming a vertically uniform distribution of SO2.
Terminator-averaged theoretical transmission spectra generated from abundance distribution computed by the photochemical model VULCAN compared with assuming constant 1, 5 and 10 ppm of SO2. As before, the NIRSpec PRISM observation is shown with 1σ error bars.
Extended Data Fig. 10
Extended Data Fig. 10. The OH to H ratio and the temperature trends for sulfur molecules produced by photochemistry.
a, kH2O/kH2O×O/H as a proxy of OH to H ratio at 10× solar metallicity, in which kH2O and kH2O are the forward and backward rate constants of H2O + H → OH + H2, respectively. When OH becomes scarce relative to H as temperature decreases, the chain-forming path (does not require OH) is favoured over the oxidization path (requires OH). b, The average VMR between 10 and 0.01 mbar as a function of planetary equilibrium temperature with temperature profiles adopted from ref.  (see text for the setup). The dotted grey line marks approximately the required SO2 concentration to be detectable with WASP-39b parameters. Sx denotes the allotropes S2 and S8 and SOx denotes the oxidized species SO and SO2.

References

    1. Yung, Y. L. & DeMore, W. B. Photochemistry of Planetary Atmospheres (Oxford Univ. Press, 1999).
    1. Stevenson KB, et al. Transiting exoplanet studies and community targets for JWST’s Early Release Science Program. Publ. Astron. Soc. Pac. 2016;128:094401–094411. doi: 10.1088/1538-3873/128/967/094401. - DOI
    1. Bean JL, et al. The Transiting Exoplanet Community Early Release Science Program for JWST. Publ. Astron. Soc. Pac. 2018;130:114402–114421. doi: 10.1088/1538-3873/aadbf3. - DOI
    1. Faedi F, et al. WASP-39b: a highly inflated Saturn-mass planet orbiting a late G-type star. Astron. Astrophys. 2011;531:A40. doi: 10.1051/0004-6361/201116671. - DOI
    1. Zahnle K, Marley MS, Morley CV, Moses JI. Photolytic hazes in the atmosphere of 51 ERI b. Astrophys. J. 2016;824:137. doi: 10.3847/0004-637X/824/2/137. - DOI

Publication types