. 2023 Apr;5(4):579-588.
doi: 10.1038/s42255-023-00782-2. Epub 2023 Apr 26.

Total daily energy expenditure has declined over the past three decades due to declining basal expenditure, not reduced activity expenditure

John R Speakman #  1   2   3   4 Jasper M A de Jong #  5   6 Srishti Sinha #  7   8 Klaas R Westerterp #  9 Yosuke Yamada  10   11 Hiroyuki Sagayama  12 Philip N Ainslie  13 Liam J Anderson  14 Lenore Arab  15 Kweku Bedu-Addo  16 Stephane Blanc  17   18 Alberto G Bonomi  19 Pascal Bovet  20   21 Soren Brage  22 Maciej S Buchowski  23 Nancy F Butte  24 Stefan G J A Camps  25 Jamie A Cooper  17   26 Richard Cooper  27 Sai Krupa Das  28 Peter S W Davies  29 Lara R Dugas  27   30 Ulf Ekelund  31 Sonja Entringer  32   33 Terrence Forrester  34 Barry W Fudge  35 Melanie Gillingham  36 Santu Ghosh  7 Annelies H Goris  37 Michael Gurven  38 Lewis G Halsey  39 Catherine Hambly  40 Hinke H Haisma  41 Daniel Hoffman  42 Sumei Hu  43   44   45 Annemiek M Joosen  25 Jennifer L Kaplan  5 Peter Katzmarzyk  46 William E Kraus  47 Robert F Kushner  48 William R Leonard  49 Marie Löf  50   51 Corby K Martin  46 Eric Matsiko  52 Anine C Medin  53   54 Erwin P Meijer  25 Marian L Neuhouser  55 Theresa A Nicklas  24 Robert M Ojiambo  56   57 Kirsi H Pietiläinen  58 Jacob Plange-Rhule  16 Guy Plasqui  59 Ross L Prentice  55 Susan B Racette  60 David A Raichlen  61 Eric Ravussin  46 Leanne M Redman  46 Susan B Roberts  28 Michael C Rudolph  62 Luis B Sardinha  63 Albertine J Schuit  64 Analiza M Silva  63 Eric Stice  65 Samuel S Urlacher  66   67 Giulio Valenti  25 Ludo M Van Etten  25 Edgar A Van Mil  68 Brian M Wood  69   70 Jack A Yanovski  71 Tsukasa Yoshida  72 Xueying Zhang  43   40 Alexia J Murphy-Alford  8 Cornelia U Loechl  8 Anura Kurpad  73 Amy H Luke  74 Herman Pontzer  75   76 Matthew S Rodeheffer  77   78   79 Jennifer Rood  80 Dale A Schoeller  81 William W Wong  82
Affiliations

Total daily energy expenditure has declined over the past three decades due to declining basal expenditure, not reduced activity expenditure

John R Speakman et al. Nat Metab. 2023 Apr.

Abstract

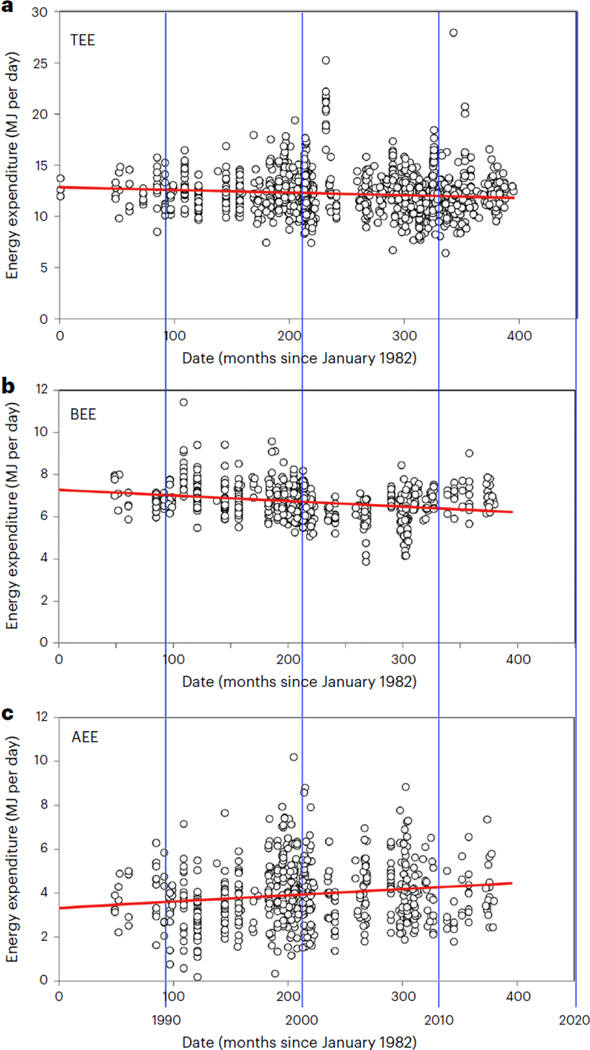
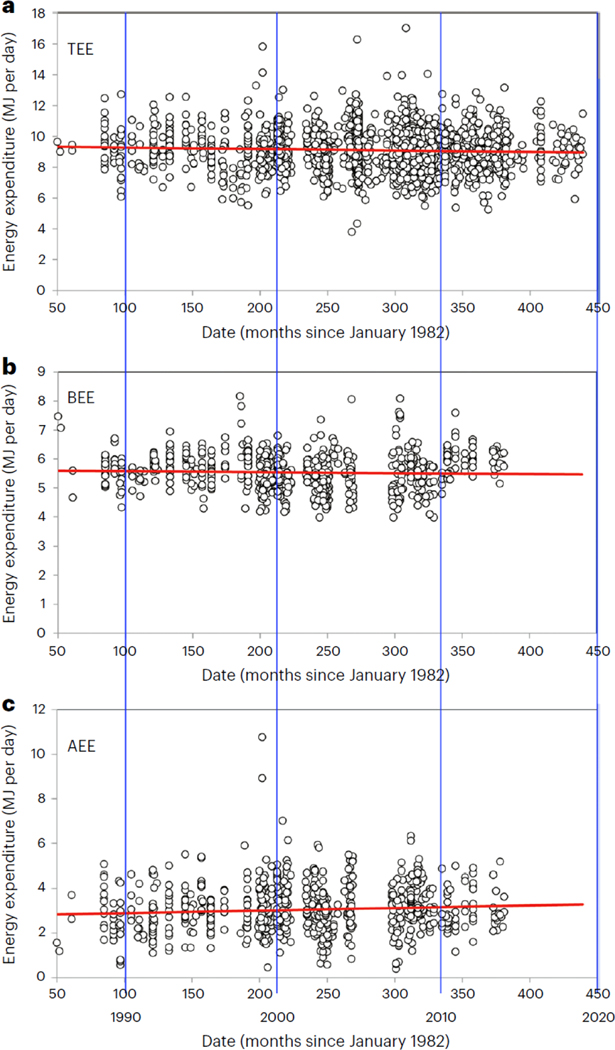
Obesity is caused by a prolonged positive energy balance1,2. Whether reduced energy expenditure stemming from reduced activity levels contributes is debated3,4. Here we show that in both sexes, total energy expenditure (TEE) adjusted for body composition and age declined since the late 1980s, while adjusted activity energy expenditure increased over time. We use the International Atomic Energy Agency Doubly Labelled Water database on energy expenditure of adults in the United States and Europe (n = 4,799) to explore patterns in total (TEE: n = 4,799), basal (BEE: n = 1,432) and physical activity energy expenditure (n = 1,432) over time. In males, adjusted BEE decreased significantly, but in females this did not reach significance. A larger dataset of basal metabolic rate (equivalent to BEE) measurements of 9,912 adults across 163 studies spanning 100 years replicates the decline in BEE in both sexes. We conclude that increasing obesity in the United States/Europe has probably not been fuelled by reduced physical activity leading to lowered TEE. We identify here a decline in adjusted BEE as a previously unrecognized factor.


Conflict of interest statement

Conflict of interest

The authors have no conflicts of interest to declare.

Figures

Figure 1:
Figure 1:
Trends over time in a) adjusted total energy expenditure, b) adjusted basal energy expenditure, and c) adjusted activity energy expenditure for males. Adjustments were made for body composition (fat and fat-free mass or body mass, and age) – see methods for details. All expenditures are in MJ/d and time is expressed in months since January 1982. Significant years are also indicated. Each data point is a different measurement of expenditure. The red lines are the fitted least squares regression fits. For regression details refer to text and Table 1.
Figure 2:
Figure 2:
Trends over time in a) adjusted total energy expenditure, b) adjusted basal energy expenditure, and c) adjusted activity energy expenditure for females. Adjustments were made for body composition (fat and lean mass and age) – see methods for details. Significant years are also indicated. All expenditures are in MJ/d and time is expressed in months since January 1982. Each data point is a different individual measurement of expenditure. The red lines are the fitted least squares regression fits. For regression details refer to text and Table 1.
Figure 3:
Figure 3:
A: effect of loge body mass on the loge basal metabolic rate (BMR) in a systematic review of 165 studies dating back to the early 1900s (first study 1919). Data for males in blue and for females in red. Studies with mixed male and female data not illustrated. B: Bubble plot showing the Residual loge Basal metabolism derived from a weighted regression of loge BMR against sex, age and loge (body mass) plotted against date of measurement in the same 165 studies. Bubbles represent the sample size of the studies. The red line is the fitted weighted regression.
Figure 4:
Figure 4:
A: the relationship between body weight and metabolic rate in the mice fed different diets with variable fatty acid compositions. B: the effect of saturated fatty acid intake on residual metabolic rate – corrected for body weight.

Comment in

References

    1. Hall KD, Heymsfield SB, Kemnitz J, Klein S, Schoeller DA and Speakman JR (2012) Energy balance and body weight regulation: a useful concept for understanding the obesity epidemic. American Journal of Clinical Nutrition 95: 989–994 - PMC - PubMed
    1. Hill JO, Wyatt HR and Peters JC (2012) Energy balance and obesity. Circulation 126: 126–132. - PMC - PubMed
    1. Swinburn BA, Sacks G, Hall KD, McPherson K, Finegood DT, Moodie ML and Gortmaker SL (2011) Obesity 1: the global pandemic.: shaped by global drivers and local environments. Lancet 378: 804–14. - PubMed
    1. Church TS, Thomas DM, Tudor-Locke C, Katzmarzyk PT, Earnest CP, Rodarte RQ, Martin CK, Blair SN, Bouchard C. (2011) Trends over 5 decades in US occupation related physical activity and their associations with obesity. Plos One 6: e19657. - PMC - PubMed
    1. Ezzati M, Bentham J, Di Ceare M. et al. (2017) Worldwide trends in body mass index, underweight, overweight and obesity from 1975 to 2016: a pooled analysis of 2416 population based measurement studies in 128.9 million children, adolescents and adults. Lancet 390: 2627–2642. - PMC - PubMed

Publication types