. 2023 Apr;5(4):589-606.
doi: 10.1038/s42255-023-00794-y. Epub 2023 Apr 26.

Branched-chain amino acid catabolism in muscle affects systemic BCAA levels but not insulin resistance

Affiliations

Branched-chain amino acid catabolism in muscle affects systemic BCAA levels but not insulin resistance

Megan C Blair et al. Nat Metab. 2023 Apr.

Abstract

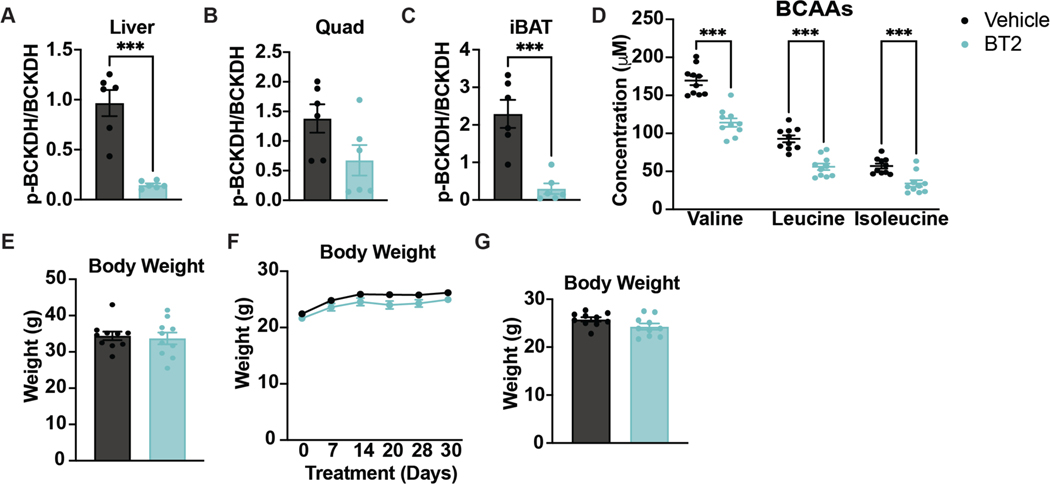
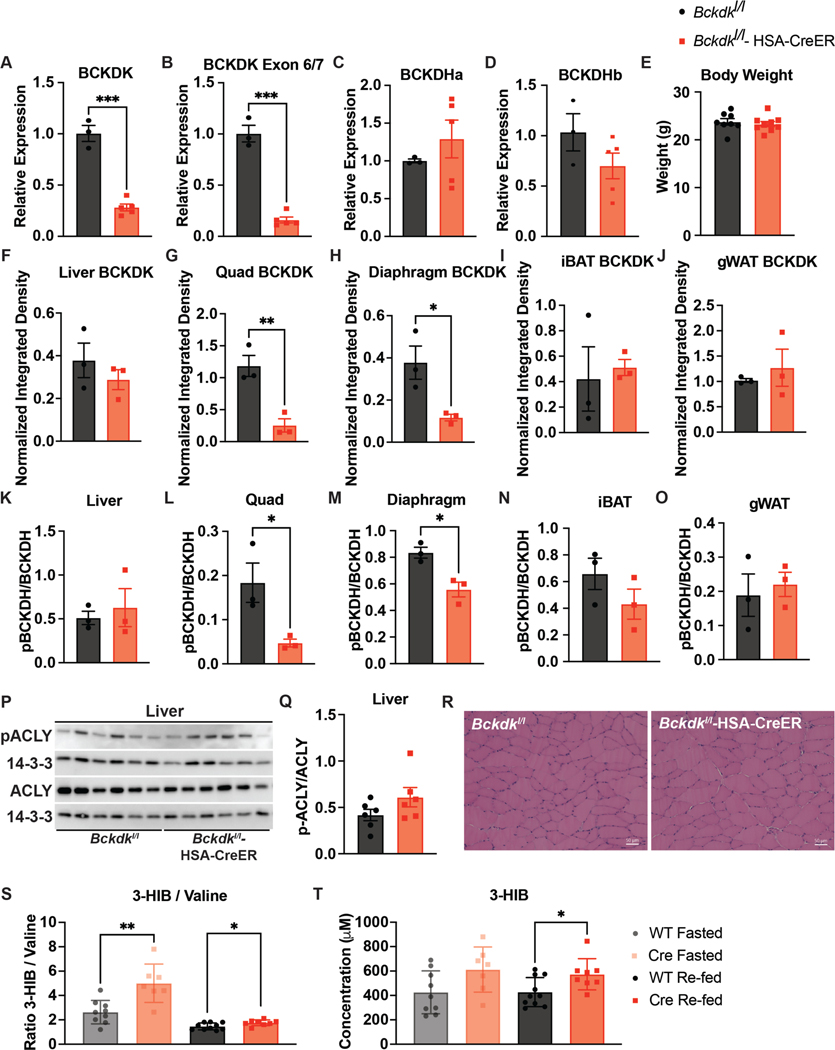
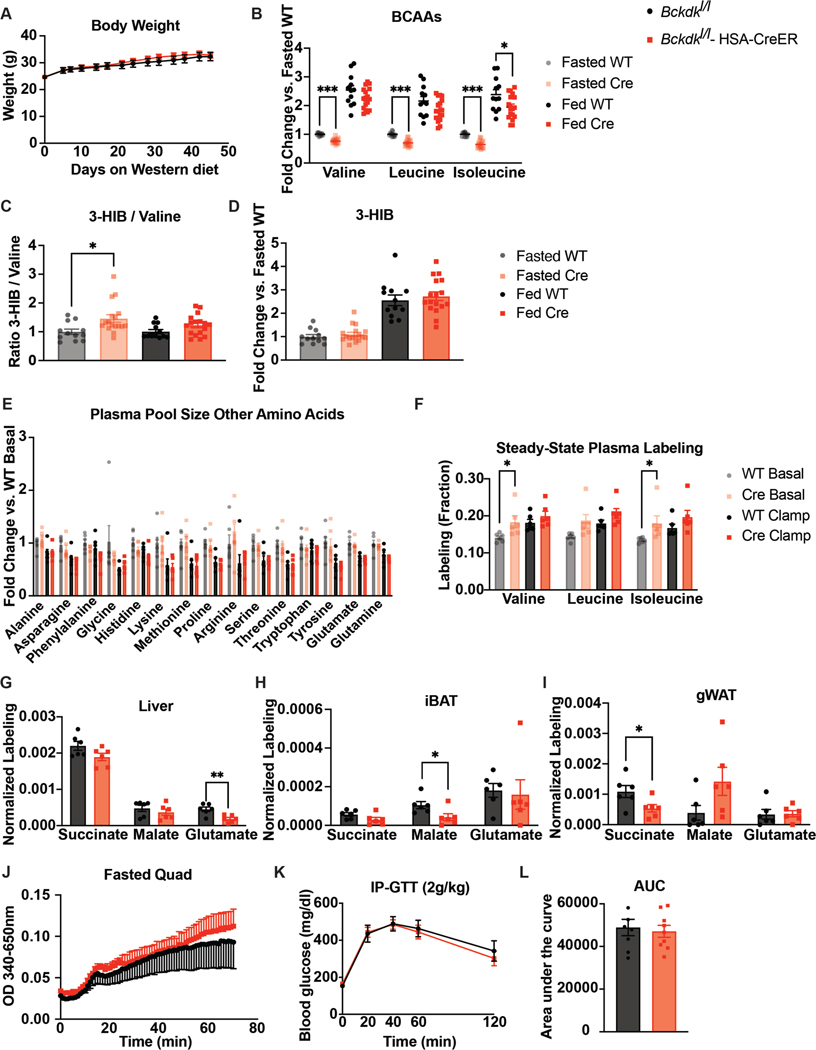
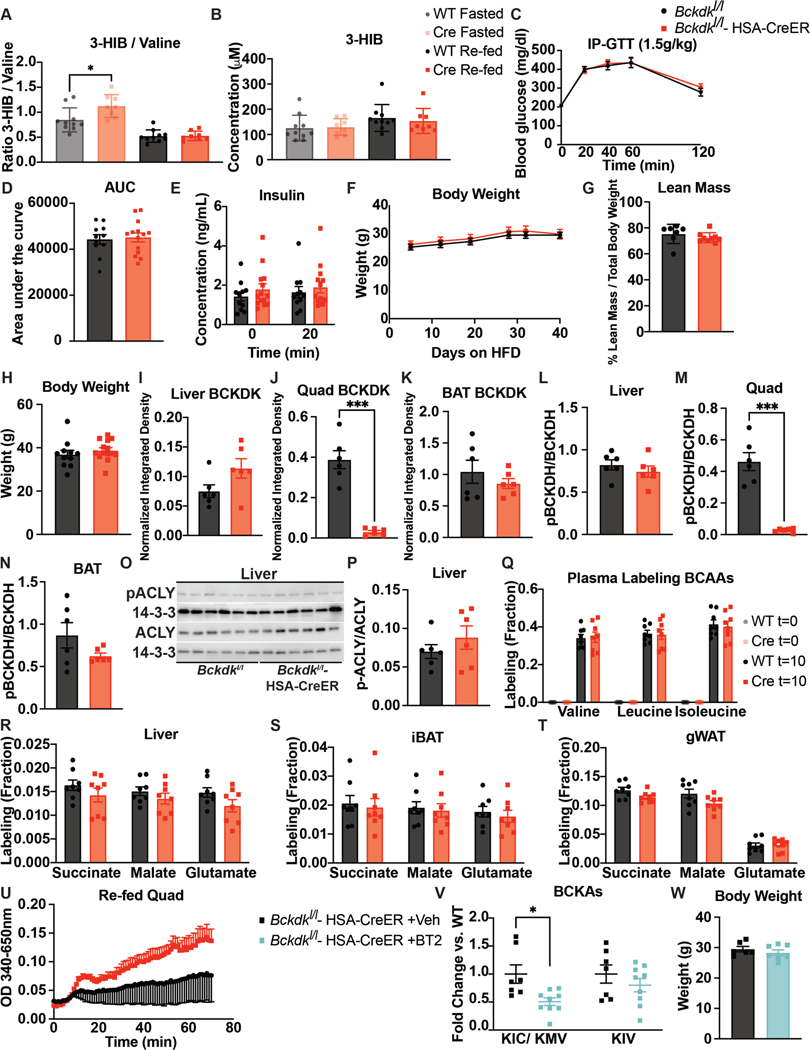
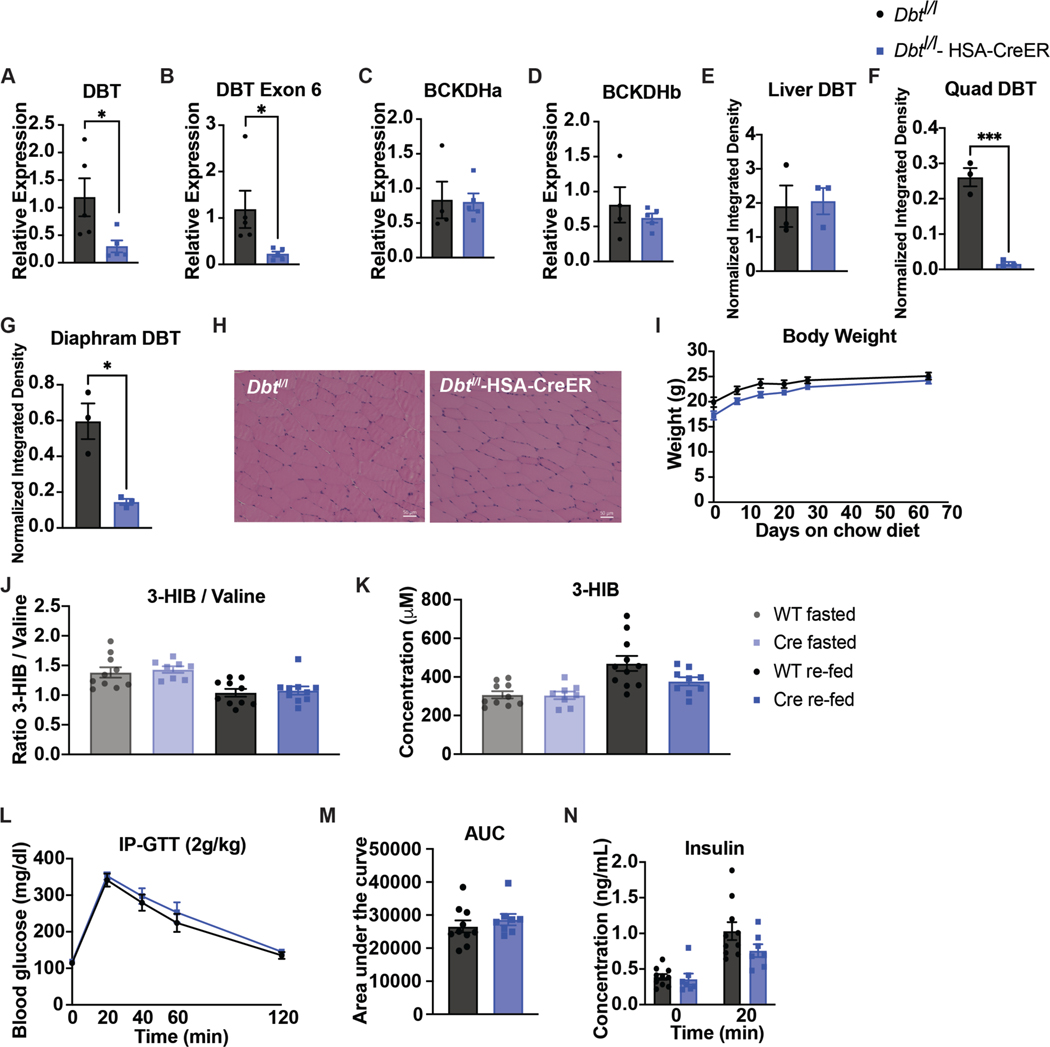
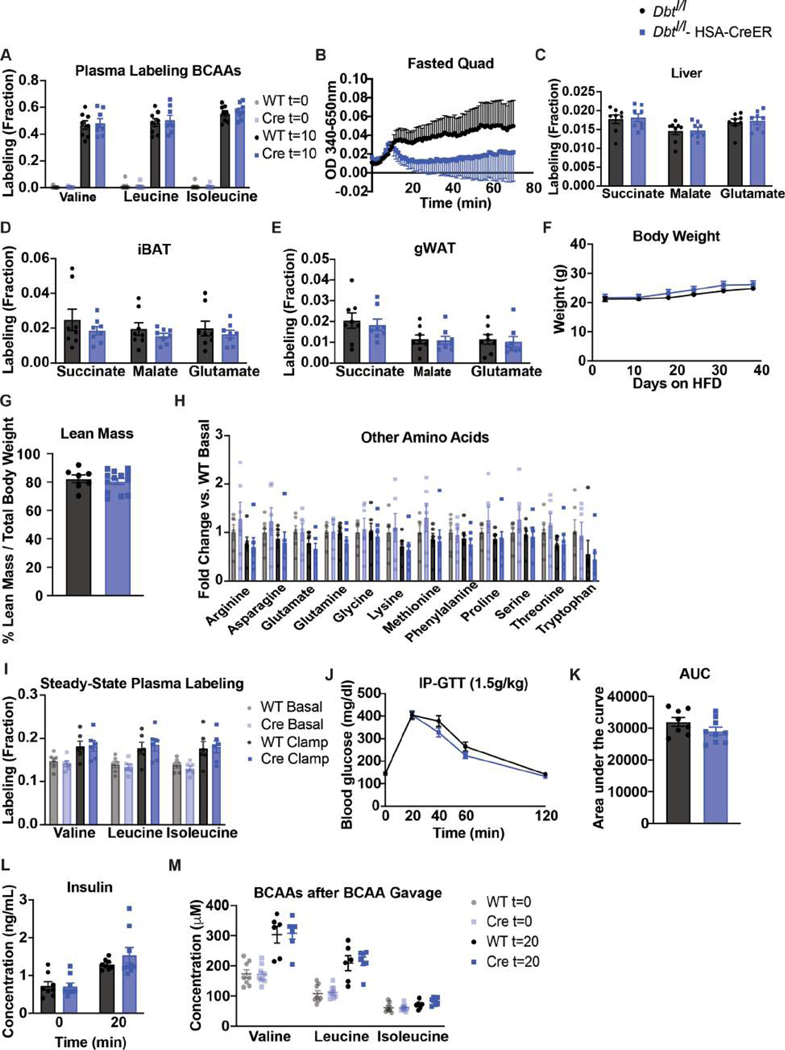
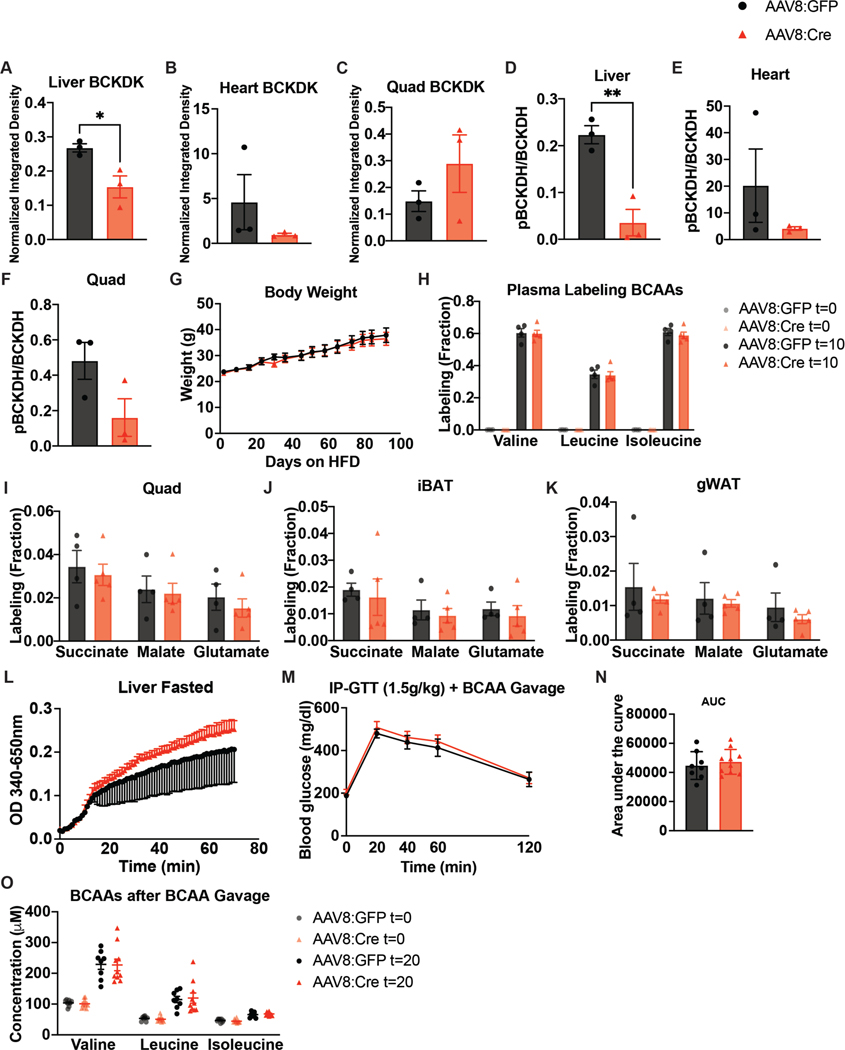
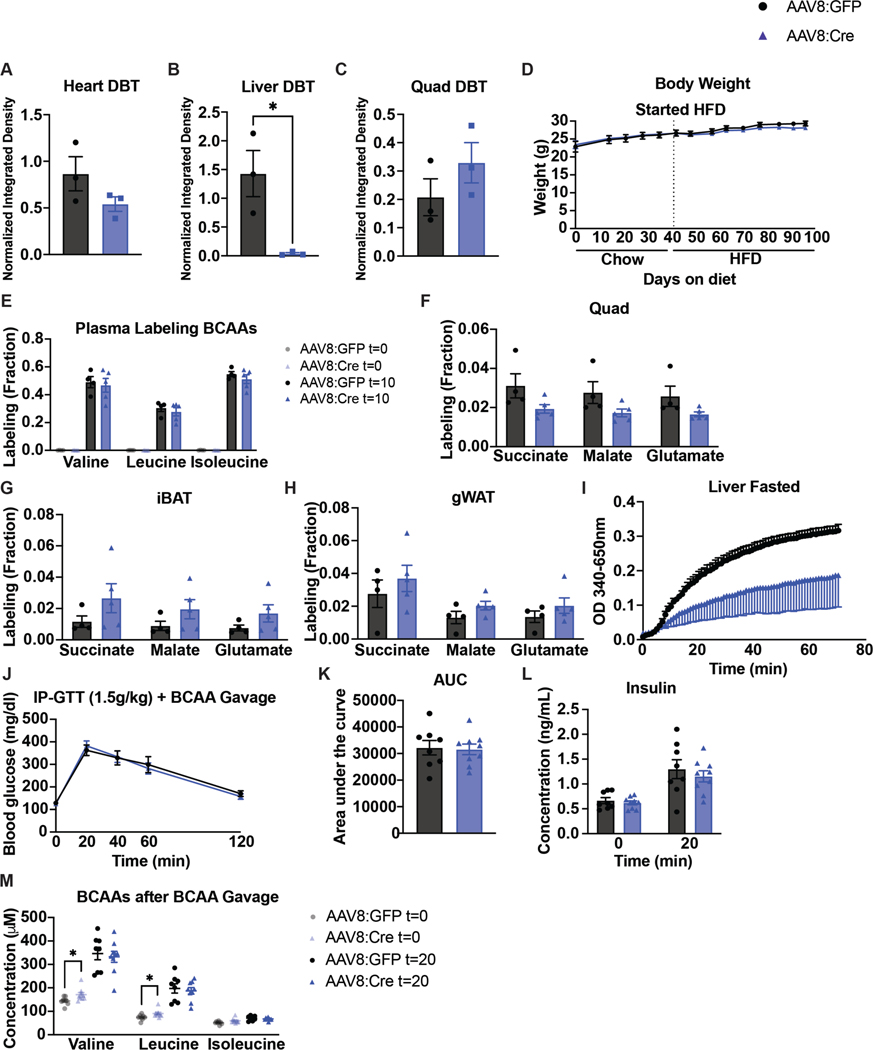
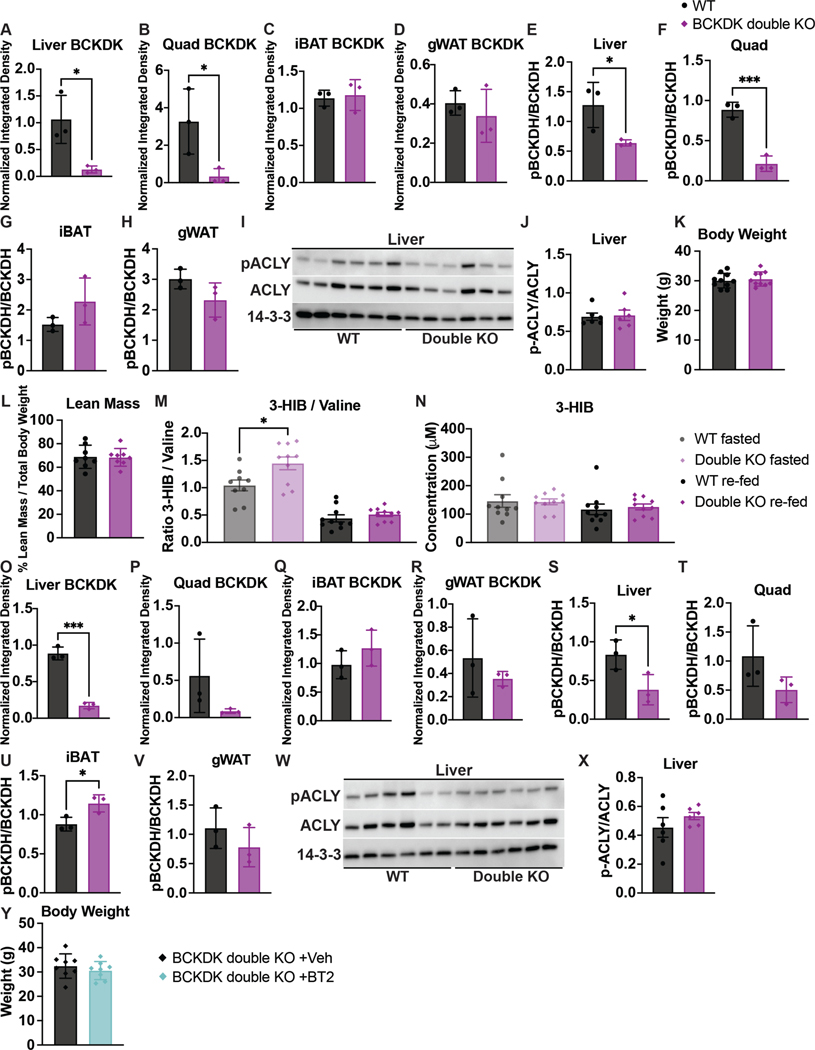
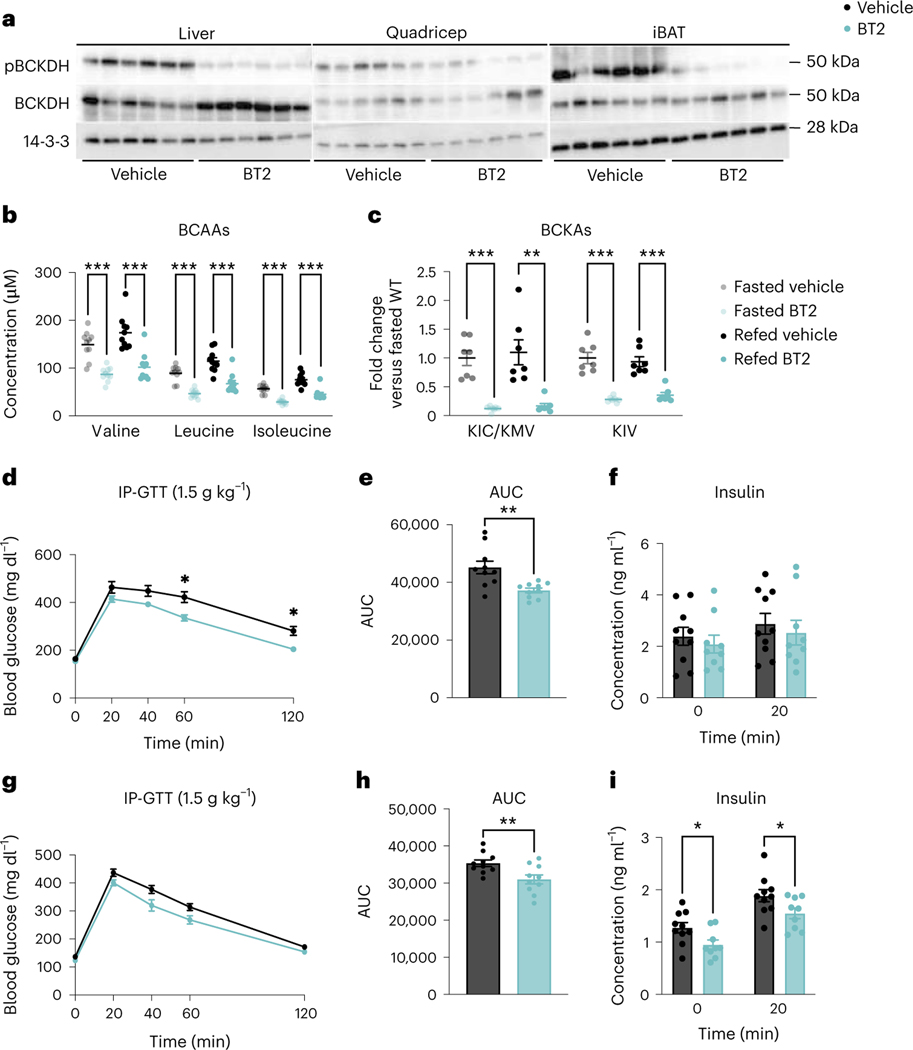
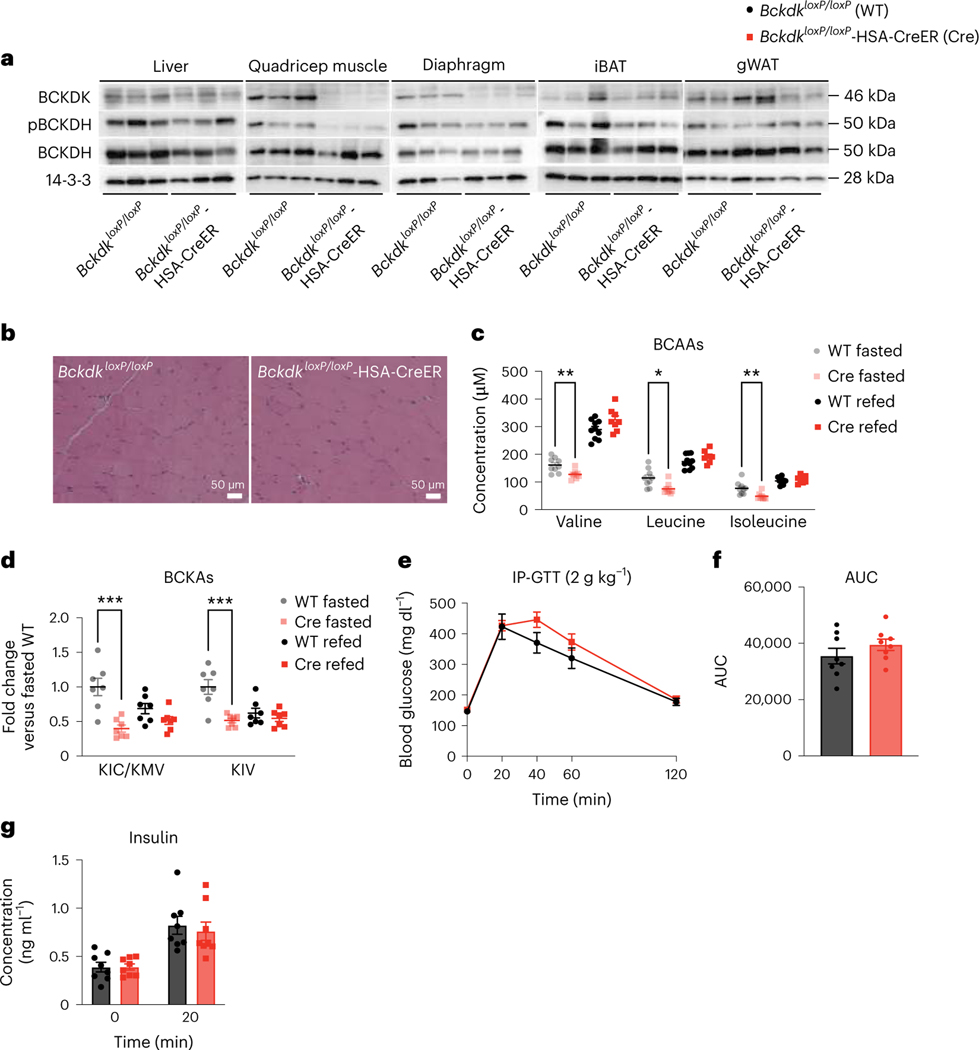
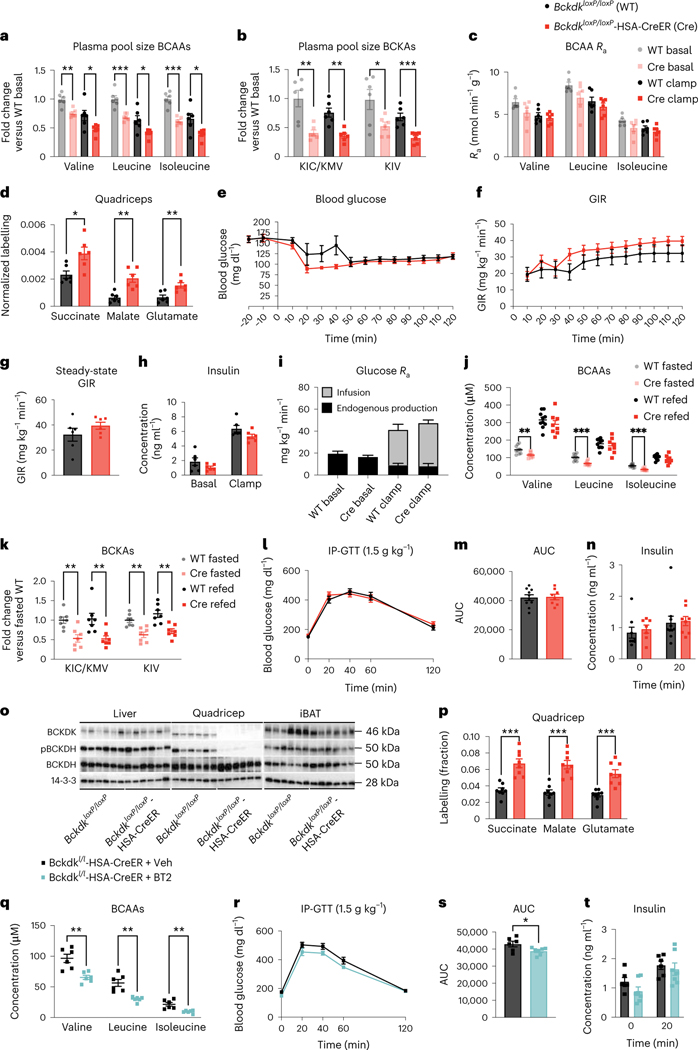
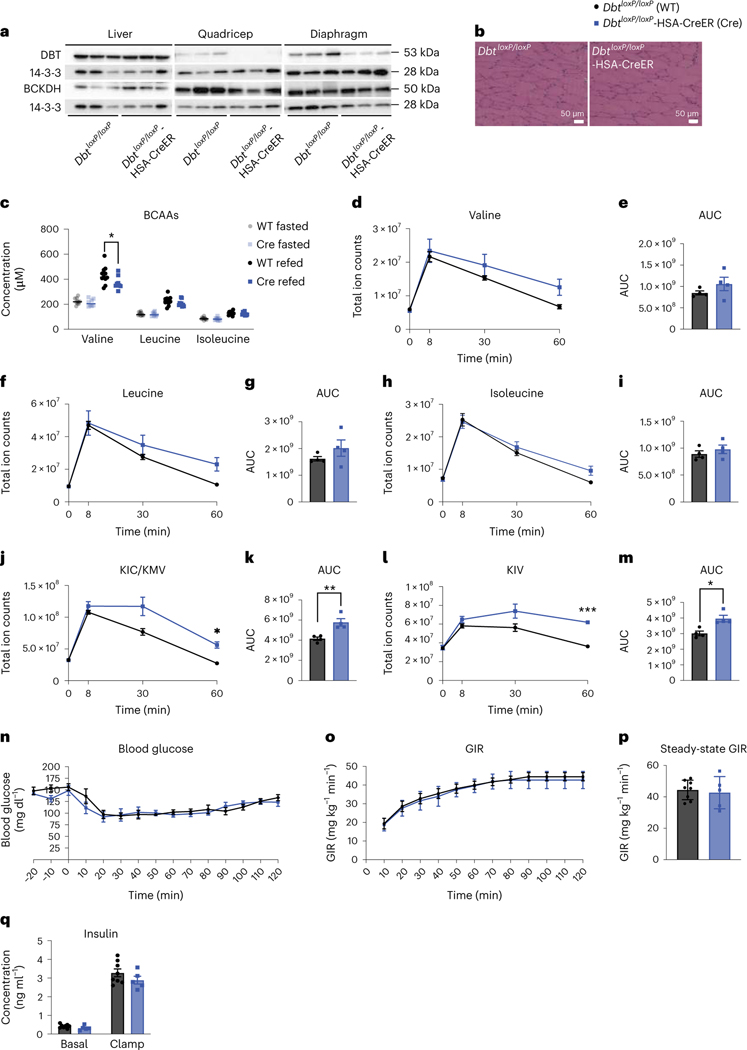
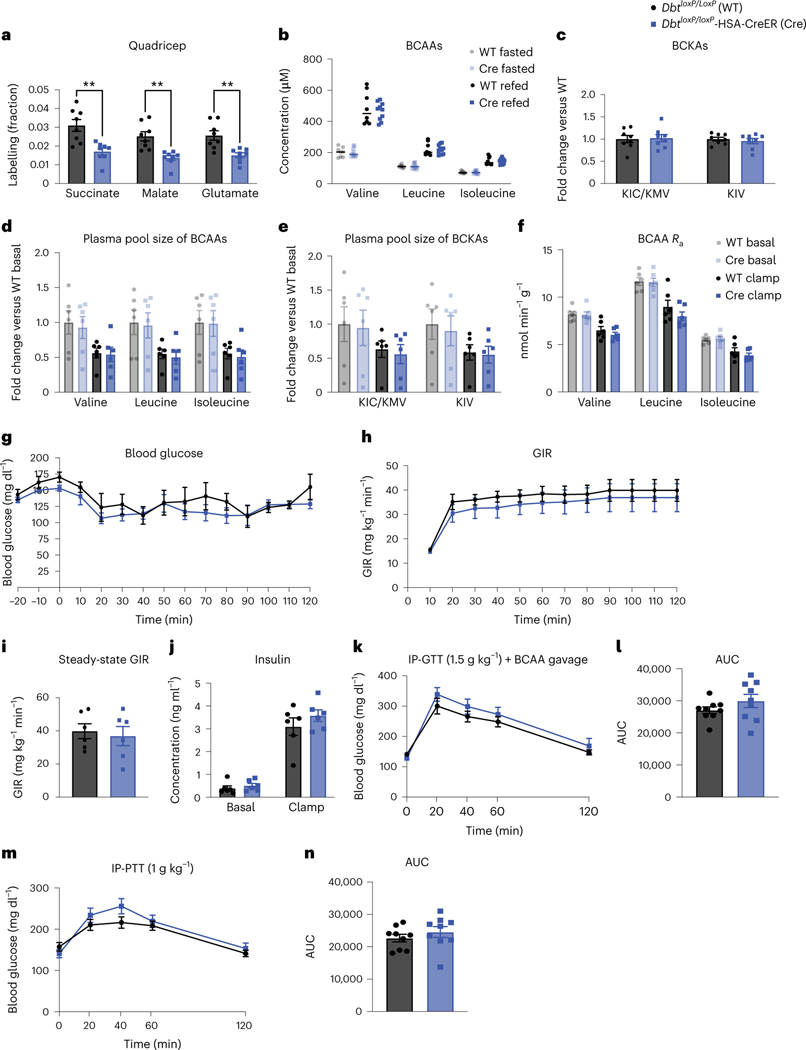
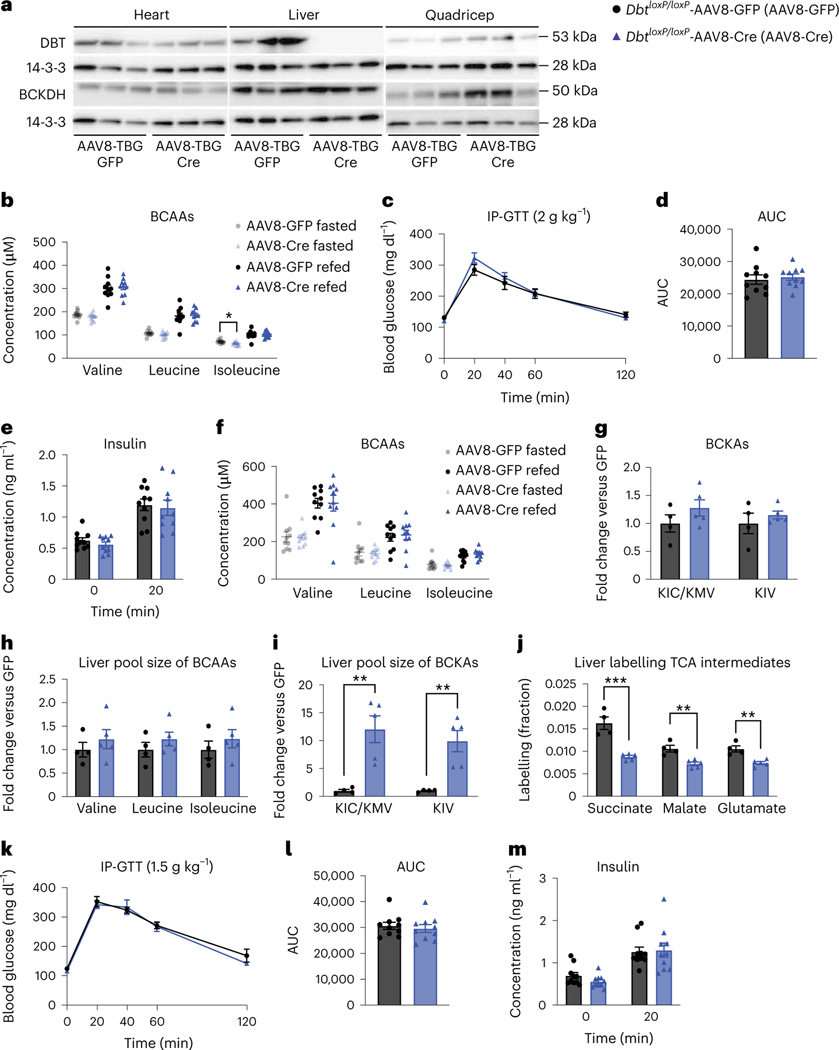
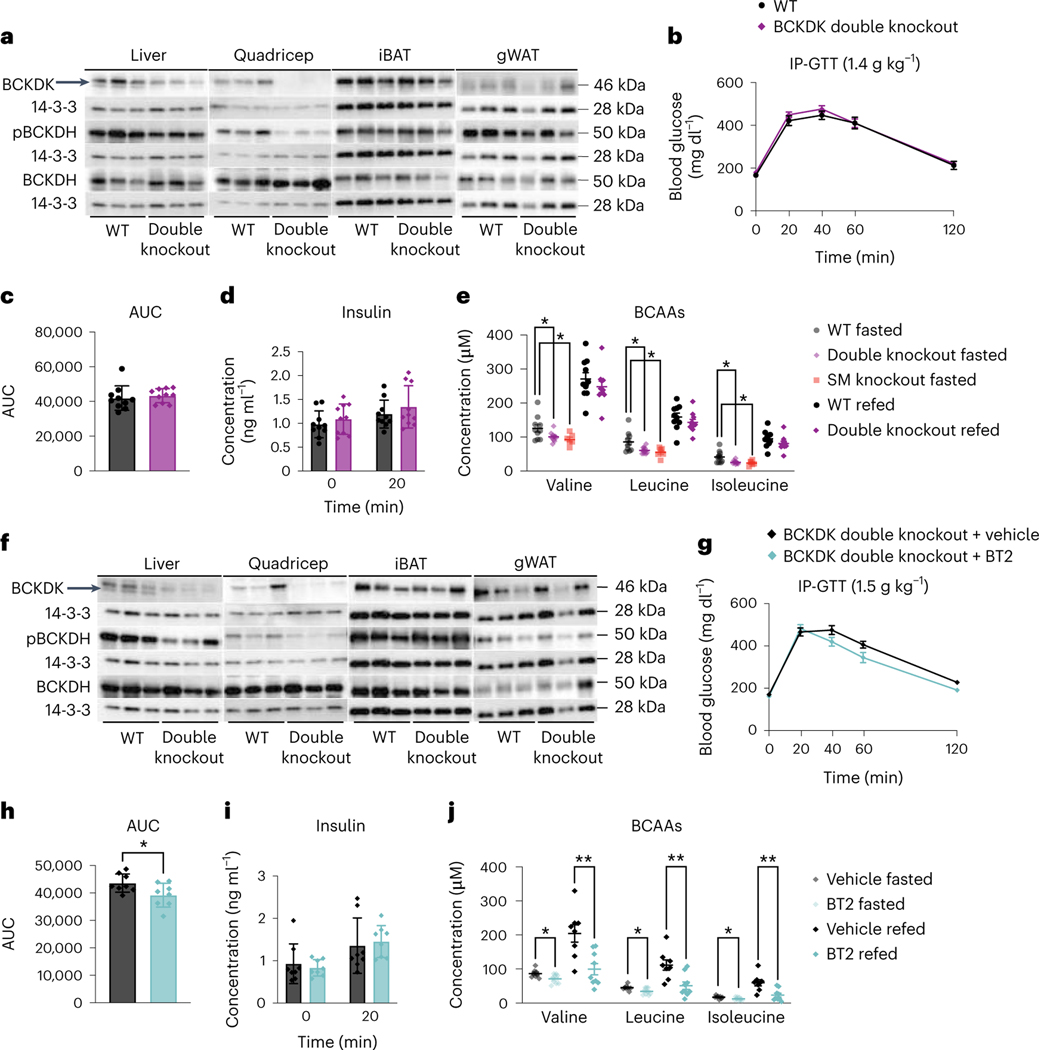
Elevated levels of plasma branched-chain amino acids (BCAAs) have been associated with insulin resistance and type 2 diabetes since the 1960s. Pharmacological activation of branched-chain α-ketoacid dehydrogenase (BCKDH), the rate-limiting enzyme of BCAA oxidation, lowers plasma BCAAs and improves insulin sensitivity. Here we show that modulation of BCKDH in skeletal muscle, but not liver, affects fasting plasma BCAAs in male mice. However, despite lowering BCAAs, increased BCAA oxidation in skeletal muscle does not improve insulin sensitivity. Our data indicate that skeletal muscle controls plasma BCAAs, that lowering fasting plasma BCAAs is insufficient to improve insulin sensitivity and that neither skeletal muscle nor liver account for the improved insulin sensitivity seen with pharmacological activation of BCKDH. These findings suggest potential concerted contributions of multiple tissues in the modulation of BCAA metabolism to alter insulin sensitivity.


Conflict of interest statement

Competing interests

R.J.R.F. and B.B.Z. are employees of Pfizer. This work was in part supported by Pfizer. The other authors declare no competing interests.

Figures

Extended Data Figure 1.
Extended Data Figure 1.. BT2 treatment, acutely or chronically, does not affect body weight.
a-c, Western quantification of the ratio p-BCKDH/BCKDH in fasted tissues; n=6 vehicle- and n=6 BT2-treated. d, Plasma BCAA concentration in HFD-fed mice fasted for 5-hr or re-fed for 2-hr after an overnight fast; n=10 vehicle- and n=10 BT2-treated. Mice were gavaged with 50mg/kg/day of either vehicle or BT2 for 4 weeks prior to plasma collection. e, Body weights of mice used for acute BT2 experiment; n=10 vehicle- and n=10 BT2-treated. f, Body weights of mice used for chronic BT2 experiment; n=10 vehicle- and n=10 BT2-treated. g, Body weights of mice used for chronic BT2 GTT (at treatment day 28); n=10 vehicle- and n=10 BT2-treated. Mice used for these experiments were male C57BL/6J diet-induced obesity (DIO) mice ordered from the Jackson Laboratory. They were age 10–12 weeks and on a HFD for 4–6 weeks. Comparisons of two groups use two-tailed Student’s t-test with significance defined as: ***p<0.001. Experiments with multiple comparisons at different time-points use two-way ANOVA with repeated measures.
Extended Data Figure 2.
Extended Data Figure 2.. BCKDK muscle knockout is specific and does not affect body weight or muscle physiology on chow diet.
a-d, Gene expression data via qPCR of Bckdk, Bckdk exon 6 & 7 (deleted region), Bckdha, and Bckdhb, respectively; n=3 Bckdkl/l (WT) and n=5 Bckdkl/l-HSA-CreER (Cre). e, Body weights; n=8 WT and n=8 Cre. f-j, Western quantification of BCKDK in fasted tissues normalized to loading control; n=3 WT and n=3 Cre. k-o, Western quantification of the ratio pBCKDH/BCKDH in fasted tissues; n=3 WT and n=3 Cre. p, Western blotting for p-ACLY and ACLY in fasted livers; n=6 WT and n=6 Cre. 14-3-3 is the loading control. q, Western quantification of the ratio p-ACLY/ACLY from the blot in p. r, H&E staining of tibialis anterior (TA) muscle. Representative images from n=4 WT and n=3 Cre mice. s, Ratio of 3-HIB/valine, and t, Concentration of 3-HIB in the plasma from mice fasted for 5-hr (n=10 WT and n=8 Cre) or re-fed for 2-hr after an overnight fast (n=10 WT and n=8 Cre). Mice used for these experiments were male, aged 8–10 weeks and fed chow diet. Comparisons of two groups use two-tailed Student’s t-test with significance defined as: *p<0.05, **p<0.01, ***p<0.001.
Extended Data Figure 3.
Extended Data Figure 3.. Increased BCAA oxidation in BCKDK muscle knockout is specific in a fasted state and does not affect body weight or glucose tolerance on Western diet.
a, Body weights of mice; n=8 Bckdkl/l (WT) and n=9 Bckdkl/l-HSA-CreER (Cre). b, Plasma BCAA levels, c, Ratio of 3-HIB/valine, and d, Relative amount of 3-HIB in mice after a 5-hr fast (fasted) and in a fed state collected at 10pm (fed); n=12 WT and n=17 Cre. e, Fasting plasma pool size of various amino acids, and f, Steady-state plasma labeling of BCAAs by U13C-BCAAs (fraction) during steady-state infusion of U13C-BCAAs before (basal, 5-hr fasted) and during (clamp, 7-hr fasted) HIEC in n=6 WT and n=6 Cre mice. g, Normalized labeling of TCA cycle intermediates by U13C-BCAAs in liver, h, iBAT, and i, gWAT at the end of the infusion and HIEC (7-hr fasted); n=6 WT and n=6 Cre. j, BCKDH complex activity measured in fasted quad samples fed HFD for 4 weeks; n=4 WT and n=3 Cre. k, 2g/kg glucose IP-GTT in 5-hr fasted mice fed Western diet for 5 weeks; n=8 WT and n=9 Cre. l, Area-under-the-curve (AUC) for the GTT in k. Mice used in these experiments were male, aged 18–24 weeks and fed Western diet for 5–12 weeks. Comparisons of two groups use two-tailed Student’s t-test with significance defined as: *p<0.05, **p<0.01, ***p<0.001. Experiments with multiple comparisons at different time-points use two-way ANOVA with repeated measures.
Extended Data Figure 4.
Extended Data Figure 4.. Increased BCAA oxidation in BCKDK muscle knockout is specific in a fed state and does not affect body weight or glucose tolerance on HFD.
a, Ratio of 3-HIB/valine, and b, Concentration of 3-HIB in mice fasted for 5-hr or re-fed for 2-hr after an overnight fast; n=10 Bckdkl/l (WT) and n=8 Bckdkl/l-HSA-CreER (Cre). c, 1.5g/kg IP-GTT in 5-hr fasted mice; n=11 WT and n=14 Cre. d, Area-under-the-curve (AUC) for GTT in c. e, Insulin concentration at t=0 and t=20 min (n=11 WT and n=14 Cre) during GTT from c. f, Weights; n=10 WT and n=8 Cre. g, Lean mass; n=7 WT and n=9 Cre. h, Weights; n=11 WT and n=14 Cre. i-k, Quantification of BCKDK in re-fed tissues normalized to loading control. l-n Quantification of the ratio pBCKDH/BCKDH in re-fed tissues. o, Western blotting for p-ACLY&ACLY in re-fed livers. 14-3-3 is the loading control. p, Quantification of the ratio p-ACLY/ACLY. n=6 WT and n=6 Cre for i-p. q, Labeling fraction of BCAAs in plasma before (t=0) and 10 min after gavage (t=10) of U13C-BCAAs in mice re-fed for 2-hr, and labeling fraction of TCA cycle intermediates 10 min after gavage of U13C-BCAAs in re-fed r, liver, s, iBAT, and t, gWAT; n=8 WT and n=8 Cre. u, BCKDH activity in re-fed quads; n=4 WT and n=3 Cre. v, Plasma BCKAs in Bckdkl/l-HSA-CreER mice treated with 100mg/kg of vehicle (Veh; n=6) or BT2 (n=7) the night before and morning of collection. w, Weights of Bckdkl/l-HSA-CreER mice treated with Veh or BT2. Mice in a, b, & f were male, aged 14–24 weeks and fed HFD for 4–5 weeks. Mice in c-e, & h were male, aged 20–26 weeks and fed HFD for 10 weeks. Mice in g & l-u were male, aged 16–17 weeks and fed HFD for 4 weeks. Mice in v & w were male, aged 12–20 and fed HFD for 4 weeks. Comparisons of two groups use two-tailed Student’s t-test with significance defined as: *p<0.05, **p<0.01, ***p<0.001. Experiments with multiple comparisons at different time-points use two-way ANOVA with repeated measures.
Extended Data Figure 5.
Extended Data Figure 5.. DBT muscle knockout is specific and does not affect body weight, muscle physiology, or glucose tolerance on chow diet.
a-d, Gene expression data via qPCR of Dbt, Dbt exon 6 (deleted region), Bckdha, and Bckdhb, respectively; n=3 Dbtl/l (WT) and n=5 Dbtl/l-HSA-CreER (Cre). e-g, Western quantification of DBT in fasted tissues normalized to loading control; n=3 WT and n=3 Cre. h, H&E staining of tibialis anterior (TA) muscle. Representative images from n=3 WT and n=3 Cre. I, Ratio of 3-HIB/valine, and j, Concentration of 3-HIB from mice fasted for 5-hr (n=10 WT and n=8 Cre) or re-fed for 2-hr after an overnight fast (n=11 WT and n=9 Cre). k, Body weights; n=10 WT and n=8 Cre. l, 2g/kg glucose IP-GTT in 5-hr fasted mice; n=10 WT and n=10 Cre. m, Area-under-the-curve (AUC) for the GTT in l. n, Insulin concentration at t=0 and t=20 min (n=10 WT and n=7 Cre) during GTT from l. Mice used in these experiments were male, aged 10–19 weeks fed chow diet. Comparisons of two groups use two-tailed Student’s t-test with significance defined as: *p<0.05 and ***p<0.001. Experiments with multiple comparisons at different time-points use two-way ANOVA with repeated measures.
Extended Data Figure 6.
Extended Data Figure 6.. Decreased BCAA oxidation in DBT muscle knockout is muscle specific and does not affect body weight or glucose tolerance on HFD.
a, Plasma labeling of BCAAs after U13C-BCAAs gavage (fraction) in 5-hr fasted mice; n=8 Dbtl/l (WT) and n=8 Dbtl/l-HSA-CreER (Cre). b, BCKDH complex activity measured in fasted quads from n=4 WT and n=4 Cre mice. Labeling fraction of TCA cycle intermediates 10 min after gavage of U13C-BCAAs in c, liver d, iBAT, & e, gWAT in 5-hr fasted mice; n=8 WT and n=8 Cre. f, Body weights; n=10 WT and n=14 Cre. g, Lean mass; n= WT and n= Cre. Fasting plasma pool size of various amino acids during steady-state infusion of U13C-BCAAs before (basal, 5-hr fasted) and during (clamp, 7-hr fasted) HIEC in n=6 WT and n=6 Cre mice. h, Plasma BCAA concentration in 5-hr fasted or 2-hr re-fed after an overnight fast in mice; n=8 WT and n=10 Cre. i, Steady-state plasma labeling of BCAAs by infusion of U13C-BCAAs before (basal) and during (clamp) HIEC; n=6 WT and n=6 Cre mice fed. j, 1.5g/kg glucose IP-GTT in 5-hr fasted mice fed HFD for 4 weeks; n=8 WT and n=9 Cre. k, Area-under-the-curve (AUC) for the GTT in j. l, Insulin concentration at t=0 and t=20 min (n=8 WT and n=9 Cre) during the GTT from j. m, Plasma BCAA concentration in 5-hr fasted mice before (t=0), n=8 WT and n=9 Cre, and 20 min after (t=20), n=6 WT and n=7 Cre, a gavage of BCAAs. Mice used in these experiments were male, aged 10–20 weeks fed HFD for 4–8 weeks. Comparisons of two groups use two-tailed Student’s t-test. Experiments with multiple comparisons at different time-points use two-way ANOVA with repeated measures.
Extended Data Figure 7.
Extended Data Figure 7.. BCKDK liver knockout does not affect body weight or glucose tolerance at various time points on HFD or after a BCAA challenge.
a-c, Western quantification of BCKDK in tissues normalized to loading control; n=3 Bckdkl/l-AAV8:GFP (GFP) and n=3 Bckdkl/l-AAV8:Cre (Cre). d-f, Western quantification of the ratio pBCKDH/BCKDH; n=3 GFP and n=3 Cre. g, Body weights of n=9 GFP and n=10 Cre mice on HFD. h, Plasma labeling of BCAAs after U13C-BCAAs gavage (fraction) 5-hr fasted mice; n=4 GFP and n=5 Cre. Labeling fraction of TCA cycle intermediates 10 min post U13C-BCAA gavage in i, quad j, iBAT, & k, gWAT in 5-hr fasted mice; n=4 GFP and n=5 Cre. l, BCKDH complex activity assay measured in fasted livers from n=4 GFP and n=3 Cre mice. m, 1.5g/kg glucose IP-GTT in 5-hr fasted mice fed HFD after a BCAA gavage given at t=0; n=8 GFP and n=10 Cre. n, Area-under-the-curve (AUC) for the GTT in m. o, Plasma BCAA concentration of 5-hr fasted plasma before (t=0) (n=8 GFP and n=9 Cre) and 20 min after (t=20) (n=8 GFP and n=10 Cre) a BCAA gavage from GTT + BCAA gavage in m. Mice used in these experiments were male, aged 8–26 weeks and on a HFD for 2–12 weeks. Comparisons of two groups use two-tailed Student’s t-test with significance defined as: *p<0.05 and **p<0.01. Experiments with multiple comparisons at different time-points use two-way ANOVA with repeated measures.
Extended Data Figure 8.
Extended Data Figure 8.. DBT liver knockout does not affect body weight or glucose tolerance on multiple diets or after a BCAA challenge.
a-c, Western quantification of DBT in tissues normalized to loading control; n=3 Dbtl/l-AAV8:GFP (GFP) and n=3 Dbtl/l-AAV8:Cre (Cre). d, Body weights of n=10 GFP and n=10 Cre mice on chow and HFD. e, Plasma labeling of BCAAs after U13C-BCAA gavage (fraction); n=4 GFP and n=5 Cre. Labeling fraction of TCA cycle intermediates 10 min post U13C-BCAA gavage in f, quad g, iBAT, & h, gWAT in 5-hr fasted mice; n=4 GFP and n=5 Cre. i, BCKDH complex activity measured in fasted livers from n=4 GFP and n=4 Cre mice. j, 1.5g/kg glucose IP-GTT in 5-hr fasted mice fed HFD for 4 weeks after a BCAA gavage given at t=0; n=8 GFP and n=9 Cre. k, Area-under-the-curve (AUC) for the GTT in j. l, Insulin concentration at t=0 and t=20 min (n=8 GFP and n=9 Cre) during GTT from j. m, Plasma BCAA concentration in 5-hr fasted mice before (t=0) and 20 min after (t=20) a gavage of BCAAs from GTT + BCAA gavage in j; n=8 GFP and n=9 Cre. Mice used in these experiments were male, aged 16–24 weeks and fed a chow diet for 4–5 weeks, followed by a HFD for 4–6 weeks. Comparisons of two groups use two-tailed Student’s t-test with significance defined as: *p<0.05. Experiments with multiple comparisons at different time-points use two-way ANOVA with repeated measures.
Extended Data Figure 9.
Extended Data Figure 9.. Double knockout of BCKDK in both skeletal muscle and liver is specific in fasted and re-fed states.
a-d, Western quantification of BCKDK in fasted tissues normalized to loading control collected from n=3 WT and n=3 BCKDK double KO (Double KO) mice. e-h, Western quantification of the ratio pBCKDH/BCKDH in fasted tissues; n=3 WT and n=3 Double KO. i, Western blotting for p-ACLY and ACLY in fasted livers. 14-3-3 is the loading control; n=6 WT and n=6 Double KO. j, Western quantification of the ratio p-ACLY/ACLY from the blot in i. k, Body weights of n=10 WT and n=10 Double KO mice on HFD. l, Lean mass of n=8 WT and n=8 Double KO mice on HFD. m, Ratio of 3-HIB/valine, and n, Concentration of 3-HIB in plasma in mice fasted for 5-hr or re-fed for 2-hr after an overnight fast; n=10 WT and n=10 Double KO mice fed HFD. o-r, Western quantification of BCKDK in re-fed tissues normalized to loading control; n=3 WT and n=3 Double KO. s-v, Western quantification of the ratio pBCKDH/BCKDH in re-fed tissues; n=3 WT and n=3 Double KO. w, Western blotting for p-ACLY and ACLY in re-fed livers. 14-3-3 is the loading control; n=6 WT and n=6 Double KO. x, Western quantification of the ratio p-ACLY/ACLY from the blot in w. y, Body weights of n=8 BCKDK double KO + vehicle (Veh)-treated and n=8 BCKDK double KO + BT2-treated mice fed HFD. Mice used for these experiments were aged 13–23 weeks and fed HFD for 6–7 weeks. Comparisons of two groups use two-tailed Student’s t-test with significance defined as: *p<0.05 and ***p<0.001. Experiments with multiple comparisons at different time-points use two-way ANOVA with repeated measures.
Fig. 1 |
Fig. 1 |. Systemic BCAA oxidation improves insulin sensitivity.
a, Western blotting of tissues from n = 6 vehicle and n = 6 BT2-treated mice (14-3-3 is the loading control). b,c, Plasma BCAA concentrations (n = 10 vehicle and n = 10 BT2-treated) (b) and plasma BCKA levels (n = 10 vehicle and n = 10 BT2-treated) (c) in mice fasted for 5 h or refed for 2 h after overnight fasting. d, Intraperitoneal GTT (IP-GTT, 1.5 g kg−1) in mice fasted for 5 h after acute BT2 treatment; n = 10 vehicle and n = 10 BT2-treated mice on HFD for 5 weeks. e, AUC for the GTT in d. f, Insulin concentration at t = 0 and t = 20 (n = 10 vehicle and n = 9 BT2-treated mice) during the acute BT2 treatment GTT from d. af, Acute BT2 treatment was achieved via gavage with 100 mg kg−1 of either vehicle or BT2 the night before and the morning of the experiment. g, Glucose IP-GTT (1.5 g kg−1) in mice fasted for 5 h after chronic BT2 treatment; n = 10 vehicle and n = 10 BT2-treated mice on HFD for 4 weeks. h, AUC for the GTT in g. i, Insulin concentration at t = 0 and t = 20 min (n = 10 vehicle and n = 9 BT2-treated mice) during chronic BT2 treatment GTT from g. gi, Chronic BT2 treatment was achieved via 50 mg kg−1 day−1 gavage of mice treated with either vehicle or BT2 for 4 weeks. Mice used for these experiments were male C57BL/6J diet-induced obesity (DIO) mice aged 10–12 weeks and fed HFD for 4–6 weeks. Data are presented as the mean ± s.e.m. When two groups were compared, a two-tailed Student’s t-test was used, with significance defined as *P < 0.05, **P < 0.01 and ***P < 0.001. In the experiments with multiple comparisons at different time points, a repeated measures, two-way analysis of variance (ANOVA) was used with significance defined as *P < 0.05. b, Valine fasted P = 0.000012; valine refed P = 0.000092; leucine fasted P < 0.000001; leucine refed P = 0.000129; isoleucine fasted P < 0.000001; isoleucine refed P = 0.000031. c, KIC/KMV fasted P = 0.000023; KIC/KMV refed P = 0.001194; KIV fasted P = 0.000011; KIV refed P = 0.000062. d, 60 min P = 0.0227; 120 min P = 0.0142. e, P = 0.003179. h, P = 0.009880. i, 0 min P = 0.027731; 20 min P = 0.045392.
Fig. 2 |
Fig. 2 |. Increased SM BCAA oxidation does not affect insulin sensitivity in mice fed normal chow.
a, Western blotting of tissues collected from n = 3 fasted BckdkloxP/loxP and n = 3 fasted BckdkloxP/loxP-HSA-CreER mice (14-3-3 is the loading control). b, H&E staining of quadricep muscle. Representative images from n = 4 BckdkloxP/loxP and n = 3 BckdkloxP/loxP-HSA-CreER mice. c, Plasma BCAA concentrations in mice fasted for 5 h (n = 9 BckdkloxP/loxP and n = 8 BckdkloxP/loxP-HSA-CreER) or refed for 2 h after overnight fasting (n = 10 BckdkloxP/loxP and n = 8 BckdkloxP/loxP-HSA-CreER). d, Plasma BCKA levels in fasted or refed mice (n = 7 BckdkloxP/loxP and n = 7 BckdkloxP/loxP-HSA-CreER). e, IP-GTT (2 g kg−1) using n = 8 BckdkloxP/loxP and n = 8 BckdkloxP/loxP-HSA-CreER chow-fed mice fasted for 5 h. f, AUC for the GTT in e. g, Insulin concentration at t = 0 and t = 20 min (n = 8 BckdkloxP/loxP and n = 8 BckdkloxP/loxP-HSA-CreER mice) during the GTT from d. The mice used for these experiments were male, 8–10-weeks old and fed normal chow. Data are presented as the mean ± s.e.m. When two groups were compared, a two-tailed Student’s t-test was used, with significance defined as *P < 0.05 and **P < 0.01. In the experiments with multiple comparisons at different time points, a repeated measures, two-way ANOVA was used. c, Valine fasted P = 0.006624; leucine fasted P = 0.012123; isoleucine fasted P = 0.006569. d, KIC/KMV fasted P = 0.000837; KIV fasted P = 0.000859.
Fig. 3 |
Fig. 3 |. Increased SM BCAA oxidation does not affect insulin sensitivity in mice fed a variety of HFDs.
ac, Plasma BCAAs (a), plasma BCKAs (b) and Ra (c) of BCAAs collected during [U-13C]-labelled BCAA steady-state infusion before (basal, fasted for 5 h) and during (clamp, fasted for 7 h) HIEC; n = 6 BckdkloxP/loxP and n = 6 BckdkloxP/loxP-HSA-CreER. d, Normalized labelling of quadricep TCA cycle intermediates by [U-13C]-labelled BCAAs; n = 6 BckdkloxP/loxP and n = 6 BckdkloxP/loxP-HSA-CreER. e, Blood glucose. f, GIR. g, Steady-state GIR during HIEC. h, Insulin before and during HIEC. i, Glucose Ra before and during HIEC; the black bar is the endogenous glucose measured using d-glucose-6,6-d2, while the grey bar is glucose infused during HIEC. ei, n = 6 BckdkloxP/loxP and n = 6 BckdkloxP/loxP-HSA-CreER. ai, Mice were male, 20–24-weeks old and fed Western diet for 12 weeks. j, Plasma BCAAs (n = 10 BckdkloxP/loxP and n = 8 BckdkloxP/loxP-HSA-CreER). k, Plasma BCKAs (n = 7 BckdkloxP/loxP and n = 7 BckdkloxP/loxP-HSA-CreER) in mice fasted for 5 h or refed for 2 h after overnight fasting. l, IP-GTT (1.5 g kg−1) in mice fasted for 5 h; n = 10 BckdkloxP/loxP and n = 8 BckdkloxP/loxP-HSA-CreER. m, AUC for GTT in l. n, Insulin at t = 0 (n = 8 BckdkloxP/loxP and n = 7 BckdkloxP/loxP-HSA-CreER) and t = 20 min (n = 10 BckdkloxP/loxP and n = 8 BckdkloxP/loxP-HSA-CreER) during the GTT from l. jn, Mice were male, 14–24-weeks old and were fed HFD for 4 weeks. o, Western blotting of refed tissues (14-3-3 is the loading control); n = 6 BckdkloxP/loxP and n = 6 BckdkloxP/loxP-HSA-CreER. p, Labelling fraction of TCA cycle intermediates by [U-13C]-labelled BCAA gavage in the quadriceps of fed mice; n = 8 BckdkloxP/loxP and n = 8 BckdkloxP/loxP-HSA-CreER. o,p, Mice were male, 16–17-weeks old and were fed HFD for 4 weeks. q, Plasma BCAAs after 100 mg kg−1 vehicle or BT2 treatment the night before and the morning of GTT; n = 6 vehicle and n = 6 BT2. r, 1.5 g kg−1 IP-GTT in BckdkloxP/loxP-HSA-CreER mice fasted for 5 h after the same vehicle or BT2 regimen in q; n = 6 vehicle and n = 7 BT2. s, AUC from the GTT in r. t, Insulin at t = 0 and t = 20 during the GTT from r; n = 6 vehicle and n = 7 BT2. qt, Mice were male, 12–20-weeks old and were fed HFD for 4 weeks; n = 6 BckdkloxP/loxP-HSA-CreER + Veh and n = 6–7 BckdkloxP/loxP-HSA-CreER + BT2. Data are presented as the mean ± s.e.m. When two groups were compared, a two-tailed Student’s t-test was used, with significance defined as *P < 0.05, **P < 0.01 and ***P < 0.001. In the experiments with multiple comparisons at different time points, a repeated measures, two-way ANOVA was used. a, Valine basal P = 0.001199, valine clamp P = 0.031378; leucine basal P = 0.000636, leucine clamp P = 0.020943; isoleucine basal P = 0.000046, isoleucine clamp P = 0.017202. b, KIC/KMV basal P = 0.002799, KIC/KMV clamp P = 0.001194; KIV basal P = 0.034170, KIV clamp P = 0.000816. d, Succinate P = 0.015469; malate P = 0.001603; glutamate P = 0.005976. j, Valine fasted P = 0.005766; leucine fasted P = 0.000365; isoleucine fasted P = 0.000065. k, KIC/KMV fasted P = 0.003234, KIC/KMV refed P = 0.008413; KIV fasted P = 0.001603, KIV-refed P = 0.001892. p, Succinate P = 0.000100; malate P = 0.000072; glutamate P = 0.000289. q, Valine P = 0.002310; leucine P = 0.001134; isoleucine P = 0.002717. s, P = 0.037021.
Fig. 4 |
Fig. 4 |. Decreased SM BCAA oxidation does not affect insulin sensitivity in mice fed normal chow.
a, Western blotting of tissues collected from n = 3 DbtloxP/loxP and n = 3 DbtloxP/loxP-HSA-CreER mice (14-3-3 is the loading control). b, H&E staining of quadricep muscle. Representative images from n = 4 DbtloxP/loxP and n = 4 DbtloxP/loxP-HSA-CreER mice. c, Plasma BCAA concentration in mice fasted for 5 h (n = 10 DbtloxP/loxP and n = 8 DbtloxP/loxP-HSA-CreER) or refed for 2 h after overnight fasting (n = 11 DbtloxP/loxP and n = 9 DbtloxP/loxP-HSA-CreER). di, Plasma BCAA levels (d,f,h) and accompanying AUCs (e,g,i). jm, Plasma BCKA levels (j,l) and accompanying AUCs (k,m) taken at various time points after BCAA gavage after a 5-h fast; n = 4 DbtloxP/loxP and n = 4 DbtloxP/loxP-HSA-CreER. n, Blood glucose. o, GIR. p, Steady-state GIR during HIEC; n = 8 DbtloxP/loxP and n = 5 DbtloxP/loxP-HSA-CreER. q, Insulin concentration before and during HIEC; n = 8 DbtloxP/loxP and n = 5 DbtloxP/loxP-HSA-CreER. The mice used in these experiments were male, 10–19-weeks old and were fed normal chow. Data are presented as the mean ± s.e.m. When two groups were compared, a two-tailed Student’s t-test was used, with significance defined as *P < 0.05 and **P < 0.01. In the experiments with multiple comparisons at different time points, a repeated measures, two-way ANOVA was used with significance defined as *P < 0.05 and ***P < 0.001. c, Valine refed P = 0.038708. j, 60 min P = 0.0226. k, P = 0.006699. l, 60 min P < 0.0001. m, P = 0.010268.
Fig. 5 |
Fig. 5 |. Decreased SM BCAA oxidation does not affect insulin sensitivity in mice fed HFD.
a, Labelling fraction of TCA cycle intermediates in the quadriceps of 5-h fasted mice 10 min after [U-13C]-labelled BCAA gavage; n = 8 DbtloxP/loxP and n = 8 DbtloxP/loxP-HSA-CreER. b, Plasma BCAA concentration in mice fasted for 5 h or refed for 2 h after overnight fasting; n = 8 DbtloxP/loxP and n = 10 DbtloxP/loxP-HSA-CreER. c, Plasma BCKAs in mice fasted for 5 h; n = 8 DbtloxP/loxP and n = 8 DbtloxP/loxP-HSA-CreER. d, Fasting plasma pool size of BCAAs. e, Fasting plasma pool size of BCKAs. f, Ra of BCAAs during steady-state infusion of [U-13C]-labelled BCAAs before (basal, fasted for 5 h) and during (clamp, fasted for 7 h) HIEC; n = 6 DbtloxP/loxP and n = 6 DbtloxP/loxP-HSA-CreER. g, Blood glucose. h, GIR. i, Steady-state GIR during HIEC; n = 6 DbtloxP/loxP and n = 6 DbtloxP/loxP-HSA-CreER. j, Insulin concentration before and during HIEC; n = 6 DbtloxP/loxP and n = 6 DbtloxP/loxP-HSA-CreER. k, IP-GTT (1.5 g kg−1) after a BCAA gavage given at t = 0 in mice fasted for 5 h; n = 9 DbtloxP/loxP and n = 9 DbtloxP/loxP-HSA-CreER. l, AUC for the GTT in k. m, 1 g kg−1 IP-PTT in mice fasted for 16 h; n = 9 DbtloxP/loxP and n = 9 DbtloxP/loxP-HSA-CreER. n, AUC for the IP-PTT in l. Mice used in these experiments were male, 10–20-weeks old and were fed HFD for 4–8 weeks. Data are presented as the mean ± s.e.m. When comparing two groups, a two-tailed Student’s t-test was used, with significance defined as **P < 0.01. For the experiments with multiple comparisons at different time points, a repeated measures, two-way ANOVA was used. a, Succinate P = 0.001778; malate P = 0.001027; glutamate P = 0.002092.
Fig. 6 |
Fig. 6 |. Increased liver BCAA oxidation does not affect insulin sensitivity in mice fed HFD.
a, Western blotting of tissues from n = 3 BckdkloxP/loxP-AAV8-GFP and n = 3 BckdkloxP/loxP-AAV8-Cre mice. Liver BCKDK is the bottom band, as shown by the black arrow. The top band is non-specific (14-3-3 is the loading control). b, Plasma BCAA concentration in mice fasted for 5 h or refed for 2 h after overnight fasting; n = 8 BckdkloxP/loxP-AAV8-GFP and n = 10 BckdkloxP/loxP-AAV8-Cre. c, Plasma BCKAs in mice fasted for 5 h; n = 4 BckdkloxP/loxP-AAV8-GFP and n = 5 BckdkloxP/loxP-AAV8-Cre. d, Liver pool size of BCAAs. e, Liver pool size of BCKAs. f, Labelling fraction of TCA cycle intermediates 10 min after gavage of [U-13C]-labelled BCAAs in mice fasted for 5 h; n = 4 BckdkloxP/loxP-AAV8-GFP and n = 5 BckdkloxP/loxP-AAV8-Cre. g, IP-GTT (1.5 g kg−1) in mice fasted for 5 h and fed HFD for 4 weeks; n = 8 BckdkloxP/loxP-AAV8-GFP and n = 10 BckdkloxP/loxP-AAV8-Cre. h, AUC of the GTT in g. i, Insulin concentration at t = 0 (n = 8 BckdkloxP/loxP-AAV8-GFP and n = 10 BckdkloxP/loxP-AAV8-Cre) and t = 20 min (n = 8 BckdkloxP/loxP-AAV8-GFP and n = 9 BckdkloxP/loxP-AAV8-Cre) during the GTT in g. j, IP-GTT (1.5 g kg−1) in mice fasted for 5 h and fed HFD for 2 weeks; n = BckdkloxP/loxP-AAV8-GFP and n = 10 BckdkloxP/loxP-AAV8-Cre. k, AUC of the GTT in j. l, IP-GTT (1.5 g kg−1) in mice fasted for 5 h and fed HFD for 2 months; n = 9 BckdkloxP/loxP-AAV8-GFP and n = 10 BckdkloxP/loxP-AAV8-Cre. m, AUC of the GTT in l. Mice used in these experiments were male, 12–21-weeks old and were fed HFD for 4–12 weeks. Data are presented as the mean ± s.e.m. When two groups were compared, a two-tailed Student’s t-test was used, with significance defined as *P < 0.05. In the experiments with multiple comparisons at different time points, a repeated measures, two-way ANOVA was used with significance defined as *P < 0.05. d, Valine P = 0.039715; leucine P = 0.024237; isoleucine P = 0.030860. g, 20 min P = 0.0348.
Fig. 7 |
Fig. 7 |. Decreased liver BCAA oxidation does not affect insulin sensitivity in mice fed normal chow or HFD.
a, Western blotting of tissues from n = 3 DbtloxP/loxP-AAV8-GFP and n = 3 Dbtloxp/loxP-AAV8-Cre mice (14-3-3 is the loading control). b, Plasma BCAA concentrations in chow-fed mice fasted for 5 h or refed for 2 h after overnight fasting; n = 10 DbtloxP/loxP-AAV8-GFP and n = 10 DbtloxP/loxP-AAV8-Cre. c, IP-GTT (2 g kg−1) in chow-fed mice fasted for 5 h; n = 10 DbtloxP/loxP-AAV8-GFP and n = 10 DbtloxP/loxP-AAV8-Cre. d, AUC of the GTT in c. e, Insulin concentration at t = 0 and t = 20 min (n = 10 DbtloxP/loxP-AAV8-GFP and n = 10 DbtloxP/loxP-AAV8-Cre) during the GTT from c. f, Plasma BCAA concentrations in HFD-fed mice fasted for 5 h or refed for 2 h after overnight fasting; n = 10 DbtloxP/loxP-AAV8-GFP and n = 10 DbtloxP/loxP-AAV8-Cre. g, Plasma BCKAs in mice fasted for 5 h; n = 4 DbtloxP/loxP-AAV8-GFP and n = 5 DbtloxP/loxP-AAV8-Cre. h, Liver pool size of BCAAs. i, Liver pool size of BCKAs. j, Labelling fraction of TCA cycle intermediates in mice fasted for 5 h ten minutes after gavage of [U-13C]-labelled BCAAs; n = 4 DbtloxP/loxP-AAV8-GFP and n = 5 DbtloxP/loxP-AAV8-Cre. k, IP-GTT (1.5 g kg−1) in mice fasted for 5 h and fed HFD; n = 10 DbtloxP/loxP-AAV8-GFP and n = 10 DbtloxP/loxP-AAV8-Cre. l, AUC of the GTT in k. m, Plasma insulin concentration at t = 0 and t = 20 min (n = 10 DbtloxP/loxP-AAV8-GFP and n = 10 DbtloxP/loxP-AAV8-Cre) during the GTT from k. ae, Mice were fed chow diet. fm, Mice were fed HFD. Mice were male, 16–24-weeks old and were fed chow diet for 4–5 weeks, followed by HFD for 4–6 weeks. Data are presented as the mean ± s.e.m. When comparing two groups, a two-tailed Student’s t-test was used, with significance defined as *P < 0.05 and **P < 0.01. In the experiments with multiple comparisons at different time points, a repeated measures, two-way ANOVA was used. b, Isoleucine fasted P = 0.019558. i, KIC/KMV P = 0.004877, KIV P = 0.004452. j, Succinate P = 0.000631; malate P = 0.003667; glutamate P = 0.003207.
Fig. 8 |
Fig. 8 |. Double knockout of BCKDK in both SM and liver has no effect on insulin sensitivity.
a, Western blotting of fasted tissues from n = 3 WT and n = 3 BCKDK double knockout mice. Liver BCKDK is the bottom band, as shown by the black arrow. The top band is non-specific; 14-3-3 is the loading control. b, IP-GTT (1.5 g kg−1) in mice fasted for 5 h and fed HFD for 6 weeks; n = 10 WT and n = 10 double knockout mice. c, AUC for the GTT in b; n = 10 WT and n = 10 double knockout mice. d, Insulin concentration at t = 0 and t = 20 min (n = 10 WT and n = 10 double knockout mice) during the GTT from b. e, Plasma BCAA concentration in HFD-fed mice fasted for 5 h or refed for 2 h after overnight fasting; n = 10 WT, n = 6 BckdkloxP/loxP-HSA-CreER (SM knockout) and n = 10 double knockout mice. f, Western blotting of refed tissues from n = 3 WT and n = 3 double knockout mice; 14-3-3 is the loading control. g, IP-GTT (1.5 g kg−1) in mice fasted for 5 h and fed HFD for 7 weeks, treated with 100 mg kg−1 of either vehicle or BT2 the night before and the morning of the GTT; n = 8 BCKDK double knockout + vehicle and n = 8 BCKDK double knockout + BT2 mice. h, AUC for the GTT in g. i, Insulin concentration at t = 0 and t = 20 min (n = 8 BCKDK double knockout + vehicle and n = 8 BCKDK double knockout + BT2 mice) during the GTT from g. j, Plasma BCAA concentration in mice fasted for 5 h or refed for 2 h after overnight fasting, treated with 100 mg kg−1 of either vehicle or BT2 the night before and the morning of plasma collection; n = 8 BCKDK double knockout + vehicle and n = 9 BCKDK double knockout + BT2 mice. Mice used for these experiments were 13–23-weeks old and were fed HFD for 6–7 weeks. Data are presented as the mean ± s.e.m. When two groups were compared, a two-tailed Student’s t-test was used, with significance defined as *P < 0.05 and **P < 0.01. In the experiments with multiple comparisons at different time points, a repeated measures, two-way ANOVA was used. e, Valine WT versus double knockout fasted P = 0.047907; valine WT versus SM knockout fasted P = 0.049487; leucine WT versus double knockout fasted P = 0.020429; leucine WT versus SM knockout fasted P = 0.031846; isoleucine WT versus double knockout fasted P = 0.014609; isoleucine WT versus SM knockout fasted P = 0.031719. h, P = 0.039819. j, Valine fasted P = 0.025933, valine refed P = 0.003017; leucine fasted P = 0.022498, leucine refed P = 0.004677; isoleucine fasted P = 0.041485, isoleucine refed P = 0.003193.

Similar articles

Cited by

References

    1. Centers for Disease Control and Prevention. National Diabetes Statistics Report (CDC, 2020).
    1. Randle PJ, Garland PB, Hales CN & Newsholme EA The glucose fatty-acid cycle. Its role in insulin sensitivity and the metabolic disturbances of diabetes mellitus. Lancet 281, 785–789 (1963). - PubMed
    1. McGarry JD What if Minkowski had been ageusic? An alternative angle on diabetes. Science 258, 766–770 (1992). - PubMed
    1. Corkey BE Banting Lecture 2011: hyperinsulinemia: cause or consequence? Diabetes 61, 4–13 (2012). - PMC - PubMed
    1. Shulman GI Ectopic fat in insulin resistance, dyslipidemia, and cardiometabolic disease. N. Engl. J. Med. 371, 2236–2238 (2014). - PubMed

Publication types

Substances