. 2023 Apr 26;14(1):7.
doi: 10.1186/s13227-023-00210-2.

Early expression onset of tissue-specific effector genes during the specification process in sea urchin embryos

Affiliations

Early expression onset of tissue-specific effector genes during the specification process in sea urchin embryos

Shumpei Yamakawa et al. Evodevo. .

Abstract

Background: In the course of animal developmental processes, various tissues are differentiated through complex interactions within the gene regulatory network. As a general concept, differentiation has been considered to be the endpoint of specification processes. Previous works followed this view and provided a genetic control scheme of differentiation in sea urchin embryos: early specification genes generate distinct regulatory territories in an embryo to express a small set of differentiation driver genes; these genes eventually stimulate the expression of tissue-specific effector genes, which provide biological identity to differentiated cells, in each region. However, some tissue-specific effector genes begin to be expressed in parallel with the expression onset of early specification genes, raising questions about the simplistic regulatory scheme of tissue-specific effector gene expression and the current concept of differentiation itself.

Results: Here, we examined the dynamics of effector gene expression patterns during sea urchin embryogenesis. Our transcriptome-based analysis indicated that many tissue-specific effector genes begin to be expressed and accumulated along with the advancing specification GRN in the distinct cell lineages of embryos. Moreover, we found that the expression of some of the tissue-specific effector genes commences before cell lineage segregation occurs.

Conclusions: Based on this finding, we propose that the expression onset of tissue-specific effector genes is controlled more dynamically than suggested in the previously proposed simplistic regulation scheme. Thus, we suggest that differentiation should be conceptualized as a seamless process of accumulation of effector expression along with the advancing specification GRN. This pattern of effector gene expression may have interesting implications for the evolution of novel cell types.

Keywords: Differentiation; Effector genes; Gene regulatory network; Sea urchin; Transcriptome.


Conflict of interest statement

The authors declare that they have no competing interests

Figures

Fig. 1
Fig. 1
Cell fate segregation during development of the sea urchin H. pulcherrimus. The timing of cell fate segregation and embryonic stages were defined based on previous work using the sea urchin S. purpuratus [14, 25, 27, 29, 30, 36]. Embryonic stages at each developmental time (0, 6, 8, 10, ... 30 hpf) in H. pulcherrimus were defined with reference to the previous descriptions and our observations [22]. Based on the above information, cell fate segregation along developmental time in H. pulcherrimus was estimated. Egg cleavage generates three cell lineages of mesomeres, macromeres and micromeres, segregating to the apical/nonapical ectoderm, Veg1/2 and skeletogenic/germline lineages, respectively. Each lineage segregates further to establish and differentiate various tissues, such as the apical organ, cilia, mid/hindgut, pigment and skeletogenic cells. Cell lineages (top) and cellular regions in an embryo (bottom). Apical ectoderm, Veg1 endoderm, Veg2 endoderm, NSM and skeletogenic cells are highlighted in blue, gray, green, yellow and orange, respectively. EB early blastula, HB hatched blastula, MB mesenchyme blastula, EG early gastrula and LG late gastrula
Fig. 2
Fig. 2
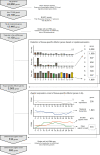
Experimental flow for screening tissue-specific effector genes. Screening of tissue-specific effector genes was conducted from the gene models of H. pulcherrimus genome in multiple steps. (1) Transcription factors and signaling molecules were removed based on the domain structure. (2) The genes that did not show reciprocal BLAST best hits between H. pulcherrimus (Hp) and S. purpuratus (Sp) were excluded. (3) Genes whose expression was biased to specific cell lineage(s) in single-cell RNA-seq data from S. purpuratus were selected. The average of expression levels (Ave. exp.) was calculated in each cell cluster (0–14) and gene. We counted the number of cell lineages in which the expression level was higher than 0.3 for each gene (#: the number of cell lineages). Three examples were shown in 0, 1 and 7 lineage(s). (4) Zygotic expression onset of the genes was determined using temporal transcriptomic data from H. pulcherrimus. (5) Gene annotations were checked manually to refine the sets of tissue-specific effector genes. See the text for detailed methods and results
Fig. 3
Fig. 3
Zygotic expression onset of tissue-specific effector genes during the development of H. pulcherrimus. A Indicates the number of tissue-specific effector genes calculated as expressed in a specific number of cell lineage(s). B and C Show the number of tissue-specific effector genes with zygotic expression onset at each timepoint. The color of each bar in AC reflects the number of cell lineages in which tissue-specific effector genes were expressed at the early gastrula stage. B Shows the number of genes at each developmental time stacked together, and C shows the number of genes expressed in each number of cell lineages separately. D Shows the number of tissue-specific effector genes whose expression was restricted to a single cell lineage at each zygotic expression onset time and each cell lineage (as shown in the bottom graphs in C). The number and cell lineages are reflected in the size and color of the circles, respectively. Bars 1–4 in D indicate the cell fate segregation timing with reference to Fig. 1. Bar 1: micromere to skeletogenic cells and germline; Bar 2: mesomere to apical ectoderm and macromere to Veg1/Veg2; Bar 3: nonapical ectoderm to ciliary ectoderm/nerve cells and Veg2 to Veg2 endoderm/NSM; Bar 4: Veg1 to Veg1 ectoderm/Veg1 endoderm
Fig. 4
Fig. 4
Coexpression of tissue-specific effector genes of the Veg2 endo/mesoderm and Veg1 ecto/endoderm in their precursor cells. AC Show the expression patterns of LOC582093/Cadherin_6 and LOC589279/Got1; LOC575113/Rergl4 and LOC589279/Got1; and LOC575113/Rergl4 and LOC576910/Hypp_5866 in the UMAP projection derived from S. purpuratus single-cell RNA-seq data with the Seurat option FeaturePlot and its blend function. a and b Show the expression of the former and latter genes at the early blastula stage, respectively. c Merges the expression patterns of a and c. d is a magnified view of Veg2 (A and B) or Veg1 (C) cell clusters. e and f Show the expression of the former and latter genes at the early gastrula stage, respectively. h Is the color index showing the strength of the expression level and coexpression in c and g
Fig. 5
Fig. 5
Zygotic expression onset of tissue-specific effector and specification genes in four representative cell lineages. Zygotic expression onset of tissue-specific effector genes and specification genes are shown in each representative cell lineage: A, B: NSM; C, D: skeletogenic cells; E, F: Veg1/2 endoderm; G, H: apical ectoderm (A, C, E and F: effector genes and B, D, F and H: specification genes). Each dot indicates the timing of expression onset, and dotted lines indicate the timing of cell fate segregation or morphogenesis of a developmental landmark in each cell lineage. Embryonic stages and cell fate segregation are shown in Fig. 1. E egg, Macro/Ma macromere, M micromere, Meso mesomere, Cleav cleavage
Fig. 6
Fig. 6
Zygotic expression onset of biomineralization genes in skeletogenic cells. Zygotic expression onset of skeletogenic effector genes that are expected to function in the mineralization process is highlighted in red. The dataset is the same as that shown in Fig. 5C. White dots represent the genes whose functions are unknown or not involved in the biomineralization process
Fig. 7
Fig. 7
Spatial expression pattern of the representative tissue-specific effector genes. Temporal (A, C, E, G, I, K) and spatial (B, D, F, H, J, L) expression patterns of each gene were, respectively, obtained from transcriptome data and whole-mount in situ hybridization (A, B: Srcr42; C, D: Spsb3; E, F: Plod2; G, H: Enpep_2; I, J: PppL_224; K, L: Hypp_1056). Developmental timepoints for in situ hybridization are indicated above each photo of B, D, F, H, J and L

Similar articles

Cited by

References

    1. Gilbert SF. Developmental biology. Massachusetts: Sinauer Associates Incorporated; 2013.
    1. Peter IS, Davidson EH. Genomic control process: development and evolution. Amsterdam: Elsevier Science; 2015.
    1. Foster S, Oulhen N, Wessel G. A single cell RNA sequencing resource for early sea urchin development. Development. 2020;147(17):dev191528. doi: 10.1242/dev.191528. - DOI - PMC - PubMed
    1. Calestani C, Rogers DJ. Cis-regulatory analysis of the sea urchin pigment cell gene polyketide synthase. Dev Biol. 2010;340(2):249–255. doi: 10.1016/j.ydbio.2010.01.026. - DOI - PubMed
    1. Perillo M, Oulhen N, Foster S, Spurrell M, Calestani C, Wessel G. Regulation of dynamic pigment cell states at single-cell resolution. Elife. 2020;9:e60388. doi: 10.7554/eLife.60388. - DOI - PMC - PubMed