. 2023 Apr 26;11(1):90.
doi: 10.1186/s40168-023-01520-2.

Inulin diet uncovers complex diet-microbiota-immune cell interactions remodeling the gut epithelium

Affiliations

Inulin diet uncovers complex diet-microbiota-immune cell interactions remodeling the gut epithelium

Renan Oliveira Corrêa et al. Microbiome. .

Erratum in

  • Correction: Inulin diet uncovers complex diet-microbiota-immune cell interactions remodeling the gut epithelium.
    Corrêa RO, Castro PR, Fachi JL, Nirello VD, El-Sahhar S, Imada S, Pereira GV, Pral LP, Araújo NVP, Fernandes MF, Matheus VA, de Souza Felipe J, Dos Santos Pereira Gomes AB, de Oliveira S, de Rezende Rodovalho V, de Oliveira SRM, de Assis HC, Oliveira SC, Dos Santos Martins F, Martens E, Colonna M, Varga-Weisz P, Vinolo MAR. Corrêa RO, et al. Microbiome. 2023 May 31;11(1):122. doi: 10.1186/s40168-023-01579-x. Microbiome. 2023. PMID: 37259114 Free PMC article. No abstract available.

Abstract

Background: The continuous proliferation of intestinal stem cells followed by their tightly regulated differentiation to epithelial cells is essential for the maintenance of the gut epithelial barrier and its functions. How these processes are tuned by diet and gut microbiome is an important, but poorly understood question. Dietary soluble fibers, such as inulin, are known for their ability to impact the gut bacterial community and gut epithelium, and their consumption has been usually associated with health improvement in mice and humans. In this study, we tested the hypothesis that inulin consumption modifies the composition of colonic bacteria and this impacts intestinal stem cells functions, thus affecting the epithelial structure.

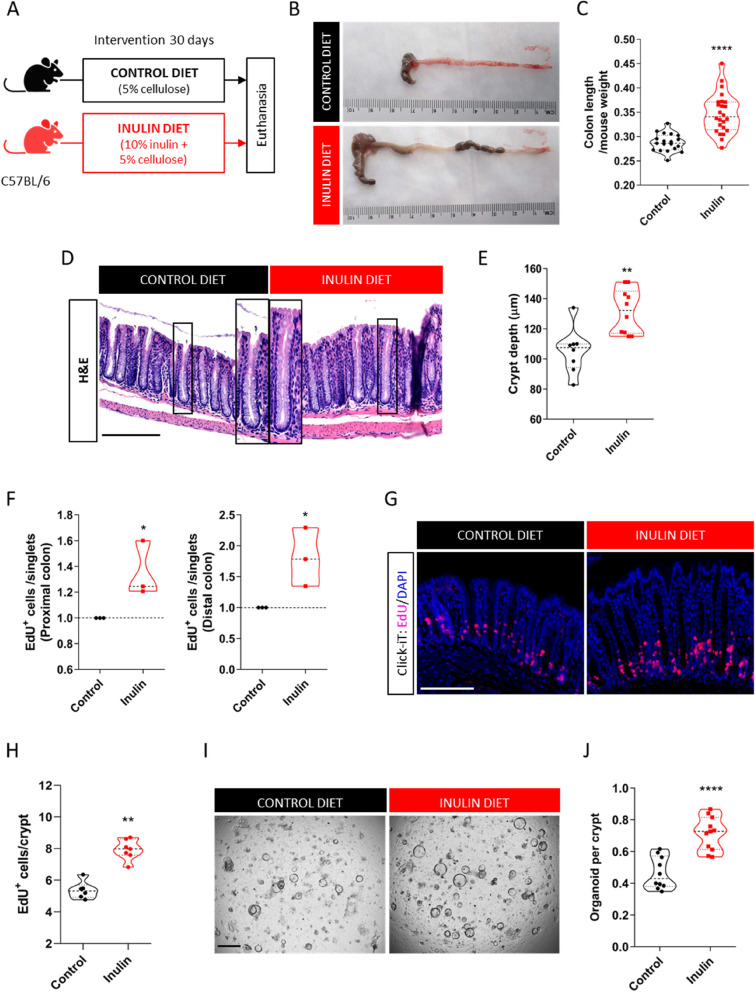
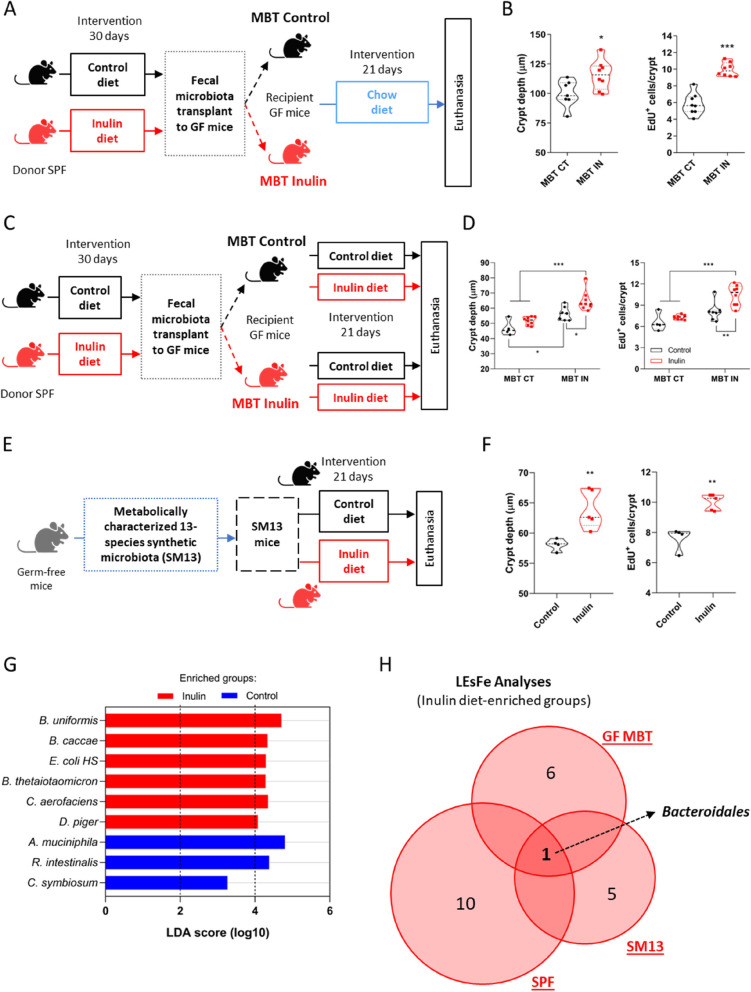
Methods: Mice were fed with a diet containing 5% of the insoluble fiber cellulose or the same diet enriched with an additional 10% of inulin. Using a combination of histochemistry, host cell transcriptomics, 16S microbiome analysis, germ-free, gnotobiotic, and genetically modified mouse models, we analyzed the impact of inulin intake on the colonic epithelium, intestinal bacteria, and the local immune compartment.

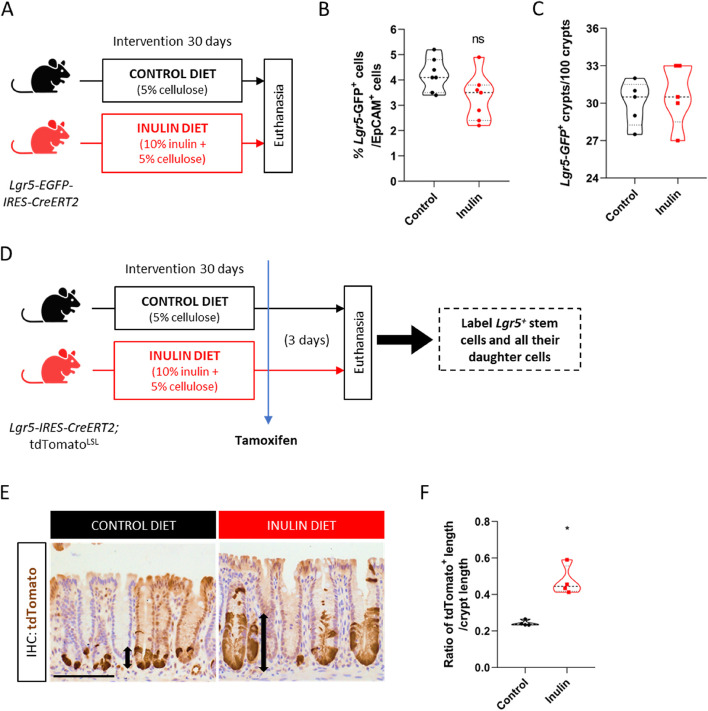
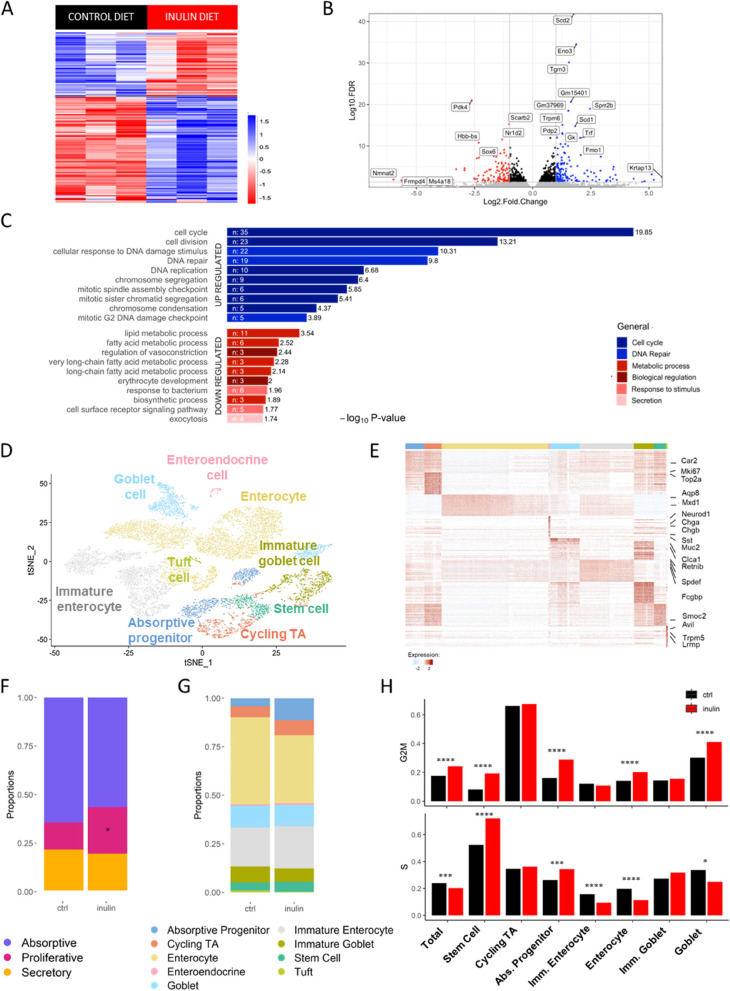
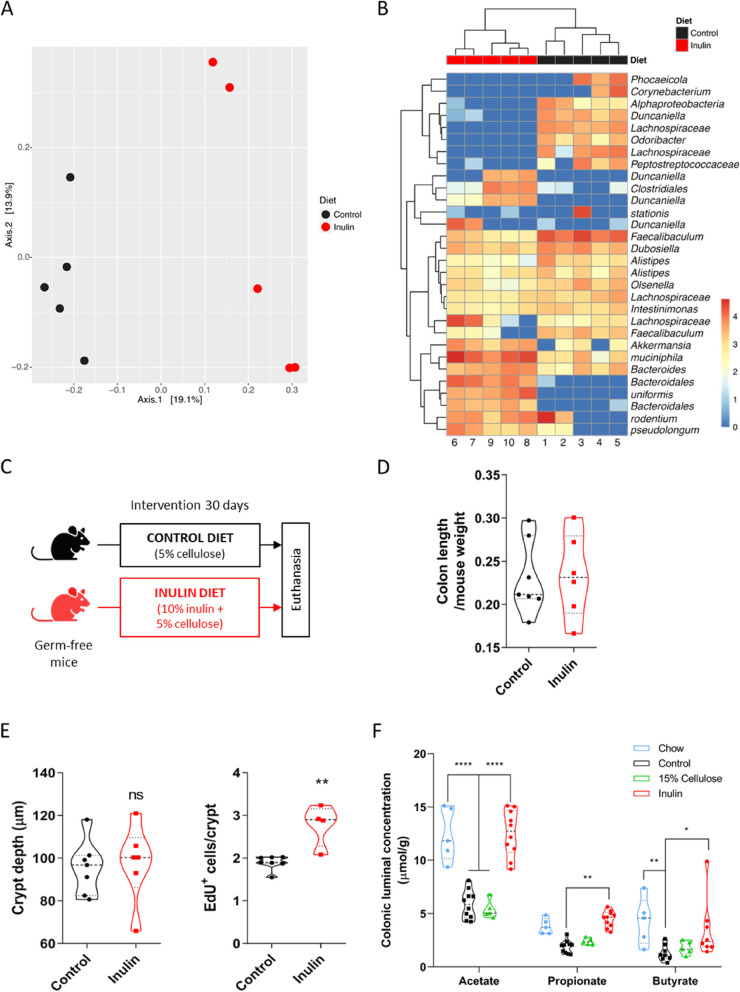
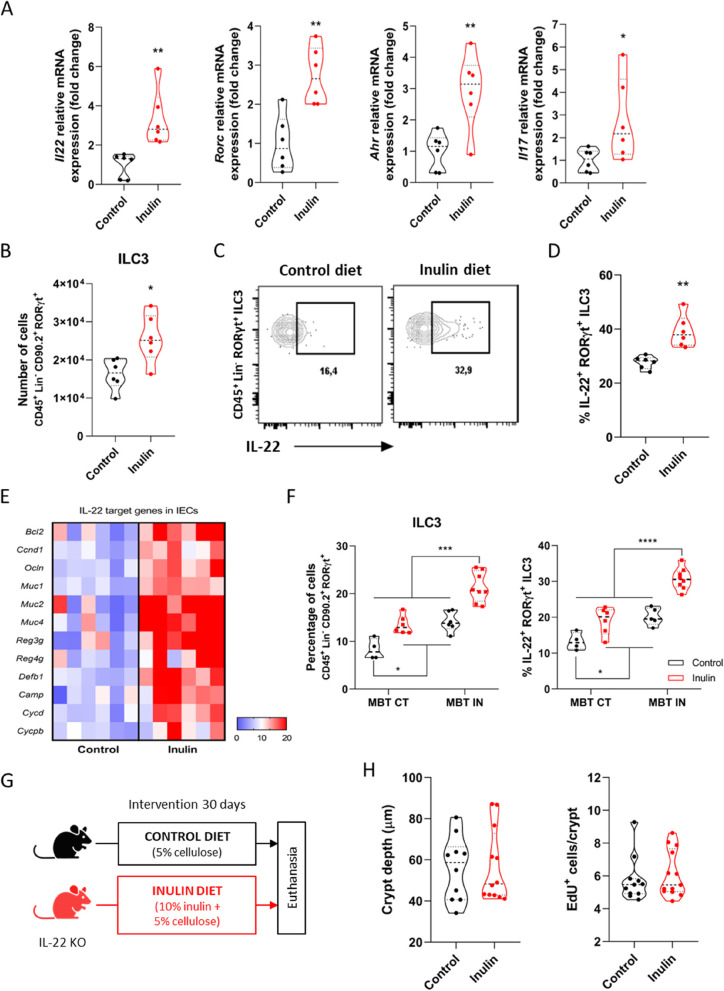
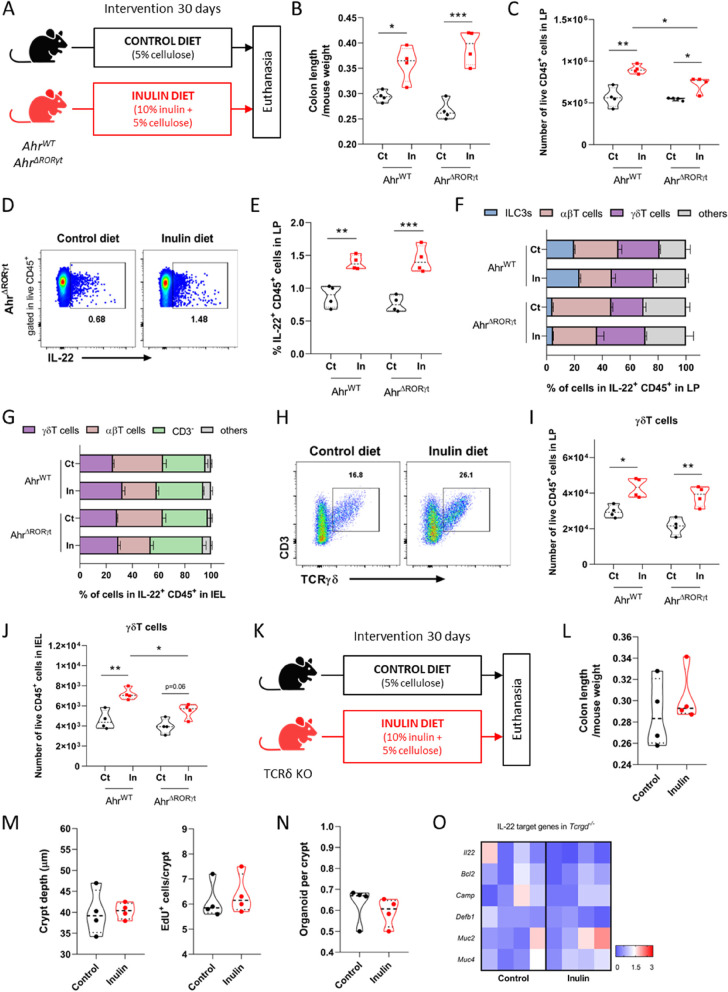
Results: We show that the consumption of inulin diet alters the colon epithelium by increasing the proliferation of intestinal stem cells, leading to deeper crypts and longer colons. This effect was dependent on the inulin-altered gut microbiota, as no modulations were observed in animals deprived of microbiota, nor in mice fed cellulose-enriched diets. We also describe the pivotal role of γδ T lymphocytes and IL-22 in this microenvironment, as the inulin diet failed to induce epithelium remodeling in mice lacking this T cell population or cytokine, highlighting their importance in the diet-microbiota-epithelium-immune system crosstalk.

Conclusion: This study indicates that the intake of inulin affects the activity of intestinal stem cells and drives a homeostatic remodeling of the colon epithelium, an effect that requires the gut microbiota, γδ T cells, and the presence of IL-22. Our study indicates complex cross kingdom and cross cell type interactions involved in the adaptation of the colon epithelium to the luminal environment in steady state. Video Abstract.

Keywords: Bacteroidales; Epithelial remodeling; Gut homeostasis; High-fiber diet; IL-22; Intestinal stem cells; γδ T cells.


Conflict of interest statement

The authors declare no competing interests.

Figures

Fig. 1
Fig. 1
Ingestion of inulin stimulates cell proliferation in the colon. A Experimental model scheme with two dietary groups. B Representative images of the harvested cecum and colon after 30 days of indicated diet. C Quantification of colon length normalized by mice weight (n = 19–24). Data pooled from 4 independent experiments. D Representative images of colonic epithelium by H&E staining. Scale bars, 100 µm. E Measurement of colon crypt depth (n = 8–10). Data were pooled from 2 independent experiments. F Quantification of the number of EdU-positive cells normalized by the number of acquired singlets by flow cytometry in both proximal and distal regions of the colon (n = 3). G Visualization of EdU-positive cells in colonic crypts by fluorescence microscopy following EdU Click-iT reaction. Scale bars, 50 µm. H Quantification of EdU-positive cells per crypt (n = 6–7). Data were pooled from 2 independent experiments and analyzed by Mann–Whitney test. I Representative images of crypts-derived colon organoids 5 days in the culture. Scale bars, 1 mm. J Quantification of the clonogenicity capacity of colon crypts (n = 10–11). Data were pooled from 2 independent experiments. In all graphs, each point represents an individual animal. Unless otherwise stated, results were analyzed by Student’s t-test. *p < 0.05, **p < 0.01, ****p < 0.0001
Fig. 2
Fig. 2
Ingestion of inulin enhances the proliferative activity of colonic Lgr5 + stem cells. A Experimental model scheme with reporter mice and two dietary groups. B Quantification of the percentage of Lgr5-GFP-positive cells in the colon by flow cytometry (n = 7). C Quantification of the percentage of Lgr5-GFP-positive crypts in the colon by immunohistochemistry (n = 5). D Experimental model scheme with lineage-tracer mice and long-term (3 days) tamoxifen injection. E Visualization of tdTomato-positive cells in colonic crypts by optical microscopy following staining with anti-tdTomato antibody. Scale bars, 100 µm. F Quantification of the ratio of tdTomato-positive length relative to crypt length (n = 4). In all graphs, each point represents an individual animal. Results were analyzed by Student’s t-test. *p < 0.05, and ns = not significant
Fig. 3
Fig. 3
Inulin diet affects distribution and transcriptional profile of colon epithelial cell populations. A Heatmap showing up- or downregulated genes in the colon epithelial cells of both dietary groups after transcriptome analysis. DESeq statistical test with significance threshold p < 0.05 (n = 3). B Volcano plot displaying up- (blue) and downregulated (red) genes in the inulin diet group. C Significant enriched terms identified from KEGG Pathway analysis of the significantly up- and downregulated genes. D t-SNE plot with defined cell populations in colon epithelium summarizing data from single-cell RNA-Seq analysis of inulin diet fed mice and controls. E Heatmap of colon epithelial cell cluster markers colored by relative gene expression. Cell types are indicated by colored bars on top matching colors in (D). Select markers for each cluster are shown on the right of the heatmap. F Proportion of the absorptive, proliferative or secretory epithelial cell types in both dietary groups. T-test was used to calculate p-values and corrected by Benjamini- Hochberg false discovery rates. * p < 0.05. G Proportion of the 9 defined cell populations in both dietary groups. T-test was used to calculate p-values and corrected by Benjamini–Hochberg false discovery rates. * p < 0.05. H Frequency of cells expressing S or G2/M phase cell-cycle genes in total and in the main intestinal epithelial populations (EEC and Tuft cells were excluded because their numbers were very low). Results were analyzed using Fisher’s exact test. *p < 0.05, ***p < 0.001, ****p < 0.0001
Fig. 4
Fig. 4
Epithelial proliferation induced by inulin diet is dependent on gut microbiota. A 16S rRNA gene sequencing of the C57BL/6 colon microbiota showing changes in beta diversity on inulin diet group. Expressed by UniFrac PCoA analysis (n = 6). PERMANOVA test (R2 = 0.1879, p = 0.012). B Heatmap of relative abundance taxa of bacteria in the different diets (n = 6), scale in log10. C Experimental model scheme with germ-free mice and two dietary groups. D Quantification of colon length normalized by mice weight (n = 6–7). Data pooled from 2 independent experiments. E Quantification of colon crypt depth (left) and number of EdU-positive cells per crypt (right) in germ-free mice (n = 4–7), the latter analyzed by Mann–Whitney test. Data pooled from 2 independent experiments. F Quantification of the levels of SCFAs in the colon fecal luminal content assessed by GC–MS (n = 5–10). Data pooled from 2 independent experiments. Results analyzed by two-way ANOVA. In all graphs, each point represents an individual animal. Unless otherwise stated, results were analyzed by Student’s t-test. *p < 0.05, **p < 0.01, ****p < 0.0001, and ns = not significant
Fig. 5
Fig. 5
Fecal microbial transplantation recapitulates epithelial proliferation induced by the intake of inulin. A Schematic of the first fecal microbiota transplantation experiment (MBT), with SPF donors and GF recipient mice in the different diet conditions. B Quantification of colon crypt depth (left) and number of EdU-positive cells per crypt (right) (n = 7–8). C Schematic of the second fecal microbiota transplantation experiment (MBT). D Quantification of colon crypt depth (left) and number of EdU-positive cells per crypt (right) (n = 4–8). Results analyzed by two-way ANOVA. E Schematic of the gnotobiotic SM13 mice model (n = 4–5). F Quantification of colon crypt depth (left) and number of EdU-positive cells per crypt (right), the latter analyzed by Mann–Whitney test. G LEfSe analysis with LDA score of relative abundance taxa of bacteria of SM13 mice. H Venn diagrams showing the three distinct microbiota experiments and number of individual or shared bacterial groups obtained by LEfSe analysis of the inulin diet-enriched groups. SPF: specific pathogen-free mice, GF MBT: germ-free microbiota transplanted mice, SM13: gnotobiotic mice. In all graphs, each point represents an individual animal. Unless otherwise stated, results were analyzed by Student’s t-test. *p < 0.05, **p < 0.01, ***p < 0.001
Fig. 6
Fig. 6
Cytokine IL-22 production is enhanced by inulin diet and is crucial for the epithelial proliferative phenotype. A Relative mRNA expression of Il22, Rorc, Ahr and Il17 of colonic lamina propria lymphocytes by RT-qPCR (n = 6). B-D, F Flow cytometry analyses of colonic lamina propria immune cells (n = 4–6). B Quantification of ILC3s. C Gating strategy to define IL-22-positive events within the ILC3 population. D Quantification of the percentage of IL-22-positive ILC3s. E Heatmap with relative mRNA expression of IL-22-target genes of colonic epithelial cells by RT-qPCR (n = 6). F Quantification of the percentage of ILC3s (left) and IL-22-positive ILC3s (right). Results analyzed by two-way ANOVA. Related to fecal microbiota transplanted (MBT) mice described in Fig. 5C (n = 4–8). G Schematic of the experimental model with IL22 KO mice and the different diets (n = 10–12). H Quantification of colon crypt depth (left) and number of EdU-positive cells per crypt (right) of IL22 KO mice. Data were pooled from 2 independent experiments. Results analyzed by Mann–Whitney test. In all graphs, each point represents an individual animal. Unless otherwise stated, results were analyzed by Student’s t-test. *p < 0.05, **p < 0.01, ***p < 0.001, ****p < 0.0001
Fig. 7
Fig. 7
γδ T cells, but not ILC3s or αβ T cells, are pivotal for induction of colonic epithelial remodeling by inulin A Schematic of the experimental model with ILC3-deficient mice in the different diets (n = 4). B Quantification of the colon length of mice fed control (Ct) or inulin (In) diet. Results analyzed by two-way ANOVA. C-J Flow cytometry analyses of immune (CD45+) cells present in the colonic lamina propria (LP) or intraepithelial lymphocytes (IEL). C Quantification of CD45+ cells. Results analyzed by two-way ANOVA. D Gating strategy to define IL-22-positive events within the CD45+ population. E Quantification of the percentage of IL-22-positive CD45+ cells. Results analyzed by two-way ANOVA. F Percentage of IL-22 production by distinct cell types in the LP. Results analyzed by two-way ANOVA. G Percentage of IL-22 production by distinct cell types in the IEL. Results analyzed by two-way ANOVA. H Gating strategy to define the γδ T cell population. I Quantification of the γδ T cell population in the LP. Results analyzed by two-way ANOVA. J Quantification of the γδ T cell population within IEL. Results analyzed by two-way ANOVA. K Schematic of the experimental model with TCRδ KO mice in different diets (n = 4). L Quantification of colon length. M Quantification of colon crypt depth (left) and number of EdU-positive cells per crypt (right). N Quantification of clonogenicity capacity of colon crypts. Results analyzed by Mann–Whitney test. O Heatmap with relative mRNA expression of IL-22-target genes of colonic epithelial cells by RT-qPCR. In all graphs, each point represents an individual animal. Unless otherwise stated, results were analyzed by Student’s t-test. *p < 0.05, **p < 0.01, ***p < 0.001

References

    1. Williams JM, Duckworth CA, Burkitt MD, Watson AJM, Campbell BJ, Pritchard DM. Epithelial Cell Shedding and Barrier Function. Vet Pathol. 2015;52:445–455. - PMC - PubMed
    1. Gehart H, Clevers H. Tales from the crypt: new insights into intestinal stem cells. Nat Rev Gastroenterol Hepatol. 2019;16:19–34. - PubMed
    1. Allaire JM, Crowley SM, Law HT, Chang S-Y, Ko H-J, Vallance BA. The Intestinal Epithelium: Central Coordinator of Mucosal Immunity. Trends Immunol. 2018;39:677–696. - PubMed
    1. Xing PY, Pettersson S, Kundu P. Microbial Metabolites and Intestinal Stem Cells Tune Intestinal Homeostasis. Proteomics. 2020;20:1800419. - PubMed
    1. Calibasi-Kocal G, Mashinchian O, Basbinar Y, Ellidokuz E, Cheng C-W, Yilmaz ÖH. Nutritional Control of Intestinal Stem Cells in Homeostasis and Tumorigenesis. Trends Endocrinol Metab. 2021;32:20–35. - PubMed

Publication types

LinkOut - more resources