. 2023 Apr 26;19(1):35.
doi: 10.1186/s13223-023-00792-5.

Immunomodulatory effects of modified Liu-Wei-Di-Huang-Wan Traditional Chinese medicine on allergic asthmatic mice

Affiliations

Immunomodulatory effects of modified Liu-Wei-Di-Huang-Wan Traditional Chinese medicine on allergic asthmatic mice

Jaw-Ji Tsai et al. Allergy Asthma Clin Immunol. .

Abstract

Background: Allergic asthma occurs worldwide and is particularly prevalent in westernized countries characterized by chronic airway inflammation resulting in airway hyperresponsiveness. The house dust mites (HDM) including Dermatophagoides pteronyssinus are major sources of sensitization and triggering allergic symptoms in asthmatic patients. The Der p 2 is a major allergen and the predominant source of causative respiratory disorders which induce airway inflammation and bronchial constriction in mite-allergic patients. Few studies evaluate the ameliorating effects of modified Liu-Wei-Di-Huang-Wan (modified LWDHW) on allergic asthma.

Methods: This study aimed to investigate the immunological mechanisms of modified LWDHW on the reductions of airway inflammation, signal transduction, inflammatory cytokine production, Th2 cell proliferation, and bronchial obstruction in Der p 2-induced asthmatic mice.

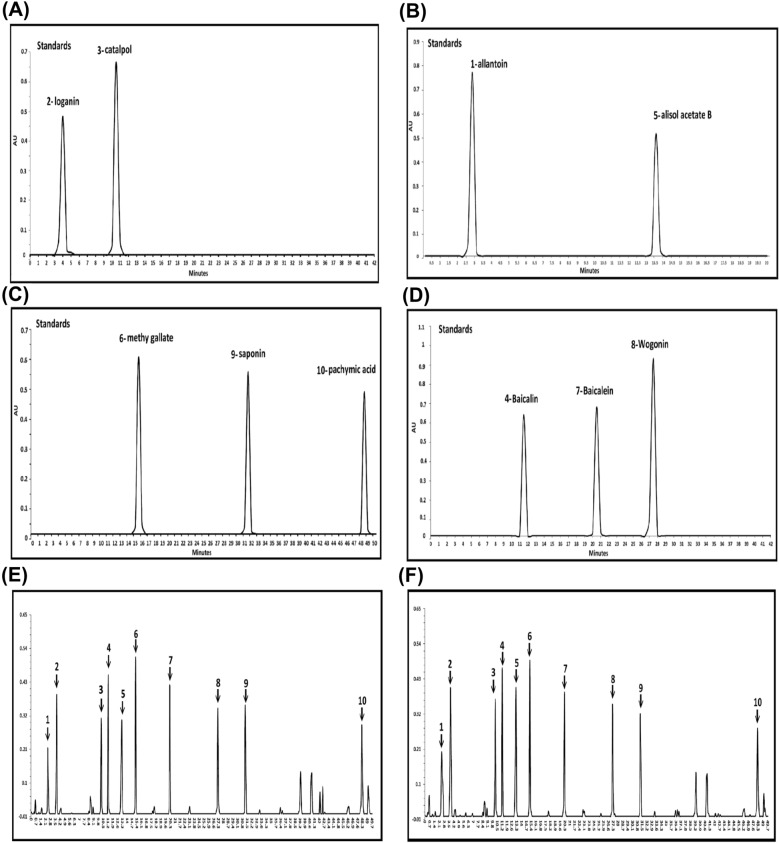
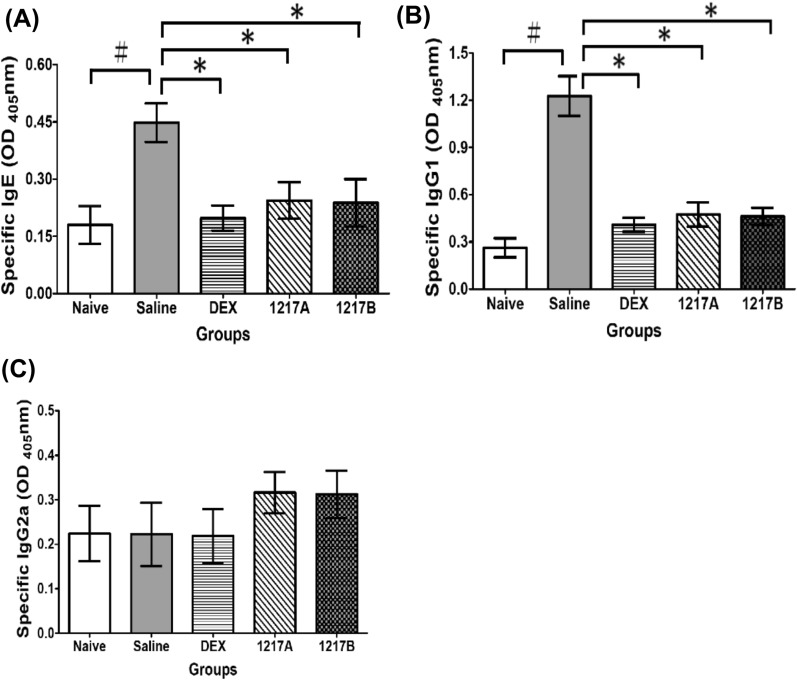
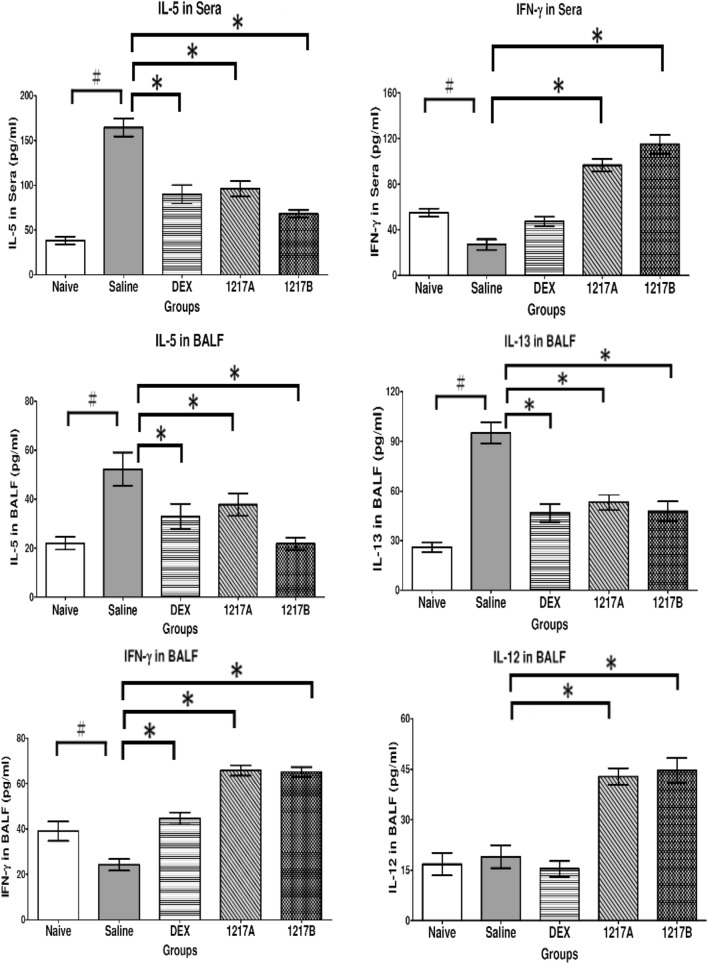
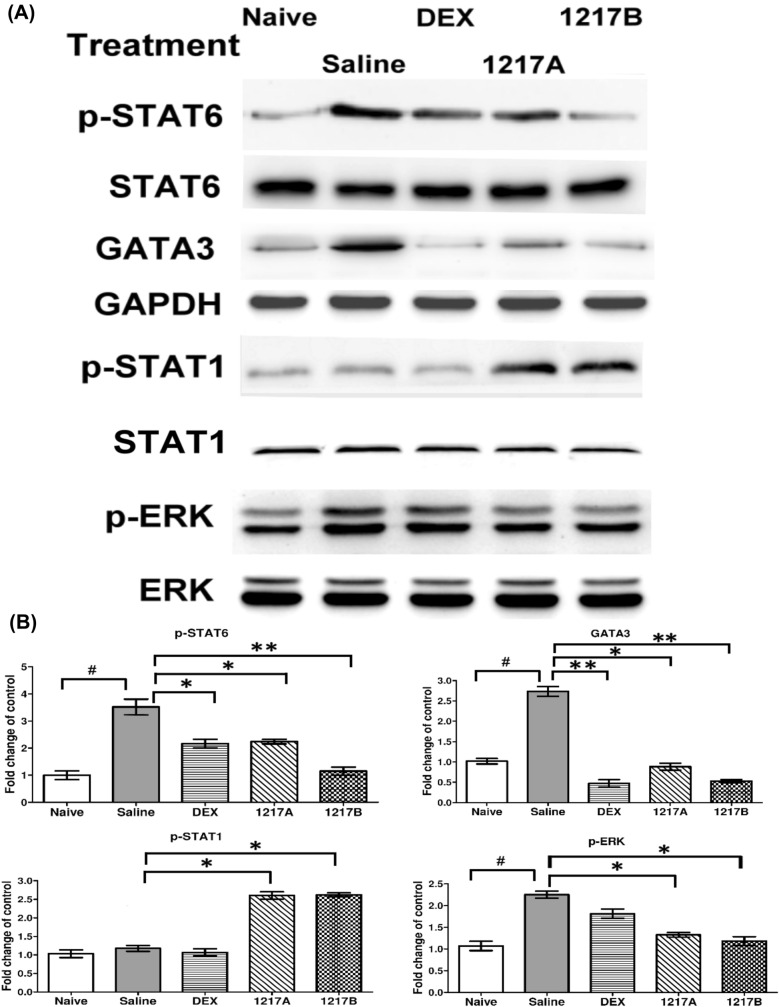
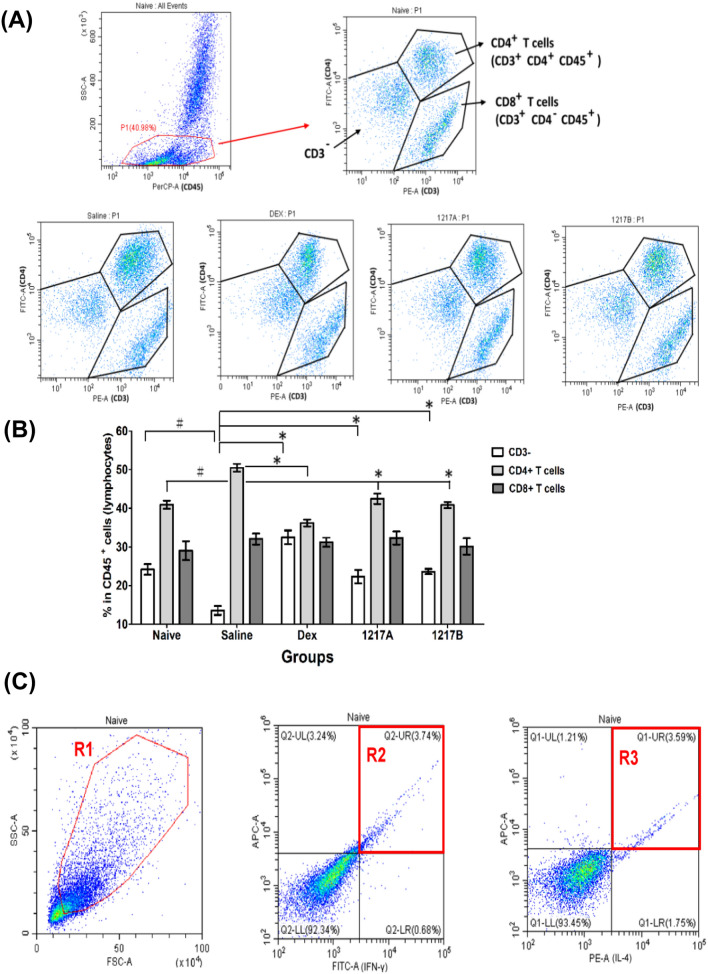
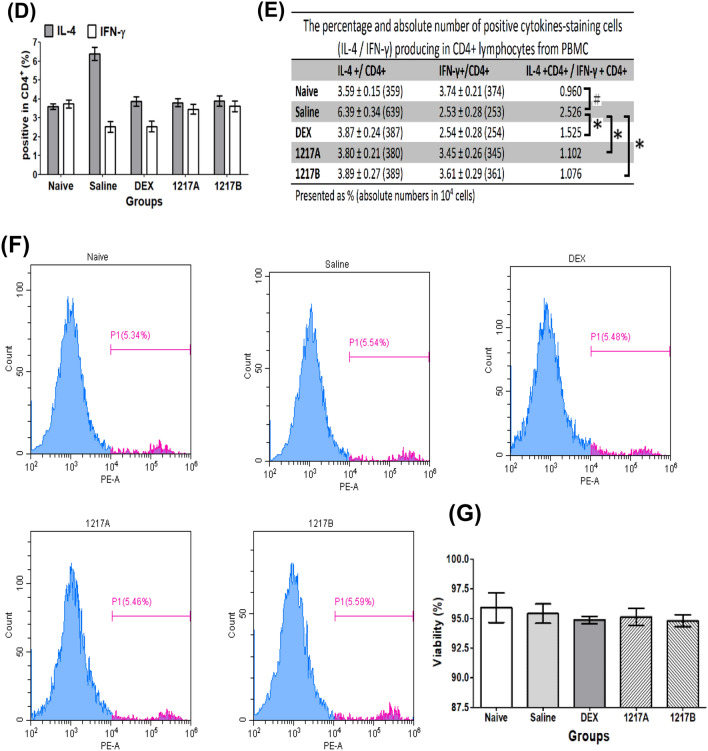
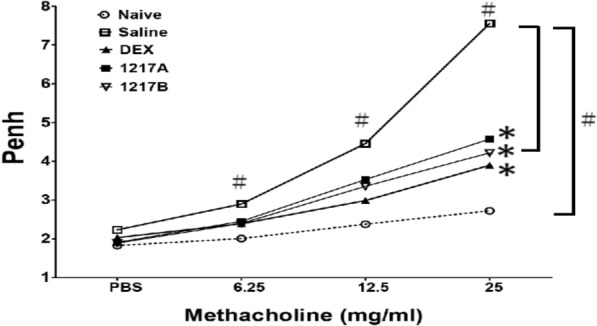
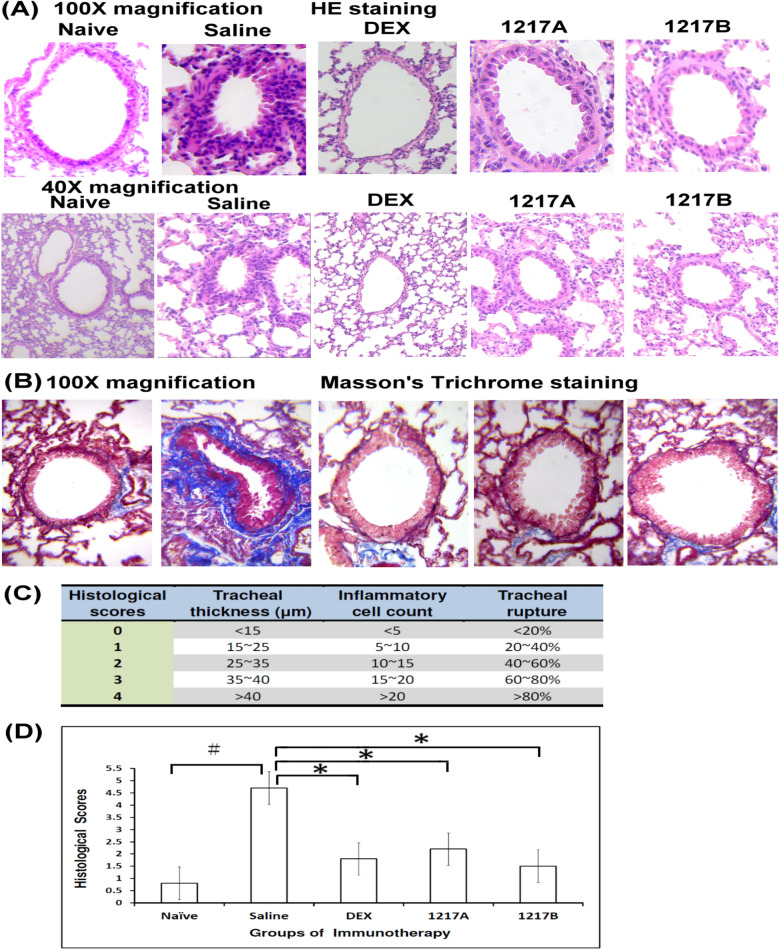
Results: At least ten active ingredients were contained in the formula of modified LWDHW- 1217A and 1217B. Results showed that the immunoglobulin generations (Der p 2 specific- IgE and IgG1), inflammatory cytokine productions (IL-5 and IL-13) in the Sera and BALF could be down-regulated, and the Th1-cytokine productions (IL-12 and IFN-γ) be increased after immunotherapy with modified LWDHW of 1217A or 1217B. The inflammatory cell infiltrations (macrophages, eosinophils, and neutrophils) in the airway and the expressions of TH2-related genes (IL-4, IL-5, and IL-13), TH2-related transcription factor (GATA-3), and neutrophil chemotactic chemokine (IL-8) in the lung tissue of asthmatic mice were significantly decreased after the immunotherapy. The Th1/Th2 polarization had been identified that the IL-4+/CD4+ T cells were downregulated and IFN-γ+/CD4+ T cells were increased. The airway hyperresponsiveness to methacholine inhalation of Penh values was significantly decreased in the treated groups. There were significant improvements in the bronchus histopathology after immunotherapy with 1217A or 1217B which were evaluated by tracheal thickness, inflammatory cell count, and tracheal rupture of mouse lung.

Conclusion: It revealed that 1217A or 1217B could regulate the immune responses and improve pulmonary function. Data suggests that modified LWDHW of 1217A or 1217B have the potential for use as a therapeutic intervention for the treatment of mite allergen Der p 2-induced allergic asthma.

Keywords: Allergic asthma; Der p 2; Dermatophagoides pteronyssinus; House dust mite; Immunotherapy; Liu-Wei-Di-Huang-Wan (LWDHW).


Conflict of interest statement

The authors declare that they have no competing interests.

Figures

Fig. 1
Fig. 1
Experimental schedule for intraperitoneal sensitization, immunotherapy, and intratracheal challenge. BALB/c mice were IP-sensitized with 5 µg nDer p 2 which emulsified with Al(OH)3 on days 1, 7, and 14 except for the Naïve group. Immunotherapy was conducted continuously on days from 21 to 42. The mice were fed according to the following group arrangement. Naïve: the entire experiment was done without any manipulation used as a reference for physiological state and environmental variables. Saline: mice fed with saline 100 µl/ mouse/ day after sensitization. 1217A: fed with 2.5 mg/ 00 µl/mouse/ day modified LWDHW-1217A after sensitization. 1217B: fed with 2.5 mg/100 µl/mouse/day modified LWDHW-1217B. DEX: fed with Dexamethasone 1 µg/100 µl/mouse/day. AHR: Airway hyperresponsiveness; Sac: Sacrifice after the AHR measurement on day 46
Fig. 2
Fig. 2
HPLC chromatograms of ten representative standards and formula of TCM-1217A or 1217B. A Retention time of standard- loganin and catalpol. B Retention time of standard-allantoin and alisol acetate B. C Retention time of standard- pachymic acid, methyl gallate, and saponin. D Retention time of standard- baicalin, baicalein, and wogonin. E Retention time of formula TCM-1217A. F Retention time of formula TCM-1217B
Fig. 3
Fig. 3
Productions of Der p 2-specific IgE, IgG1, and IgG2a in the sera from different groups after TCM-1217A or 1217B treatment. Serum concentrations of Der p 2-specific IgE, IgG1, and IgG2a on Day 46 were measured by ELISA after mice had been sacrificed. A Der p 2-specific IgE, B Der p 2-specific IgG1, C Der p 2-specific IgG2a. Values were presented as means ± SD of optical density (OD) 405 nm of each group (n = 6). #: Compared to the Naive group; *: p < 0.05 compared to the immunotherapy with the saline group; 1217A: immunotherapy with TCM of modified LWDHW-1217A; 1217B immunotherapy with TCM of modified LWDHW-1217B
Fig. 4
Fig. 4
Differences in inflammatory cytokine or Th1-related cytokine productions in sera and BALF were measured by ELISA after immunotherapy. The cytokine productions of IL-5 and IFN-γ in the sera were measured. The BALFs were collected from mice after sacrifice and cytokine productions of IL-5 and IFN-γ in the sera were measured. Data for each cell are expressed as means ± SD pg/mL for each group (n = 6). #: p < 0.05 compared to the Naive group; *: p < 0.05 compared to the treatment with saline. The groups meant the use of agents during immunotherapy after the allergen sensitization
Fig. 5
Fig. 5
Effects of 1217A and 1217B on inflammatory cell infiltration in the airway. Differences of inflammatory leukocyte subpopulations in BALF from different groups after sacrifice. Inflammatory cell infiltrations of leukocyte subpopulations including macrophages, lymphocytes, eosinophils, and neutrophils in BALF were measured by Cytospin smears for leukocyte counting. Total: total cells of leukocytes. Data for each cell are expressed as means ± SD × 104 cells/mL for each group (n = 6). #: p < 0.05 compared to the Naive group; *: p < 0.05 compared to the immunotherapy with the saline group; Groups meant the usage during the immunotherapy
Fig. 6
Fig. 6
Effects of 1217A and 1217B on the Gene expressions of the inflammatory cytokines, chemokine, and transcription factors in lung tissues. Total mRNA was extracted from the lung tissue of mice after sacrifice. The mRNA of lung tissue was acquired for real-time quantitative-PCR assay (Q-PCR) to investigate gene expressions. The TH2-related genes (IL-4, IL-5, and IL-13), TH2-related transcription factor (GATA-3), neutrophil chemotactic chemokine (IL-8), and the TH1-related transcription factor (T-bet) were used to evaluate the gene variations. GAPDH is used as an internal control gene for normalizing the target gene expression of each sample. The histogram shows the normalized expression levels of the target gene/ GAPDH as mean ± SD. #: p < 0.05 compared to the Naive group; *: p < 0.05 compared to the treatment with saline
Fig. 7
Fig. 7
Effects of TCM-1217A and 1217B on the phosphorylation of STAT6, STAT1, and ERK and activation of GATA3. Protein samples from lung tissue lysates among the groups were separated on 12% of SDS-PAGE and transferred to PVDF membranes. Equal amounts of proteins were used for Western blotting using GAPDH, STAT1, and STAT6 as an internal control of protein levels among groups. There were six mice conducted from each group. Representative data showed according to their treatment. All experiments were performed at least three times. A The representative data of phosphorylated(p)-STAT6, GATA3, p-STAT1, and p-ERK among different groups with individual treatment, as indicated in the panel. B The relative levels of p-STAT6, GATA3, p-STAT1, and p-ERK are presented as mean ± SD with a histogram. #: p < 0.05 compared to the Naive group; *: p < 0.05 compared to the saline group. **: p < 0.01 compared to the saline group
Fig. 8
Fig. 8
The flow cytometry analysis of cell percentages in CD3/CD4+/CD8+ and Th1/Th2 cytokine expression in CD4+ leukocytes. A Three-color staining was used to analyze the expression of CD3+ CD4+ (CD4+ T cells) and CD3+ CD4 (CD8+ T cells) in the CD45+ cells. The lymphocytes were gated on an SSC (side scatter) vs. CD45+ cells dot plot as gate region-P1 (P1). Three separate populations of CD45+ cells appeared in this three-color staining. The CD3 expression cells are on the bottom left. Expressions of CD3+ CD4+ cells (CD4+ T cells) on the upper right and CD3+ CD4 (CD8+ T cells) on the bottom right. B Data are presented as the mean ± SD of three independent experiments. A total of 1 × 104 cells were analyzed for each sample. #: p < 0.05 compared to the Naïve group; *: p < 0.05 compared to the saline group. C Three-color staining was used to analyze the expression of Th1-type cytokine (IFN-γ) and Th2- type cytokine (IL-4) in the CD4+. Lymphocytes were gated on an FSC (forward scatter) vs. SSC (side scatter) dot plot as gate region-1 (R1). Expression of IFN-γ in CD4+ T cells gated as region-2 (R2) and IL-4 in CD4+ T cells gated as region-3 (R3). D Percentages of IFN-γ+/CD4+ and IL-4+/CD4+ T cells after immunotherapy present as a histogram of means ± SD. A total of 1 × 104 cells were analyzed for each sample. E The expression portion of IFN-γ+/CD4+ and IL-4+/CD4+ T cells is presented as a percentage. The ratio of Th2/Th1 was calculated as IL-4+/CD4+ divided by IFN-γ+/CD4+. #: p < 0.05 compared to the Naïve group; *: p < 0.05 compared to the saline group. F Cell viability assay with propidium iodide staining by flow cytometry. Fluorescence greater than 104 is regarded as dead cells and presented as P1. G Percentage of cell viability presented as mean ± SD in three independent repetitions
Fig. 8
Fig. 8
The flow cytometry analysis of cell percentages in CD3/CD4+/CD8+ and Th1/Th2 cytokine expression in CD4+ leukocytes. A Three-color staining was used to analyze the expression of CD3+ CD4+ (CD4+ T cells) and CD3+ CD4 (CD8+ T cells) in the CD45+ cells. The lymphocytes were gated on an SSC (side scatter) vs. CD45+ cells dot plot as gate region-P1 (P1). Three separate populations of CD45+ cells appeared in this three-color staining. The CD3 expression cells are on the bottom left. Expressions of CD3+ CD4+ cells (CD4+ T cells) on the upper right and CD3+ CD4 (CD8+ T cells) on the bottom right. B Data are presented as the mean ± SD of three independent experiments. A total of 1 × 104 cells were analyzed for each sample. #: p < 0.05 compared to the Naïve group; *: p < 0.05 compared to the saline group. C Three-color staining was used to analyze the expression of Th1-type cytokine (IFN-γ) and Th2- type cytokine (IL-4) in the CD4+. Lymphocytes were gated on an FSC (forward scatter) vs. SSC (side scatter) dot plot as gate region-1 (R1). Expression of IFN-γ in CD4+ T cells gated as region-2 (R2) and IL-4 in CD4+ T cells gated as region-3 (R3). D Percentages of IFN-γ+/CD4+ and IL-4+/CD4+ T cells after immunotherapy present as a histogram of means ± SD. A total of 1 × 104 cells were analyzed for each sample. E The expression portion of IFN-γ+/CD4+ and IL-4+/CD4+ T cells is presented as a percentage. The ratio of Th2/Th1 was calculated as IL-4+/CD4+ divided by IFN-γ+/CD4+. #: p < 0.05 compared to the Naïve group; *: p < 0.05 compared to the saline group. F Cell viability assay with propidium iodide staining by flow cytometry. Fluorescence greater than 104 is regarded as dead cells and presented as P1. G Percentage of cell viability presented as mean ± SD in three independent repetitions
Fig. 9
Fig. 9
Differences in airway hyperresponsiveness (AHR) to methacholine were measured among these groups after immunotherapy. Pulmonary function of mice was measured after intratracheal challenge with allergen-nDer p 2 in the Naïve group and immunotherapy groups. Methacholine plays the role of a bronchoconstriction agent at a concentration of 6.25, 12.5, and 25 mg/ml. PBS Inhalation was the baseline of pulmonary function. The AHR to methacholine was measured 30 min after the intratracheal challenge, and the AHR presented as enhanced Pause (Penh) values with means ± SD. #: p < 0.05 compared to the Naïve group; *: p < 0.05 compared to the saline group
Fig. 10
Fig. 10
Pathology variety in mouse lungs from different groups acquired immunotherapy with TCM-1217A or 1217B after sensitization with mite allergen. A Pathology images of each group are presented respectively. Lung tissue cut at 5 μm thickness and stained with hematoxylin–eosin (100X and 40X magnification). Representative photomicrographs from mice treated with Naïve and immunotherapy with saline, DEX, 1217A, and 1217B. B 5-μm thick lung tissue sections were stained with Masson’s Trichrome of the collagen-rich fibrotic region present in blue for fibrosis detection (100X magnification). C The histologic score for each field is shown in terms of tracheal thickness, inflammatory cell count, and tracheal rupture. D Semiquantitative evaluation of lung pathology based on hematoxylin–eosin stain and evaluated with tracheal thickness, inflammatory cell count, and tracheal rupture. Ten visual fields of each mouse were observed, and the pathological features in the lung among different groups were presented as histological scores. #: p < 0.05 compared to the Naïve group; *: p < 0.05 compared to the saline group

Similar articles

References

    1. Venter C, Palumbo MP, Sauder KA, Glueck DH, Liu AH, Yang IV, et al. Incidence and timing of offspring asthma, wheeze, allergic rhinitis, atopic dermatitis, and food allergy and association with maternal history of asthma and allergic rhinitis. World Allergy Organ J. 2021;14(3):100526. doi: 10.1016/j.waojou.2021.100526. - DOI - PMC - PubMed
    1. Luskin AT, Chipps BE, Rasouliyan L, Miller DP, Haselkorn T, Dorenbaum A. Impact of asthma exacerbations and asthma triggers on asthma-related quality of life in patients with severe or difficult-to-treat asthma. J Allergy Clin Immunol Pract. 2014;2(5):544–552. doi: 10.1016/j.jaip.2014.02.011. - DOI - PubMed
    1. Murdoch JR, Lloyd CM. Chronic inflammation and asthma. Mutat Res Fundam Mol Mech Mutagen. 2010;690(1–2):24–39. doi: 10.1016/j.mrfmmm.2009.09.005. - DOI - PMC - PubMed
    1. Mei D, Tan WSD, Wong WSF. Pharmacological strategies to regain steroid sensitivity in severe asthma and COPD. Curr Opin Pharmacol. 2019;46:73–81. doi: 10.1016/j.coph.2019.04.010. - DOI - PubMed
    1. Gaffin JM, Phipatanakul W. The role of indoor allergens in the development of asthma. Curr Opin Allergy Clin Immunol. 2009;9(2):128. doi: 10.1097/ACI.0b013e32832678b0. - DOI - PMC - PubMed